Multi-touch Attribution in Amplitude
Learn how you can apply various attribution models to reports in Amplitude.
Browse by Category
Multi-touch attribution, attributing success to various property values, is a staple in digital analytics platforms. While there are endless debates about whether multi-touch attribution is accurate or will be replaced by newer approaches (e.g., incrementality), many organizations still rely on it. At Amplitude, we had many internal debates about whether we should even add multi-touch attribution to the product since it is becoming increasingly less relevant in the current GDPR and cookieless world. But, as more and more organizations asked us to help them replace their current marketing analytics vendor (especially Google Analytics), having multi-touch attribution was a firm requirement. We look at MTA as a bridge to the next version of attribution, and believe there are many organizations that will continue to rely on it for the next few years.
Product teams are often spared the multi-touch attribution debates since the most popular use cases for multi-touch attribution are more marketing-focused – acquisition channels and campaign codes. The typical multi-touch attribution scenario goes like this. Visitors to a digital property come three times from three acquisition channels (e.g., SEO, Paid Search, Email). After the third visit, the visitor completes a lead form. Some people at the organization believe that SEO should get credit (first touch); others think that email should get credit (last touch), and others believe that credit should be divided evenly (linear). Regardless of which attribution method you prefer, having the ability to view the same events with different attribution models can help provide more context and guide future investment decisions.
At Amplitude, we see many product teams collaborating with their marketing counterparts to understand the entire conversion funnel. Understanding how customers are acquired is essential to customer engagement and retention. Amplitude recently introduced the ability to capture the acquisition channel that brought each customer to the product. Now, Amplitude has added the ability to perform multi-touch attribution across those channels. But multi-touch attribution isn’t limited to just marketing use cases. There are many ways that product teams can take advantage of Amplitude’s new attribution features. The following details how multi-touch attribution works for marketers and product teams in Amplitude.
Using Attribution in Amplitude
Using multi-touch attribution in Amplitude is easy because no additional instrumentation work is needed. Amplitude’s attribution feature leverages the existing data collection your organization has in place and applies attribution models to the timestamped data that already exists. Since Amplitude knows the sequence in which data values were collected, it can retroactively apply attribution models to any Amplitude property.
Amplitude’s attribution feature includes the following attribution models out-of-the-box:
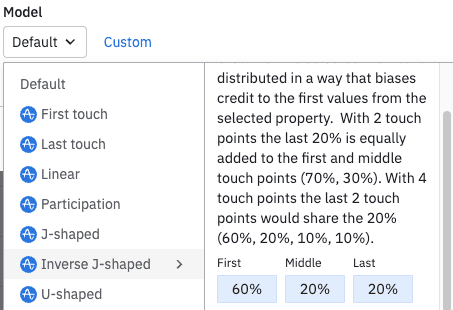
Each attribution model assigns credit to property values based upon a different percent for the first, last, and intervening values. For example, the first touch model would give 100% credit to the first value, while the last touch model would attribute 100% credit to the last value.
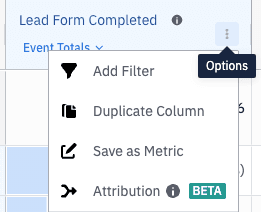
Attribution models can be added to the new Data Tables visualization in Amplitude by clicking on the three dots in the column heading for any event or metric:
When choosing an attribution model, setting the appropriate attribution lookback window is essential. The lookback window you select determines how far back Amplitude will look for property values to include in the attribution model. While the default is 30 days, you can choose different lookback windows up to 365 days.
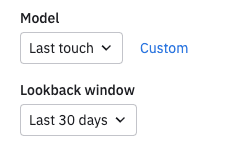
For example, if you have a longstanding campaign, you might want to make the attribution lookback window 365 days to include the entire year. While most digital analytics products limit the attribution lookback window to 60 or 90 days, Amplitude provides more flexibility with longer attribution lookback windows.
Once you have chosen your attribution model and lookback window, you will see the attributed data within the data table report:

In this case, you can see the event count in the reporting period and five different attribution models. While the event total will be the same, how those events are assigned “credit” is based on the attribution model. This allows analysts to interpret the data and identify potential differences. In this example, if you were relying on the default last touch attribution, it would look like Email is your best channel. But when you look at the other attribution models, you can see that “Direct” was initially the main channel used to drive people to the digital product (first touch).
Another significant aspect of Amplitude’s attribution feature is that you can build a custom attribution model. Using the custom option, you can assign credit using allocation percentages of your choosing and specify any lookback window:
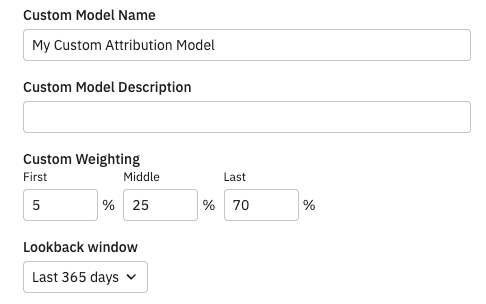
Here, I have created a custom “hockey stick” attribution model with a year’s lookback window.
In addition to modifying the allocation percent and lookback window, the custom attribution model also enables you to exclude property values from the attribution model. For example, let’s say that you wanted to look at a last-touch attribution model that excludes the Email acquisition channel. You could exclude that value and have Amplitude recalculate the attribution within the model to exclude email traffic:
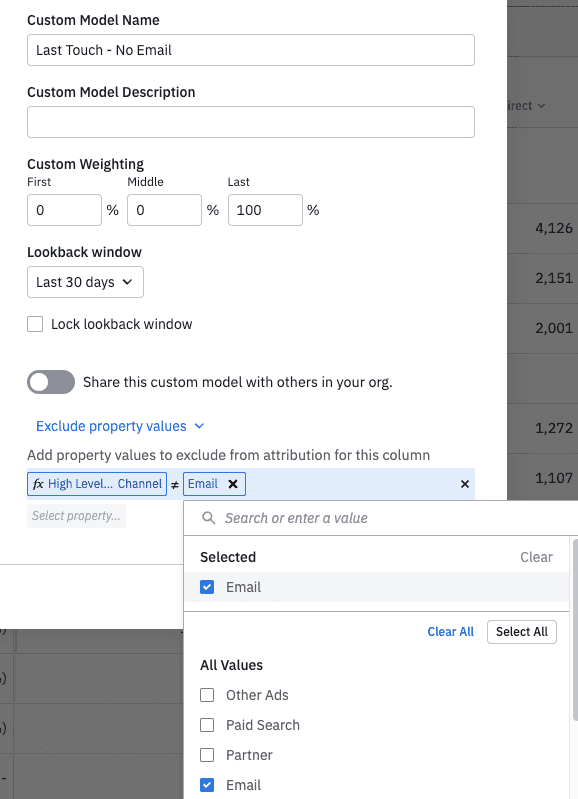
This would then show the data with this new attribution model. In this case, you can see that the channel that benefited the most from excluding Email as an acquisition is Direct, followed by Organic Search and External Referrals.
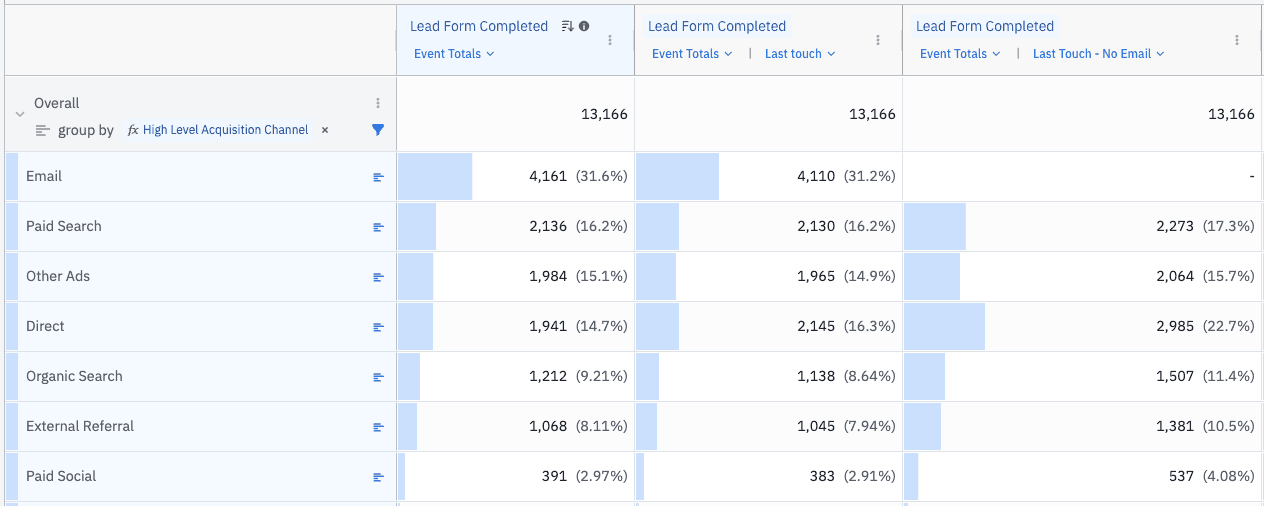
The ability to exclude any Amplitude property from attribution models is an advanced feature that isn’t available in most digital analytics products.
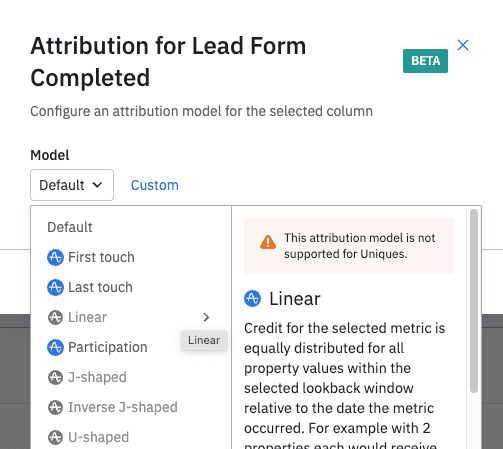
One important note related to attribution is that some attribution models don’t work (nor make sense) when you report on unique visitors (as opposed to event totals). When you report on unique visitors, you can only use the first touch, last touch, and participation (user-based) models:
Combining Marketing and Product Attribution
Product teams often spend time analyzing how customers engage with their products. They look at usage flows, retention patterns, user cohorts, etc. In some cases, they may identify a specific cohort of users and want to understand from where they originated. Seeing product usage by acquisition source has traditionally been difficult since many organizations use a different marketing analytics product (e.g., Google Analytics) to track customer acquisition. It can be challenging to connect the acquired user’s marketing behavior to the product behavior they exhibit once they begin using the product.
Now that Amplitude offers acquisition channel and attribution features, product teams can combine product engagement/usage with acquisition source and apply attribution modeling. To combine product and marketing activity, product teams can work with their marketing counterparts to add Amplitude code to the marketing website. Amplitude code can be added to the website using any of our typical sources or, if using Google Tag Manager, through our free GTM templates. Once code is added, website users will be assigned an Amplitude ID. If the user authenticates from the same device, Amplitude will associate their acquisition data with their subsequent product usage data (if they don’t authenticate from the same device, there are other ways to make an association). Once that connection is established, product teams can view product usage data by acquisition source and apply attribution.
For example, let’s suppose there is a cohort of users that use advanced product features. These users are taking full advantage of what the product offers, but they may only represent a fraction of overall users. It may be interesting to see if there are specific acquisition sources that drive more of these “power users” to the product. The product team can look at product engagement in Amplitude and split it out by the two different product usage cohorts and view this by acquisition channel with a specific attribution model (in this case, last touch):
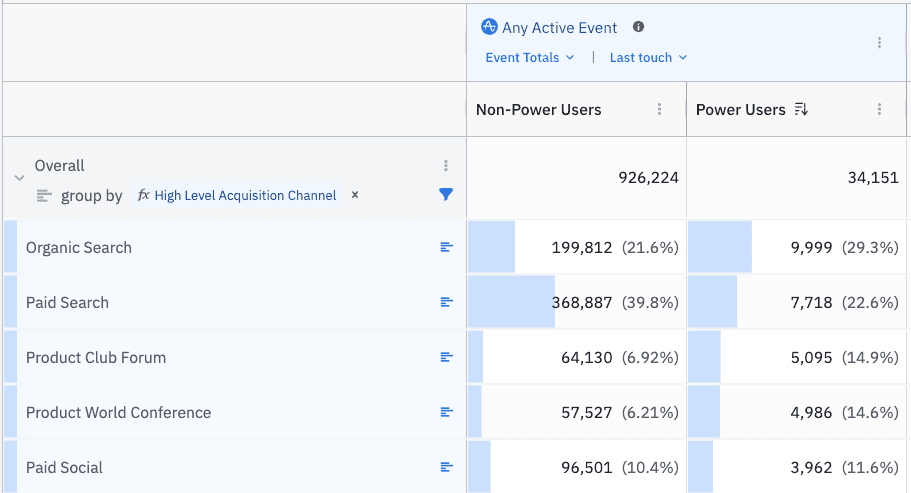
In this example, a disproportionate number of power users come from the Product Club Forum and the Product World Conference. This might represent a target-rich environment for future marketing investments that could produce more power users.
Other Product Attribution Use Cases
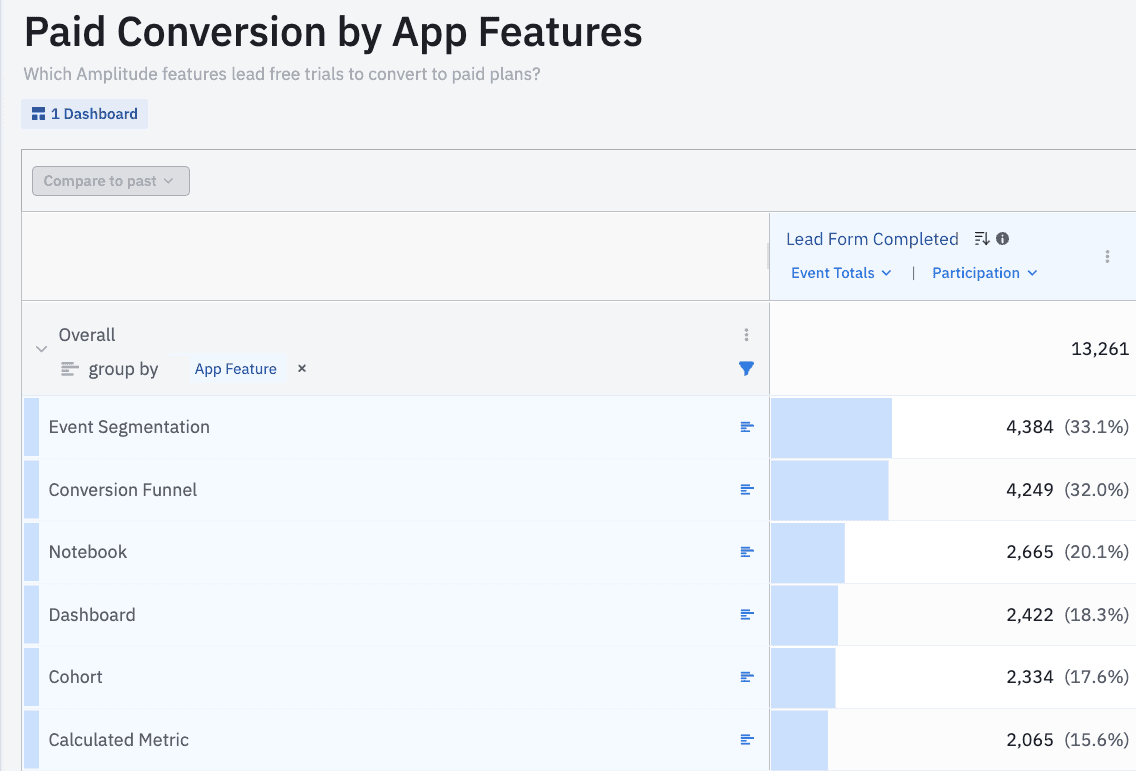
While product teams can leverage some of the marketing attribution use cases described above, they can also use Amplitude’s new attribution feature to assist with product-specific analysis. Because the new Amplitude attribution feature works with any Amplitude property, it can be used to see how product features or content impact product success.
Let’s say a product team wanted to know which app features contributed to free trial users converting to a paid plan. The product team could pass the product/app feature names to an Amplitude property and then apply attribution to those features for the Paid Plan Conversion event as shown here:
Another use of attribution by product teams might be identifying which help or onboarding content led to paid plan conversion. Perhaps certain pieces of content in the documentation or help area consistently lead to increased product conversion. Having this knowledge could enable the product team to surface this information earlier in the free trial process to increase the likelihood of paid conversion:
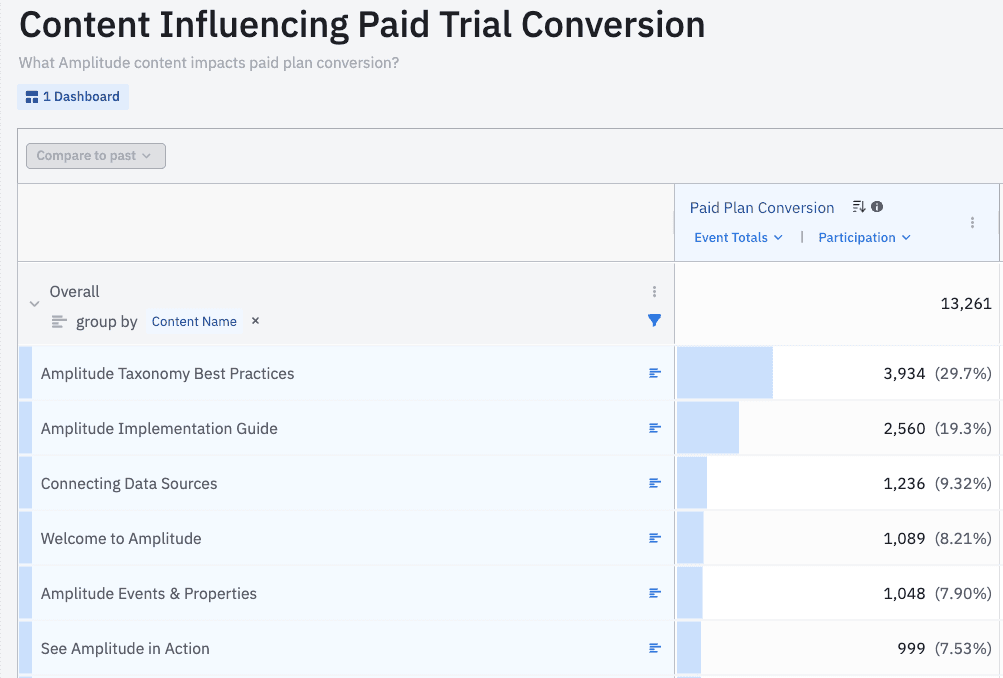
In this case, it turns out that the typical “Welcome to Amplitude” content shown to new free trial users is not as important as educational content related to taxonomy and implementation.
Summary
As shown here, there are many uses for attribution in both marketing and product teams. As marketing and product teams increase collaboration to build better products and experiences, there will likely be more situations where attribution can be helpful.
Amplitude’s new attribution feature is currently available as part of an open beta release in our growth and enterprise plans. We’ll be sharing more details about availability and packaging in the coming weeks. To learn more about the attribution feature, check out the documentation here, or download the Platform Buyer's Guide:

Adam Greco
Former Product Evangelist, Amplitude
Adam Greco is one of the leading voices in the digital analytics industry. Over the past 20 years, Adam has advised hundreds of organizations on analytics best practices and has authored over 300 blogs and one book related to analytics. Adam is a frequent speaker at analytics conferences and has served on the board of the Digital Analytics Association.
More from Adam

