Optimize Your Ecommerce Conversion Funnel with Product Analytics
Get more out of your ecommerce conversion funnel by using product analytics to uncover insights to improve the customer experience and increase conversions.
Ecommerce companies are used to analyzing their conversion funnel, running A/B tests, and measuring their success in terms of revenue. But revenue only benefits the company, not the customer. Ecommerce brands should also be putting their experiments to work to improve the customer experience. Why?
Because, in the long run, focusing on the customer experience is good for companies, too. CX solutions company Incept found that enterprise companies earning $1 billion+ annually that invest in customer experience make an additional $700 million in revenue within three years. To optimize your ecommerce conversion funnel for the best customer experiences, you need to use product analytics.
In its simplest form, an ecommerce conversion funnel measures how many users enter the funnel by beginning to shop online, and how many reach the bottom by making a purchase. In reality, the customer journey is much more complicated. Some customers land on their preferred item from a Google search, others scroll through page after page looking for the perfect fit, and some won’t make a purchase until they’re given an enticing offer.
To drive customers through your funnel, you need to understand how these behaviors and experiences impact their likelihood to purchase, and nudge more users along the winning paths. Product analytics gives you the quantitative data to do so.
What Is an Ecommerce Conversion Funnel?
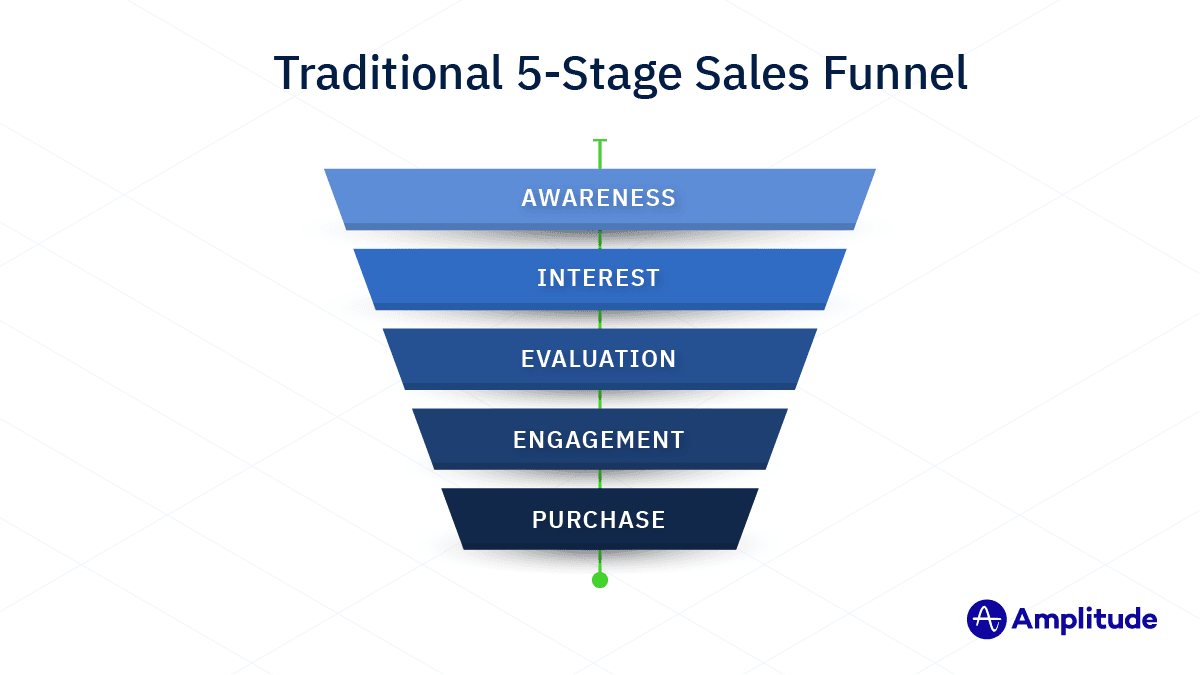
The ecommerce conversion funnel is a representation of the stages online shoppers pass through on their way to completing a purchase. Ecommerce funnels are an adaptation of the traditional sales funnel, which looks like this:

The funnel typically has five stages: awareness, interest, evaluation, engagement, and action.
Awareness is how people first learn about your brand. This stage encompasses everything from social media advertisements to ecommerce content marketing. It’s aimed at users who are not yet familiar with your brand and haven’t visited your website yet.
Interest means you’ve gotten a potential customer’s attention. They are browsing product pages or using the search bar.
Evaluation is the stage where people are weighing their options and considering a purchase. That might mean reading product reviews or checking the expanded product descriptions.
Engagement means they are in the final stages of making a purchase decision. They’re adding your product to their shopping carts.
The purchase. They’ve completed the checkout process, and your product is on the way out the door.
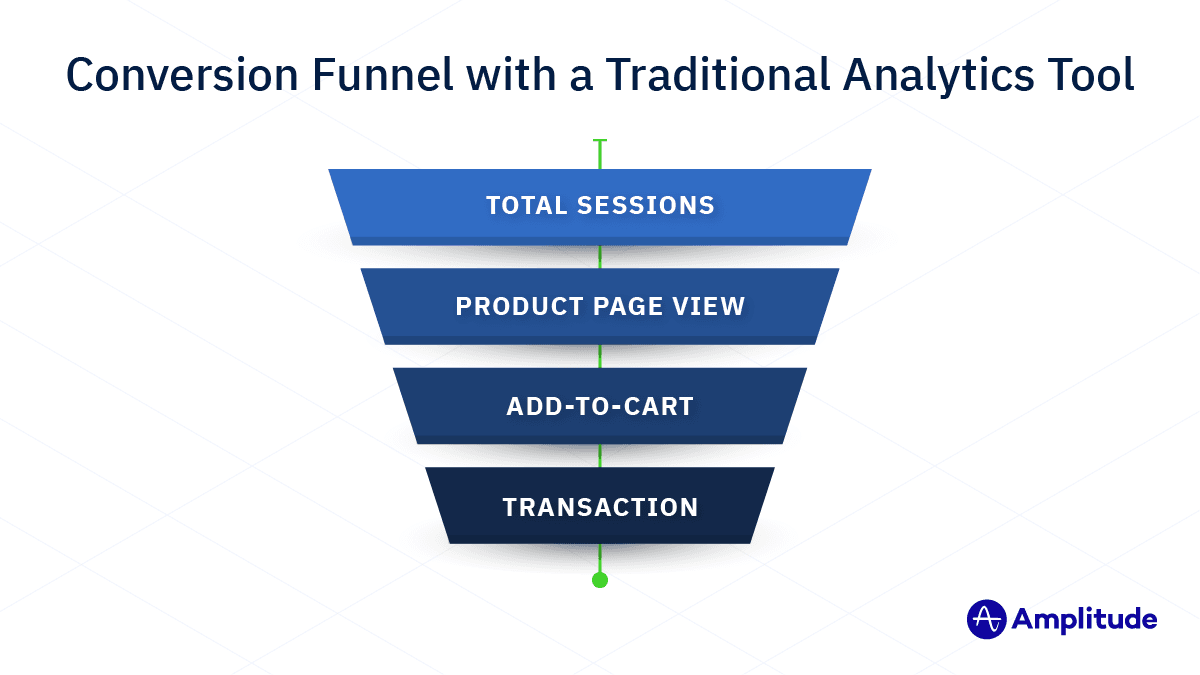
When analyzing the ecommerce conversion funnel with a traditional analytics tool like Google Analytics, those stages are typically represented by the number of sessions on the relevant website pages.

The problem with this type of analysis, however, is that a real customer journey is much more complicated. Many of your users won’t follow a linear progression through the funnel—they’ll enter and exit at different stages or skip some steps entirely. Generic marketing analytics can tell you how many users drop off at each stage, but they can’t tell you much about the customer experience. They can’t give you insights that are detailed enough to figure out why a customer churns or help you ask and answer other questions about user behavior.
Why Use Product Analytics to Optimize Your Ecommerce Conversion Funnel
Product analytics provides deeper insight into why your customers behave the way they do, which allows you to create positive experiences for each of them. Understanding your customers and improving their experience makes you more competitive. As we’ve discussed before, customer experience is the single largest driver of your retention rate.
Product analytics provides a complete picture of the user experience at each stage of the funnel, not just on which variation of an A/B test led to more revenue. Specifically, it allows you to ask and answer powerful questions about your customers, such as:
- Is this a first-time user or a repeat user?
- Have they made purchases, received offers, or been shown an experiment?
- Have they performed any other important behavior in this session or any previous session?
Most teams are familiar with funnel analysis through marketing-focused platforms like Google Analytics. But marketing analytics can’t answer these types of questions, because they sample data, and therefore miss critical moments in the customer journey. Amplitude can, because we track a user’s events from both the current session and any previous sessions, and across both web and mobile experiences.
How to Analyze and Optimize Your Ecommerce Conversion Funnel
Here are four ways to use product analytics to analyze and optimize your ecommerce conversion funnel for a better customer experience.
1. Explore your marketing and engagement campaigns
Your marketing and engagement campaigns take place at the top of the funnel, at the awareness or attribution stage. Using product analytics at this stage will help you find the campaigns most relevant to each user, based on their individual customer journeys.
Attribution questions that product analytics can answer:
- What was the very first campaign or attribution channel that drew a user into our product?
- Do users purchase immediately after seeing an ad?
- What are the leading indicators of a purchase or drop-off, and which users are showing those leading indicators?
Customers will usually browse your website more than once before making a purchase. But marketing analytics can’t differentiate between users, and doesn’t capture their complete experience with your brand. Product analytics can tell you how many sessions a user needs to complete before they convert and which campaigns lead users to each session.
For example, one campaign might be more efficient at bringing users to their first session but not at getting them to make a purchase. Meanwhile, the campaign that leads users to their first purchase might not be effective when it’s shown to users who haven’t visited your website before.
Product analytics can show you that both campaigns are valuable in progressing users toward making a purchase—and that both create a positive customer experience. In this case, the optimal customer experience depends on how many sessions a user has already had on your website. Without understanding the complete customer journey, you might focus only on the purchase-linked campaign.
2. Do Frequency Analysis
Frequency analysis tells you the number of times an event was performed by an individual user or across a user set. From there, you can identify what aspects of your purchase experience are working well, and where are your friction points for improvement. You can perform this analysis at any stage of the funnel.
Frequency analysis answers questions such as:
- How many times did a user view a product before purchasing?
- Did users check out successfully the first time, or did they have to go through the process multiple times?
- What is the number of offers a user receives before purchasing?
- How many times did a user read product reviews before adding an item to their shopping cart?
Knowing the frequency of these events informs how many times you should prompt a user with new offers, show them digital advertisements, or remind them about an empty cart. If these prompts still don’t lead to a purchase, you know to divert your resources elsewhere.
Parsing customer journeys by how many times an individual user has performed an event is costly and time-consuming. That is, unless you use Amplitude’s latest code-less feature, Milestone Analysis.
3. Discover Drivers of Conversion
Conversion drivers are the actions that happen in between steps of the funnel that are correlated (or anticorrelated) with moving to the next step in the funnel. Identifying conversion drivers lets you know what actions to encourage and what problems to fix.
Questions to explore:
- Where are friction points that cause users to drop off?
- What behaviors are most correlated with purchases?
- What behaviors are most correlated with drop-off?
To use the Conversion Drivers feature in Amplitude, designate two steps in the funnel: a starting event and an outcome. Amplitude automatically sorts through all of the data to find the events users perform between those two steps. Each event gets a correlation score. You can see what percentage of users performs each event, along with how long it takes them to convert after doing so. This shows you whether that event is accelerating or decelerating your funnel.
Once you know which events help users convert and which lead them to drop off, you can make targeted modifications to improve the customer experience in your funnel. You can fix the issues that are causing friction and make the positively correlated events more prominent. For example, if you see that reading particular product reviews leads users to add items to their shopping cart, you could pin those reviews to the top of the review section.
4. Level Up Your Experiments with Behavioral Cohorts
You are likely running lots of experiments on your ecommerce website simultaneously, A/B testing different landing pages, product photos, and more. You can increase the impact of these experiments by creating behavioral cohorts. Cohorts are groups of users who share a characteristic—in this case, they were shown the same experiment on your website.
Questions answered by cohorting:
- What website experiment groups does a particular user belong to?
- What are the purchase rates for users within a given experiment group?
- What is the impact of each experiment on goals such as viewing items, purchasing, and becoming a long-term customer?
You can improve each cohort’s experience on your website by analyzing their user history and preferences, sending them specialized offers or making new product suggestions. You’ll also be able to see which experiments improved the customer experience and then replicate that success with more users.
Go Further
Conversion funnels generally list the purchase as the last step, but the customer journey extends beyond that. There’s the fulfillment and return process, along with remarketing for repeat purchases and long-term retention. Product intelligence, which combines product analytics, data management, and behavioral targeting, helps you go deep into your ecommerce website data to understand your customers, improve their experience, and grow your business.

Grant Wensley
Former Technical Product Marketing Manager, Amplitude
Grant is a former technical product marketing manager, writing the “how we do it” section of Amplitude’s story.
More from Grant


