
Heatmaps
See what’s hot, and what’s not
Visualize engagement to spot friction, optimize user experiences, and drive growth.
See
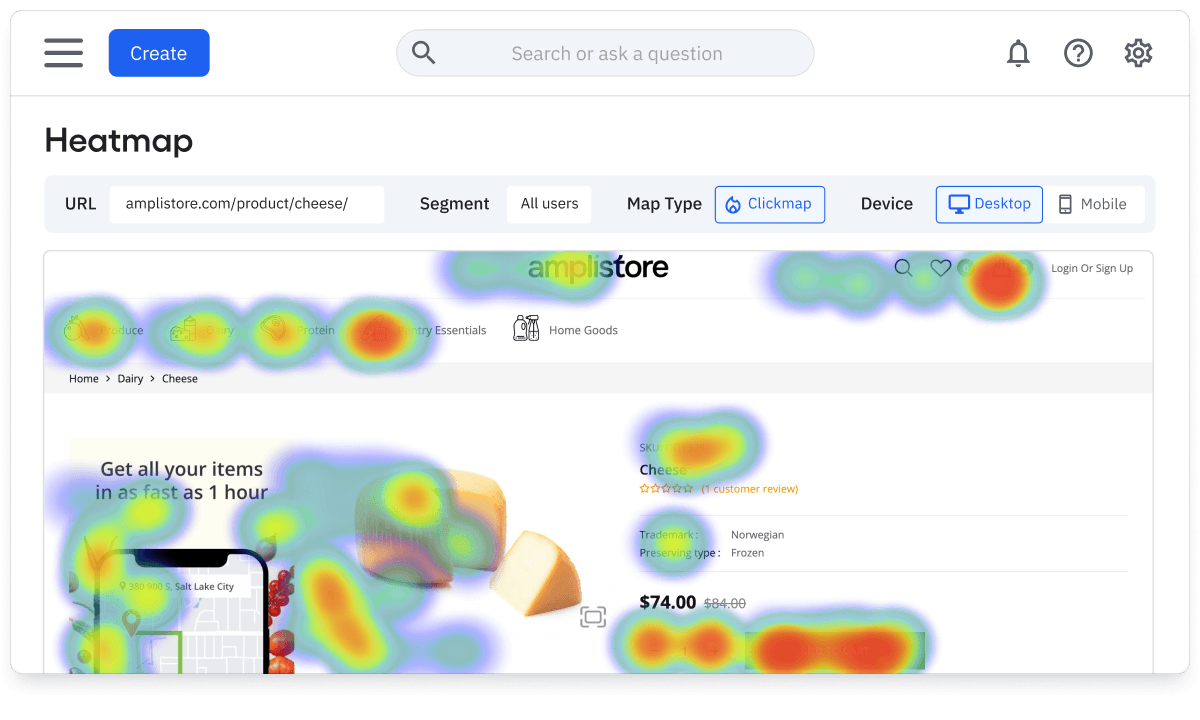
Visualize user behavior instantly
Understand what captures attention—and what doesn’t—at a glance. Amplitude Heatmaps show clicks, scrolls, and engagement hotspots on your website or web app.
- Spot friction, rage clicks, and underperforming CTAs
- Visualize behavior across different devices and screens
- Capture every user interaction—no extra tagging required
Explore
Understand the “why” behind the data
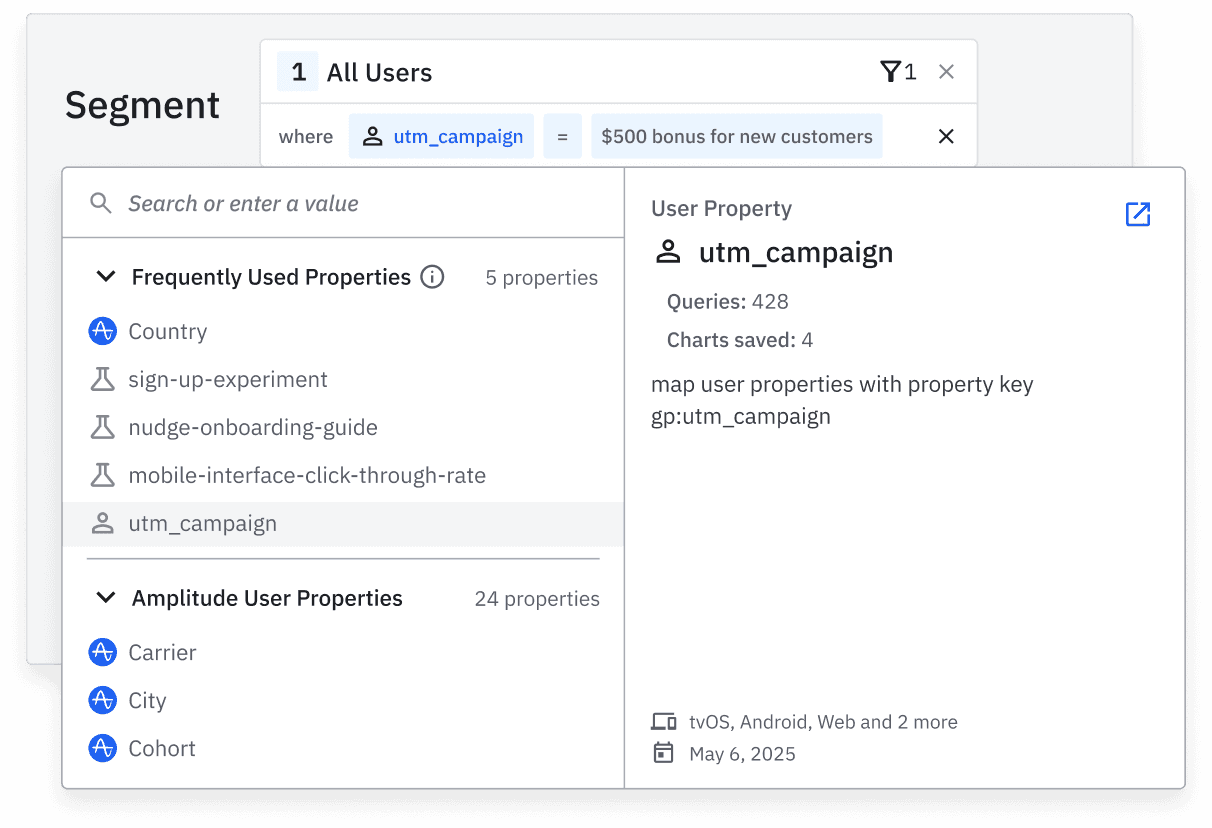
Clicks are just the beginning. Heatmaps connect to your full analytics stack, so you can explore root causes, not just symptoms.
- Filter by segment, campaign, or experiment group
- Use alongside journeys and funnels to diagnose drop-offs
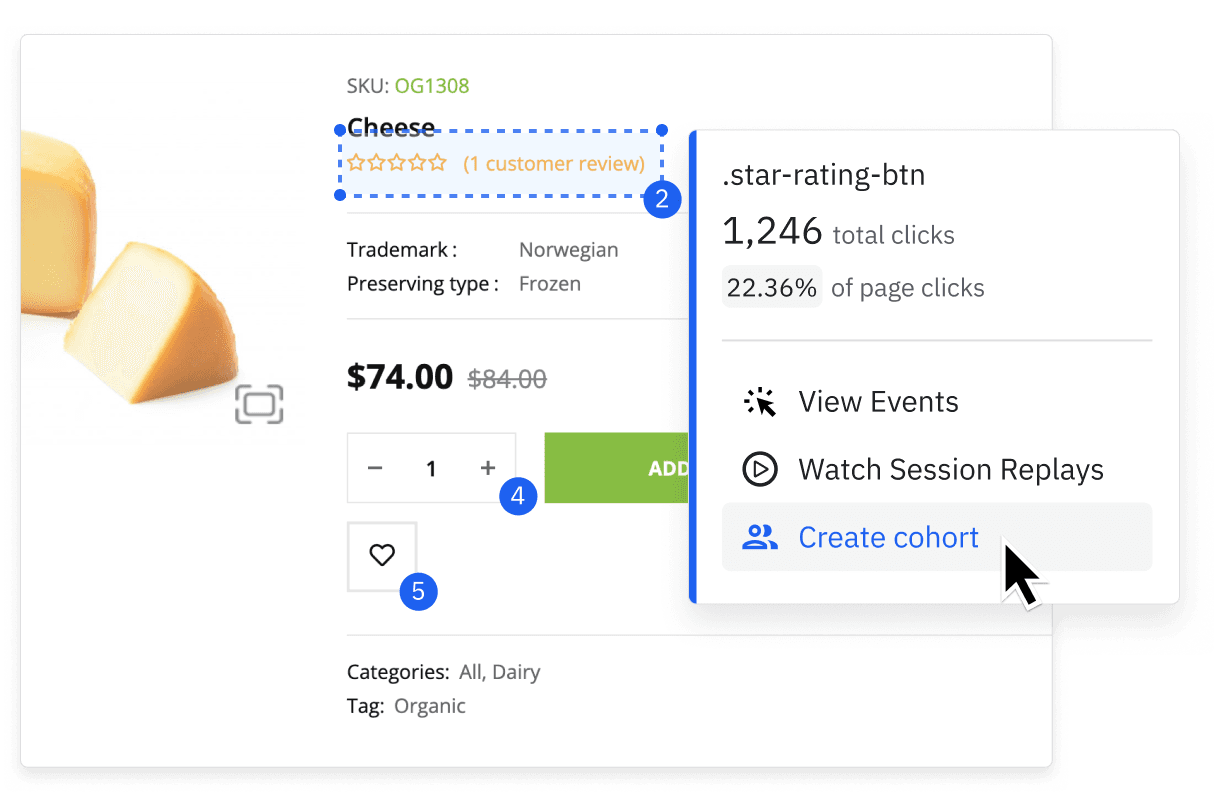
- Use Session Replay to see how real users experience a page
Act
Follow through on insights without switching tools
Amplitude doesn’t stop at answers—we help you move faster to act on them. Heatmaps are integrated into the workflows your teams already use.
Three ways to see what users do
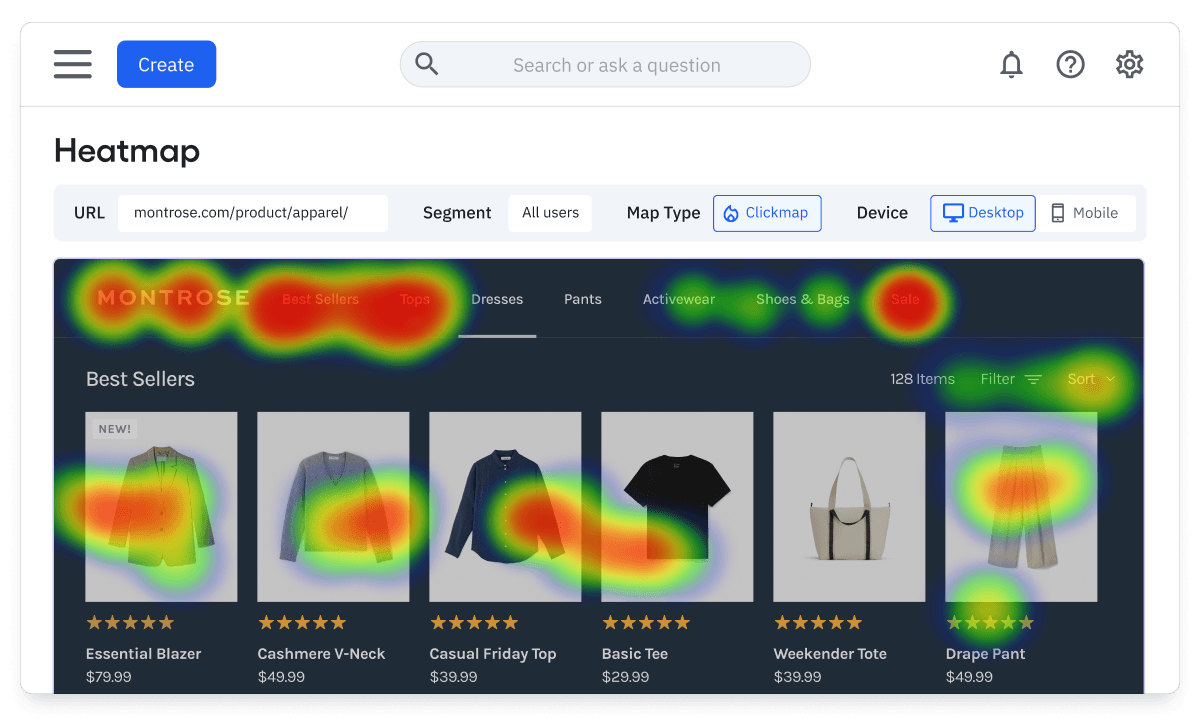
Explore clicks, scrolls, and custom elements to understand how users engage with your website—from CTA taps to drop-off zones.
Pinpoint exactly where users click on a page so teams can refine designs and improve usability based on popular page elements.
Grow your business with our better together platform

Heatmaps + Session Replay
Use Heatmaps to spot aggregate behavior patterns, then jump into replays to see exactly how your users experience your site.

Heatmaps + Experimentation
See how users interact with each variant—not just which one wins. Use Heatmaps to validate changes and uncover why one test performs better.

Heatmaps + Analytics
Add visual context to your metrics. Use Heatmaps to explore the behaviors behind drop-offs, conversions, and engagement across pages and cohorts.

Heatmaps + Activation
Build audience segments directly from any heatmap to quickly take action. Run experiments, create a survey, or sync to ad platforms for audience retargeting.

“Heatmaps helped us uncover a critical UX issue we didn’t even know existed. We were able to see firsthand how frustrating our app could be for mobile users, then push mobile accessibility upgrades straight onto our roadmap.”

Shawn Hymer
Data and Strategy Analyst, Palo Alto Software

Get started with Heatmaps
Get a clear picture of how users interact with your digital experiences—what’s working, what’s missing, and what’s driving outcomes—so you can take smarter action, faster.
Frequently asked questions
Amplitude Heatmaps visually show where users click, scroll, and engage across your site or web app. They’re layered directly over your live interface—no extra tagging or tools needed. Learn more about heatmaps.
Amplitude currently supports click maps, scroll maps, and selector maps for websites and web apps. These help you visualize how users interact with buttons, forms, and other page elements.
Amplitude Heatmaps are built into a unified platform, not a standalone tool. This means you can go beyond surface-level visuals and insights by connecting Heatmaps to journeys, funnels, and advanced segmentation.
Additionally, you can easily act on your insights. You can experiment to test layouts, copy, and content changes. You can create guides to deliver timely in-product messaging that eliminates user confusion and friction. And you can create surveys to collect qualitative feedback at key moments and get the full story of what you’re seeing users do.
With Amplitude, everything lives in one place, so teams can move from insight to action without jumping between tools or losing context.
As of February 2026, not yet, but mobile support is coming soon. Today, you can use Amplitude Heatmaps across your desktop and mobile web experiences.
No additional setup or tagging is required. If you’re already using Amplitude Session Replay, you can enable Heatmaps directly within the platform. Learn how to create your first heatmap.
Amplitude Heatmaps are only available to Growth and Enterprise customers who have purchased the Session Replay add-on.
We offer support plans for every stage of your growth journey. Start for free with on-demand resources like our documentation and the Amplitude Academy. Or choose from a paid plan with access to dedicated customer success and professional services teams that guide you through every step of onboarding, implementation, and instrumentation. Get help setting up your product metrics, dashboards, and data so you succeed from the start.