A Beginner's Guide to Attribution Model Frameworks
Learn about the different types of attribution models and how to decide which to use.
Originally published on February 9, 2024
Browse by category
An attribution model is a framework for determining how to credit different marketing activities for conversions. Different channels, like social media, email newsletters, and your website, and different touchpoints, like a specific blog post, Facebook ad, or discount email, influence customers’ buying decisions. Attribution models help you understand which marketing channels and touchpoints are most effective.
Key takeaways
- Organizations use attribution models to credit buyer conversion to different parts of the customer journey.
- Attribution models help you understand the effectiveness of your marketing efforts and double down on successful tactics.
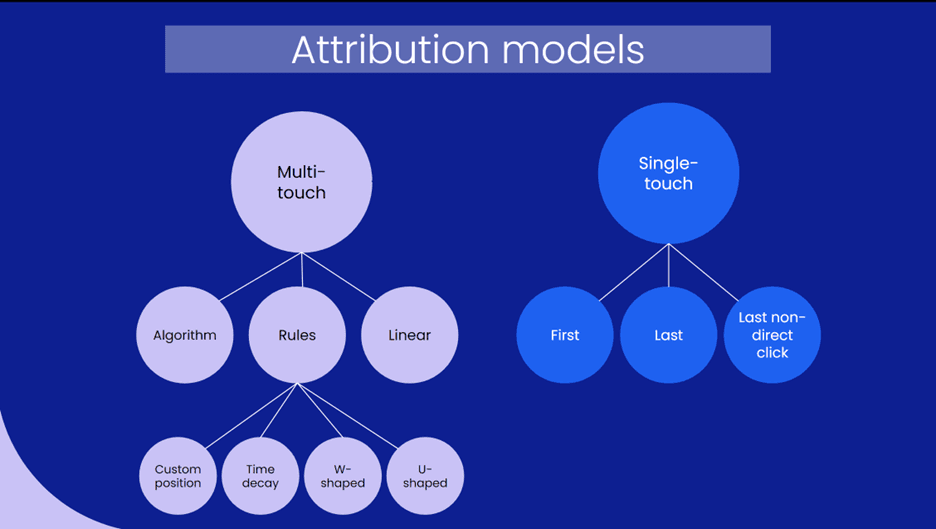
- There are two primary attribution models: single-touch, which involves giving all the credit for a conversion to just one touchpoint, and multi-touch, in which more than one touchpoint receives credit.
- Within the multi-touch category, there are linear models, rule-based models, and algorithmic models.
- The best model to use depends on your business model, marketing strategy, and budget.
- You can use Amplitude to compare different models and identify which fits your marketing best.
What is an attribution model?
Attribution models provide a set of rules or algorithms for determining which touchpoints along the buyer’s journey are responsible for conversion.
Attribution models help you understand where to focus your marketing efforts. Seeing the return on investment (ROI) for different marketing efforts enables you to double down on successful approaches and improve or remove channels that don’t convert.
Without attribution models, most organizations don't fully understand what drives conversions. For example, you might notice that a marketing campaign is more or less effective during a specific period. Still, without attribution, you likely can’t pinpoint what specifically contributes to this success or failure. Attribution models weigh different parts of the buyer’s journey to assign credit to the touchpoints so you can analyze their effectiveness.
Different types of attribution models
Multiple attribution models exist and fall into two main categories: single-touch and multi-touch. In single-touch attribution models, one touchpoint or channel gets all the credit for the conversion. In multi-touch models, credit is shared across several points.

Within the single- and multi-touch models, there are different frameworks for attributing responsibility for conversions.
Single-touch attribution models
Single-touch models are most relevant for products with a short buying cycle, where customers typically have very few interactions with the company before deciding to purchase. A model that gives all conversion credit to one touchpoint overlooks the contribution of other digital marketing methods in building trust amongst potential customers.
First interaction vs. last interaction
In the first interaction and last interaction models, a customer’s first or last touchpoint with a company gets 100% of the credit for the conversion.
First and last interaction models are simple and straightforward to implement and relevant for short buying cycles with few touchpoints. However, they don’t accurately represent the complex buyer’s journey.
Suppose a customer saw a Facebook ad for an online yoga class subscription, with the Facebook ad being the first touchpoint. From the ad, they sign up for the company’s mailing list, receive several promotional emails the following week, and continue seeing social media ads.
Finally, they receive a discount code via email that prompts them to subscribe. The discount email is the final touchpoint.
A first-touch or interaction model would entirely attribute the conversion to the Facebook ad. In contrast, a last-touch or interaction attribution model would credit the conversion to the discount email.
In attributing all credit for the conversion to the last touch, we’re essentially saying that all the emails sent during the week weren’t necessary because they didn’t convert the customer. But the truth is that those emails likely contributed value by educating the customer and establishing their trust in the company, so they felt ready to subscribe when they received the discount email.
Last non-direct click
The last non-direct click model is just like the last interaction model but eliminates the last ‘direct action’ a customer takes before conversion, like entering your site’s URL. Credit for conversion essentially goes to the second-to-last touch point, provided the final touch point is a direct action.
The last non-direct click model is usually more accurate than the last interaction model. It considers that buyers typically complete a direct action after they decide to buy but before they start the buying process and convert.
Let’s go back to our yoga subscription example. Imagine that after our customer sees the Facebook ad, they bookmark the website homepage. After receiving the email with the discount code, they access the homepage from the bookmark and buy a subscription.
In the last interaction model, the credit for conversion goes to the website homepage because it’s the customer's last interaction before subscribing. In the last non-direct click model, credit goes to the email with the discount. The model assumes that any ‘direct action’ a customer takes just before conversion isn’t responsible for the conversion.
Multi-touch attribution models

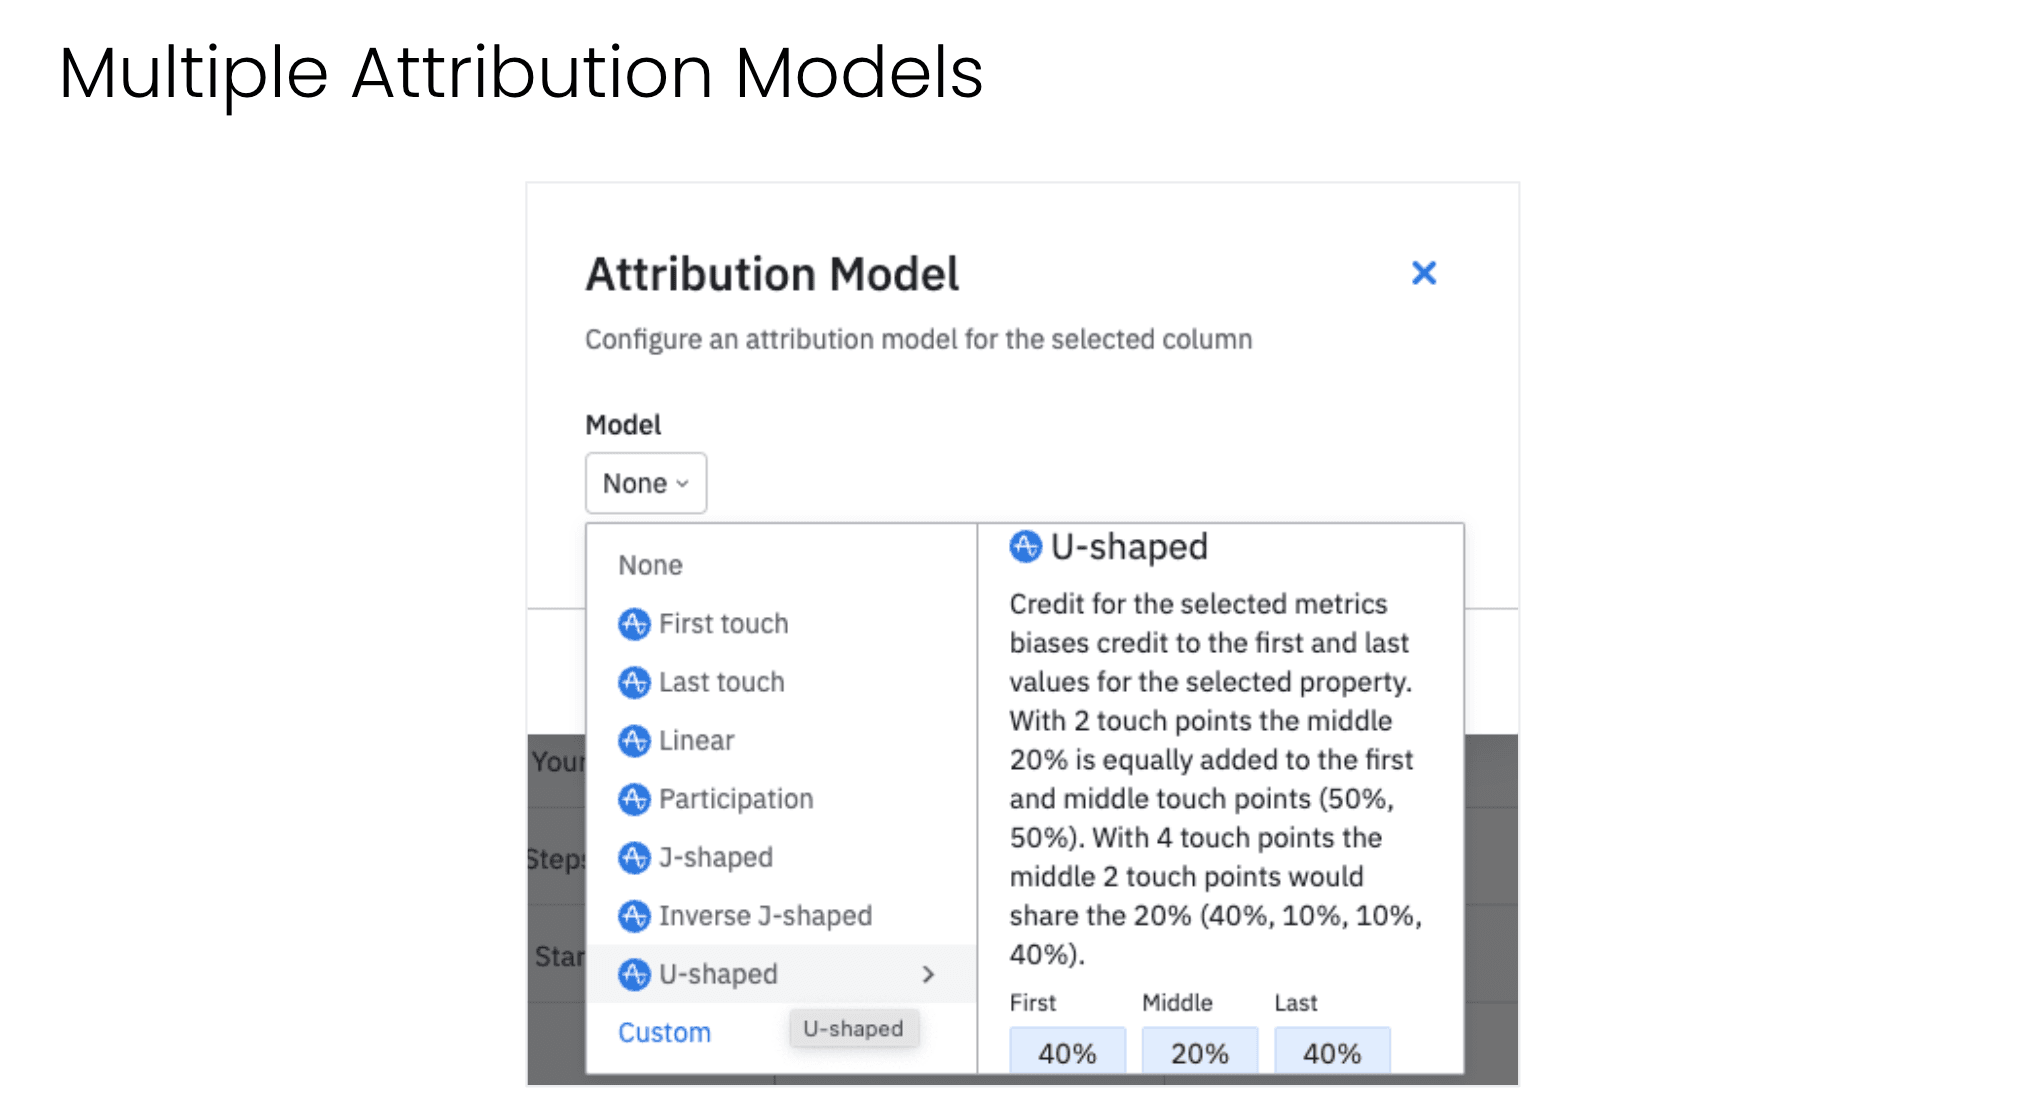
An example of custom attribution models in Amplitude.
The various multi-touch models assign different amounts of credit across the buyer’s journey. You should select a model that makes sense for your marketing strategy so that the credit applied reflects how different touchpoints impact your potential customers.
Linear attribution
In linear attribution models, every touchpoint gets equal credit for the conversion. The linear model is simple and easy to implement but deems all touchpoints equally influential. Our yoga Facebook ad and the various emails in our campaign are all of equal importance in this model.
Rules-based attribution
Rules-based attribution models spread credit across different touchpoints. They’re more nuanced than linear attribution because different parts of the sales funnel are weighted with more or less credit.
U-shaped/Position-based attribution
In U-shaped and position-based attribution models, the first and last touchpoints get most of the credit for the conversion. The rest of the credit is distributed equally throughout the middle touchpoints.
Typically, the first and last touchpoints get 40% of the credit each, and the remaining 20% is distributed equally throughout the middle touchpoints. In our yoga example, the first touchpoint, the Facebook ad, and the last touchpoint, the discount email, would get the most credit for the conversion.
W-shaped attribution
A W-shaped model gives 30% credit each to the top-of-the-funnel, bottom-of-the-funnel, and middle-of-the-funnel touchpoints. The remaining 10% is evenly distributed throughout the touchpoints in between.
Our Facebook ad, an email in the middle of the week, and the final discount email would each get 30% of the credit. All the other ads and promotional emails would get a share of the remaining 10%.
Time decay attribution
The time decay attribution model emphasizes the impact of touchpoints toward the end of the customer journey. The credit given to each touchpoint grows exponentially as the customer moves closer to conversion. If we apply this model to our yoga example, the Facebook ad would get minimal credit, and the discount email would get the most credit for the conversion.
Custom attribution models
Custom attribution models enable you to decide which touchpoints are most important based on the customer journey you’ve designed. Companies typically take a W- or U-shape model and apply some slight adjustments to create a custom model.
Algorithmic or data-driven attribution
Data-driven attribution models use machine learning and predictive analytics to pinpoint the most influential touchpoints based on customer data. With conventional models, you decide which framework works best based on your historical data. In this data-driven model, the algorithm determines which framework fits best, making it the most accurate model.
An algorithmic model is more expensive and complicated to implement, but it’s valuable for complex customer journeys with many touchpoints. Conventional models rely on what you believe about your business and how customers convert.
In contrast, data-backed models leverage the computer’s ability to analyze customer data to understand which touchpoints actually impact conversions.

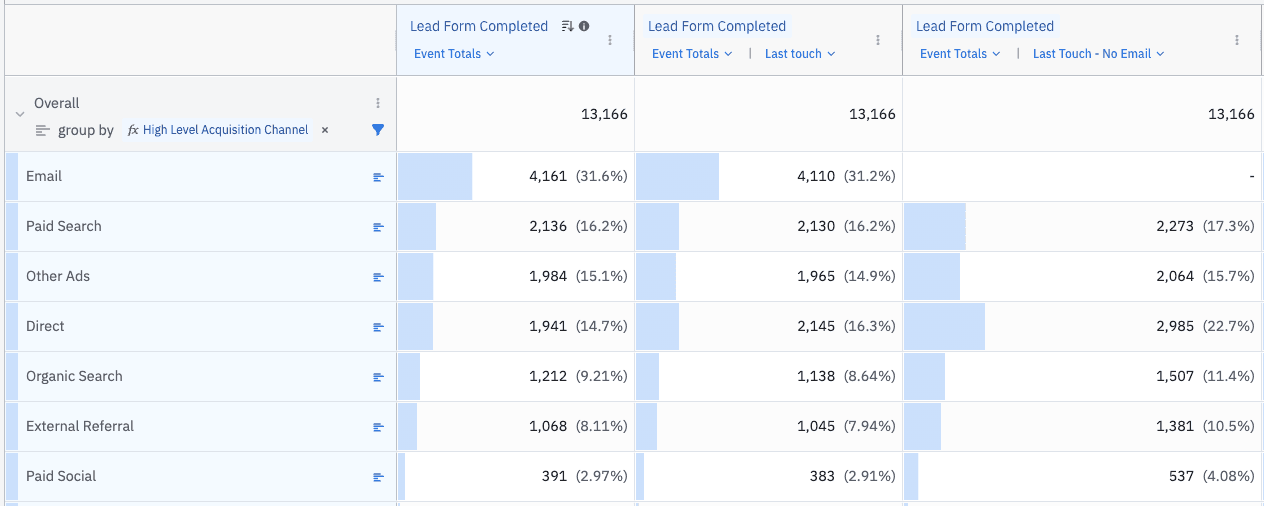
This image shows the results of using attribution models in Amplitude to assign credit in customized ways while analyzing data. This capability is critical for marketers and their business analysts and data science peers alike.
What’s the best model to use?
The best attribution model depends on your business model, marketing strategy, and budget.
Algorithmic or data-driven attribution models offer you the most accurate and unbiased results. However, since they’re expensive and complicated to implement, they’re only accessible to organizations with the budget to absorb the high setup costs.
Single touchpoint models are straightforward to apply, but the results aren’t as accurate as algorithmic models. They can be helpful if you don’t have a lot of historical data to base your decision on or have a very short buying cycle with few touchpoints.
If you have a complex buyer journey with a mix of channels and a range of touchpoints, it’s best to use a multi-touch model. To choose a multi-touch model, use Amplitude to apply different attribution models to your marketing data. Amplitude has several pre-built models you can apply, or you can create a custom model by assigning different percentage weighting to the first, last, and middle touchpoints.
Compare your target metric, whether that’s sign-up, purchase, or conversion, across different models to discover which attribution model most closely matches your customer buying cycle. For instance, if your campaign is high-intent and bottom-of-the-funnel focused, a model like time decay that gives importance to the final touch points would reflect it best.
Attribution example calculation in Amplitude
Here is a brief example highlighting the differences between attribution models and lookback windows. Suppose a user has three touch points before the Sign Up event, each with a different UTM source:
|
UTM source |
Date | Event |
| 2022-05-01 | Viewed Home Page | |
| 2022-05-07 | Viewed Blog Post | |
| tiktok | 2022-05-10 | Viewed Promotion Page |
| 2022-05-10 | Sign Up |
Here are some example combinations of the attribution model and lookback window and the resulting attribution of credit to each UTM source.
| Attribution model | Lookback window | Credit | Explanation |
| First Touch | 30 days | google: 100% | All credit goes to the first touch within the last 30 days, which is google on 2022-05-01. |
| First Touch | 7 days | facebook: 100% | All credit goes to the first touch within the last 30 days, which is facebook on 2022-05-07. |
| Last Touch | 7 days | tiktok: 100% | All credit goes to the last touch within the last 7 days, which is tiktok on 2022-05-10. |
| Linear | 30 days |
google: 33% facebook: 33% tiktok: 33% |
Credit is divided evenly between all three touch points in the last 30 days. |
| Linear | 7 days |
facebook: 50% tiktok: 50% |
Credit is divided evenly between the two touch points in the last 7 days. |
| J-Shaped | 30 days |
google: 20% facebook: 20%
tiktok: 60% |
In the last 30 days, the first touch gets 20%, middle touches 20%, and last touch 60%. |
| J-Shared | 7 days |
facebook: 30% tiktok: 70% |
There is no middle touch, so the 20% gets split across the first and last touches. |
|
Custom 5%-20%-75% |
30 days |
google: 5% facebook: 20% tiktok: 75% |
In the last 30 days, the first touch gets 5%, middle touches 20%, and last touch 75%. |
Determine the best attribution model with Amplitude
There are many uses for attribution to help companies identify which touchpoints, channels, and campaigns lead to conversion. And while determining the best attribution model for your business might seem daunting, Amplitude can help.
Get started with a free plan today to determine your attribution model.

Darshil Gandhi
Director, Product Marketing, Amplitude
Darshil Gandhi is a Director of Product Marketing at Amplitude. He leads global technical and partner product marketing, collaborates with product and go-to-market teams on strategy, positioning, messaging, campaigns, and enablement. He was previously a solutions consulting team principal at Amplitude, and has helped dozens of Amplitude customers turn their data into actionable insights. Darshil graduated from Dartmouth College with a Masters in Engineering Management.
More from Darshil


