Use sessions, channels, and attribution to drive marketing analytics
To get the best view of user behavior and product engagement, it's important to first understand the differences between events, users, and sessions. It’s also critical to understand how channel classifiers, attribution models, and session entries and exits work in Amplitude.
This article explains how Amplitude defines sessions and related metrics, the fundamental concepts of channel classifiers and attribution, and how they're counted and distinguished from one another.
Sessions
Events are at the core of Amplitude Analytics, but tracking users and sessions also help to build the full picture of user engagement and the customer journey:
- Users: Distinct individuals who interact with your product. Amplitude identifies users through cookies, device IDs, or other tracking mechanisms. Read more about how Amplitude tracks unique users in this article.
- Events: Individual actions or interactions that occur within the product, such as page views, button clicks, form submissions, or purchases. Each event is timestamped and carries relevant attributes that Amplitude calls properties. Refer to Determine events to track for more details.
- Sessions: A series of events that represent a user's visit or engagement with your product. Sessions group events together chronologically. Sessions typically have a start time (the first event) and an end time (after a period of inactivity). Refer to session definitions for more information.
To better understand the differences between users, events, and sessions, look at an example of how they’re tracked.
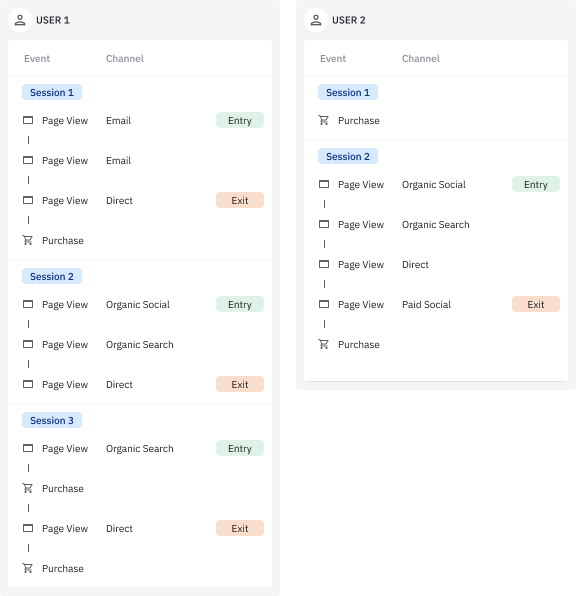
The following timelines illustrate five distinct sessions completed by two unique users, User 1 and User 2:
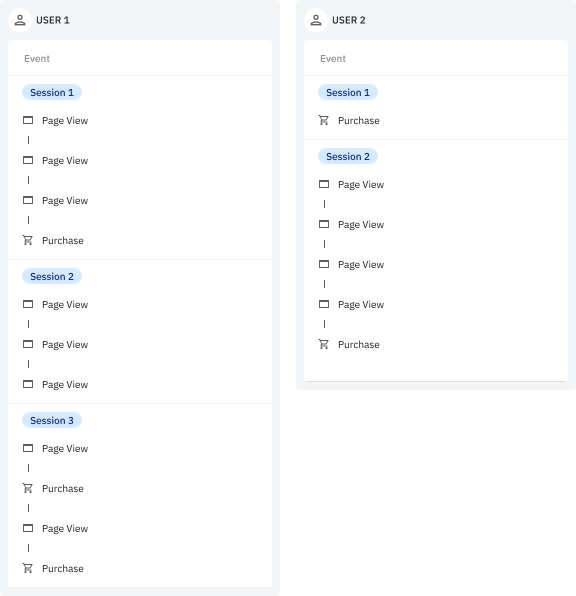
Notice that both User 1 and User 2 completed similar events during their sessions, such as page views and purchases.
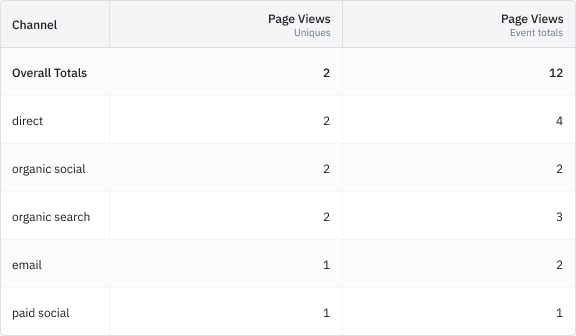
The table below shows the unique counts and overall totals for both users' events:
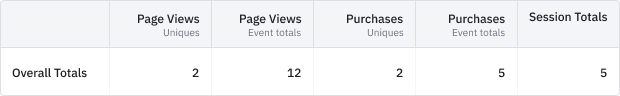
The unique counts are tied to the count of distinct users, and the event totals are a cumulative sum of both users’ events. User 1 and User 2 both triggered purchases, so there's a unique count of two. User 1 completed three purchases and User 2 completed two purchases, giving us a purchase event total of five.
Channel Classifiers
Channel classifiers can help to uncover what is driving the most traffic to your product. They apply to individual events, and are defined as a sequential (executed top to bottom) set of rules that determine the marketing channel that originated each event.
The timelines below show sessions for User 1 and User 2 with their respective channels:
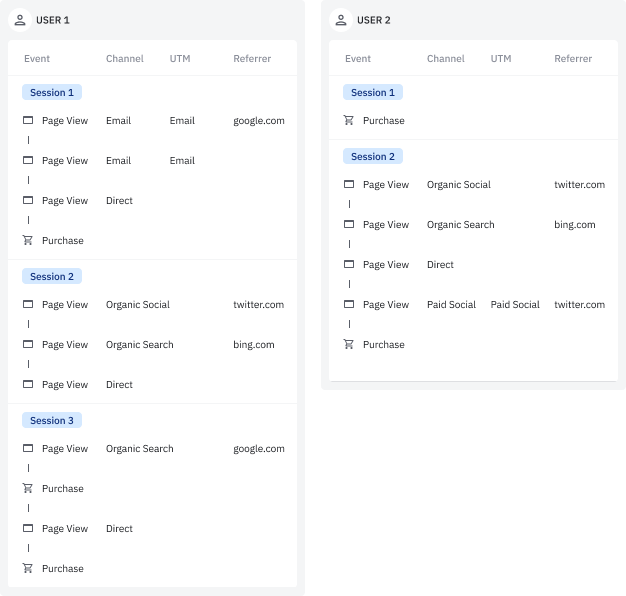
For example, User 1’s first session included four events with two distinct channels, email and direct.
This table shows how these channels are defined based on UTM and Referrer values:
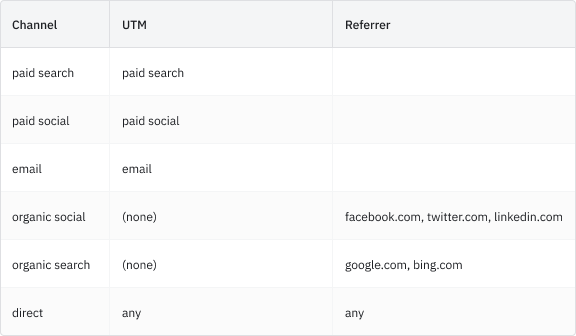
Values that are blank or not present on the event aren't the same as (none).
Notice that the organic search channel has rules in place to include referrer values of google.com and bing.com.
Since channel classifiers apply to events, this table shows the differences between unique counts and page view event totals by channel:
There were two unique page views based on two distinct users. The event totals, however, are a cumulative sum of all events and can tie to each channel. Since both User 1 and User 2 triggered page view events through the direct channel, there were two unique page views and four total page views for direct.
Session metrics
Amplitude also tracks the following session-based metrics:
- Session Totals: The sum of sessions by each observed property value. Amplitude attributes each session to the property values that occur during the session. The sum of group-by values may exceed the total number of sessions.
- Session Entries: The first non-null property value observed within a session, also known as the entry point for the session.
- Session Exits: The final non-null property value observed within a session, also known as the exit point for the session.
See also
To analyze session metrics alongside event metrics in a single chart, including hybrid formulas that combine event and session inputs, try Metric Explorer (Beta).The next example showcases sessions for User 1 and User 2, but notice the channel for each event, as well as each session’s entry and exit points:
User 1's first session's entry point was the email channel, while User 2's second session's entry point was an organic social channel.
This table shows the overall totals of these session-based measures by channel:
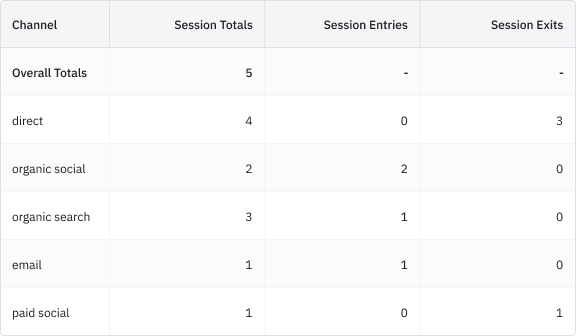
There were five distinct sessions, but each event and session can tie to a channel. For example, the direct channel tied to four of the five sessions, while the organic search channel tied to three.
Session totals for channels are tied to each distinct session. This is why the session total for the email channel is one and not two.
Attribution models
Attribution models help pinpoint which activities lead your users to target outcomes. Similar to channel classifiers, attribution is linked to individual events and doesn't apply to sessions or users. Refer to how Amplitude uses attribution models to give credit to acquisition touch points.In this final example, consider two attribution models:
- First-touch: Credits the initial marketing channel a user encountered within a lookback window, highlighting the journey's starting point.
- Last-touch: Attributes the purchase to the final marketing channel a user interacted with before conversion, emphasizing the crucial closing touch point.
The timelines below visualize sessions for User 1 and User 2, attributing purchase events to marketing channels and first and last touch points:
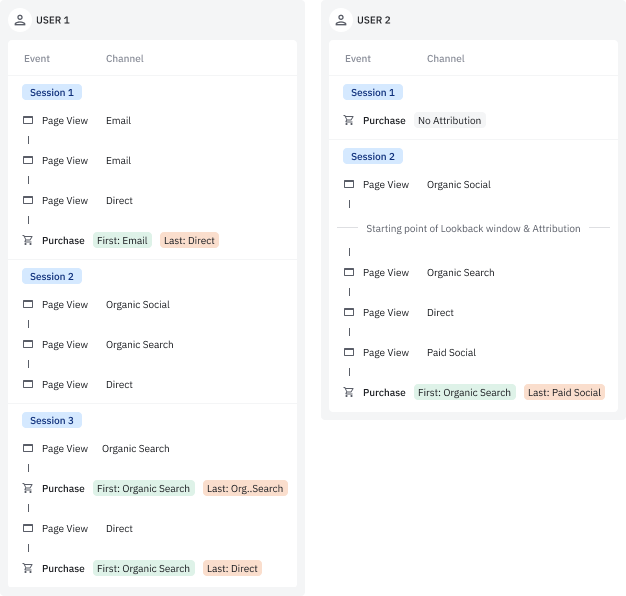
For sessions with attribution, notice the first and last touches defined. User 1’s first session had a first-touch of email and a last-touch of direct. User 2’s second session had a first-touch of organic search and a last-touch of paid social.
The unique counts and event totals by channel and attribution are seen in the table below:
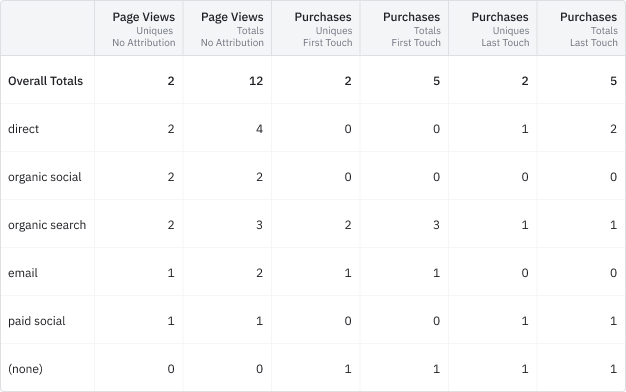
This example's unique counts are tied to the distinct users and the totals are a cumulative sum that can also be tied to relevant channels. The direct channel demonstrates this, showing two unique page views, four total page views, one unique last-touch purchase, and two total last-touch purchases. This is because both User 1 and User 2 triggered page views during sessions with no attribution, but only User 1 completed purchases after a last-touch from a direct channel.
Was this helpful?