Historical Count, part 2: Order of operations
This article helps you:
Understand where Historical Counts fall into Amplitude's order of operations
Amplitude's Historical Count feature helps you achieve a deeper level of understanding when you're investigating why your users are retaining, converting, or engaging—or why they're failing to do that.
Note
Historical Count in the Amplitude order of operations
Whenever Amplitude applies filters to an event (including filters in segments), it does so in a specific order. The Historical Count filter is always applied last.
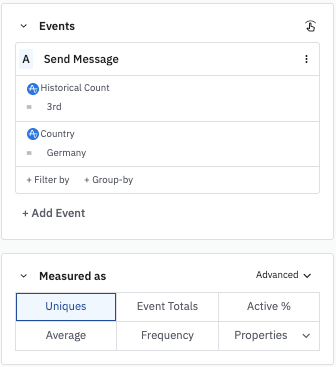
Let's take this Historical Count filter as an example:

With the Historical Count filter applied, this chart will not show you everyone whose third time triggering that event just happened to take place in Germany (i.e., where the first and second instances could have happened anywhere in the world). Instead, it shows the third Germany-located instance of that event—in other words, both previous instances will also have taken place in Germany. It could be the user's third, eighth, or hundredth time performing that event overall, as long as it was only their third that took place in Germany.
Note
Event Historical Count
The Event Historical Count filter works very similarly to the Historical Count filter. While both capture a user's Nth instance of performing a specified action, Historical Count is applied after all other filters have been applied. By contrast, Event Historical Count is applied first, before any other filters.
This can have important implications for your analyses. Let's use the table below to illustrate the difference:
| Time | Maya’s event | Loc’s event |
|---|---|---|
| 1 | run | |
| 2 | walk | walk |
| 3 | run |
If you set up an event segmentation analysis that searches for Any Event where:
Historical Count=1st.Event Name=Run.
This yields two results: Maya at time 1, and Loc at time 3.
Note
By contrast, consider a similar analysis that searches for Any Event where:
Event Historical Count=1st.Event Name=Run.
This gives you only one result: Maya at time 1. This is because Run is Loc's second event, and the Event Historical Count filters out everything but first events.
Historical Count and custom events
The custom event logic will be considered before the Historical Count filter, and will count all of the underlying events triggered by the user.
For example, imagine a custom_event_c, that is triggered when a user triggers either event_a or event_b. Let's say that the user triggers events on the following days:
Day 1: event_a
Day 3: event_b
Day 7: event_b
Day 14: event_a
If we apply the Historical Count filter of 1 to custom_event_c within the time frame, the user will be counted in the data point for Day 1 since event_a was triggered for the first time on that day. The user's events triggered on Day 3, 7, and 14 will not be counted for those days.
When we apply the Historical Count filter of 2 for custom_event_c, the Historical Count will register Day 3 as the day on which custom_event_c was triggered for the second time.
Continue on with the third article in the Historical Count series: Historical Count, part 3: Funnels and behavioral cohorts.
August 14th, 2024
Need help? Contact Support
Visit Amplitude.com
Have a look at the Amplitude Blog
Learn more at Amplitude Academy
© 2026 Amplitude, Inc. All rights reserved. Amplitude is a registered trademark of Amplitude, Inc.