Channels
This article helps you:
Understand how adding a channel can help to better track sources of site traffic
Learn how to create channels and compare metrics between them
Marketers often want to define their acquisition channels based on UTM and referrer data. Amplitude’s channels allow you to create new properties retroactively, based on functions and operators you can apply across multiple existing properties. These don't affect your raw data and Amplitude computes them on the fly.
For example, you may want to understand the distribution of organic traffic to your site. Define a version of your channels that includes the known social and search domains at that time. When a new social or search channel becomes prevalent, you can update your organic search definition and your existing charts update retroactively to reflect the new definition.

Create a channel
You must be an Admin or Manager to create a channel.
To create a channel, follow these steps:
-
Navigate to the Properties section of Amplitude Data and open the Channels tab.
-
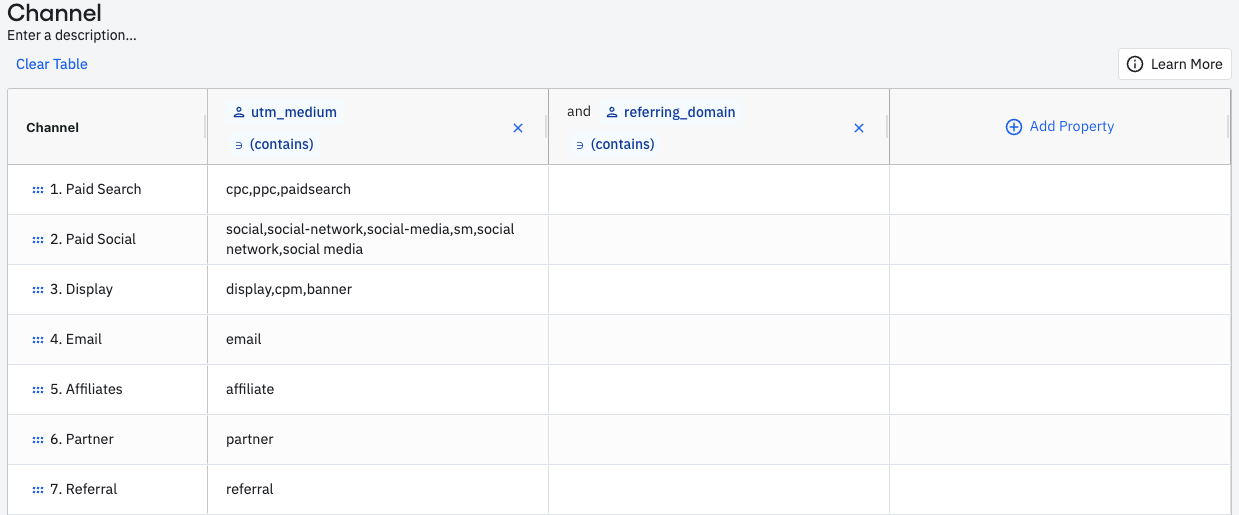
Click + Add Channel Classifier. A pre-built, default channel definition screen opens. Optionally, click the default channel title (Channel) to edit the name. You can also add a description below it, if you like.
-
To begin creating the definition of the channel, start from the default template or click Clear Table to clear the table's contents.
You can add multiple properties to a row to create a more complex classifier.
Tip
Amplitude recommends using user properties rather than event properties for channels because Amplitude applies user properties to future events that a user triggers. For more information, see About user properties and event properties. -
Add one row for each channel you would like to define. For example, you can add rows labeled
Paid,Organic,Referral, andDirectto create a high-level channel definition. -
Fill the values for each row. Each cell must evaluate to
Truefor an event to classify to that channel.If a channel could be defined as
row A OR row B, you can add one row for A and one row for B, and then set the channel name to be the same for both rows. -
Click Save. Amplitude labels channels in property dropdowns under the Channels category.
Compare metrics between channels with Data Tables
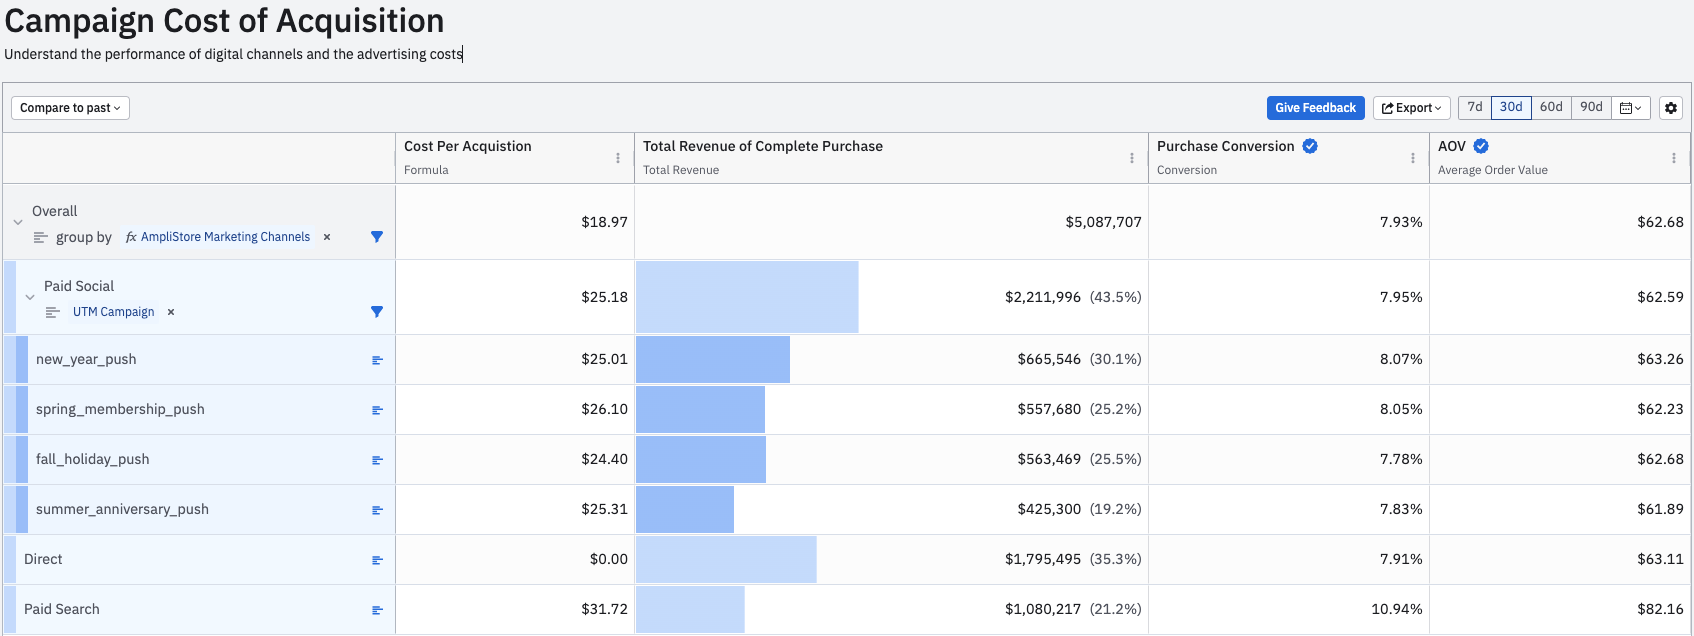
Amplitude’s Data Tables allow you to define metrics critical to your bottom line, such as CPA, AOV, and ROAS. Evaluate how these metrics perform between different channels by grouping by your channel on the left-hand column. To see how these channels break down further, add other core dimensions like campaigns.

Amplitude attributes metrics in different ways if a user has multiple touch points with different channels before converting. Amplitude has built attribution modeling into data tables to enable defining user attribution in your channels.
Tip
CPC --> email --> website
Applying a channel classifier of CPC only results in email and website being filtered out. In this case, the attribution model would attribute to CPC.
Use cases
- Blended views: Easily create top level blended views of all paid and all organic traffic to easily see how efficiency and performance have changed over time.
- High-level channels: Break down your core metrics according to the common definitions of channels you already use in Google Analytics and Adobe.
- Channels with campaigns: Add a property denoting a campaign as a column in your channel definitions, to break down metrics by campaign channels.
- Attribution: Use channels in conjunction with attribution models in data tables to evaluate the breakdown of a metric by first, last, or a custom attribution definition.
Special values
Amplitude evaluates these special values on events:
| Value | Description |
|---|---|
| ANY | Captures explicitly set none values, or any other value that's set on the property. |
| (none) | Captures both explicitly and implicitly set none values. |
| blank | Captures both explicitly and implicitly set none values, or any other value that's set on the property. |
Explicitly vs. implicitly set nones
None values set both explicitly and implicitly appear as none in any Analytics chart.
Explicitly set none values appear when Amplitude receives the property with a value of null.
Implicitly set none values appear when Amplitude receives a property with no value.
June 5th, 2024
Need help? Contact Support
Visit Amplitude.com
Have a look at the Amplitude Blog
Learn more at Amplitude Academy
© 2026 Amplitude, Inc. All rights reserved. Amplitude is a registered trademark of Amplitude, Inc.