Build charts in Amplitude: the Segmentation Module's advanced features
This article will help you:
- Build and manage more complex user segments within the Segmentation Module
- Create a behavioral cohort from within the Segmentation Module
This article expands on the Segmentation Module material covered in the Help Center articles on adding events and user segments to Amplitude charts.
Before you begin
First and foremost, events will not appear in any Amplitude charts until instrumentation is complete, so make sure you've got that done. If you haven't done so already, you'll definitely want to read our introductory article on building charts in Amplitude, which covers the material this article expands on. You should also familiarize yourself with our helpful list of Amplitude definitions, and read up on behavioral cohorts.
Add a list of property values
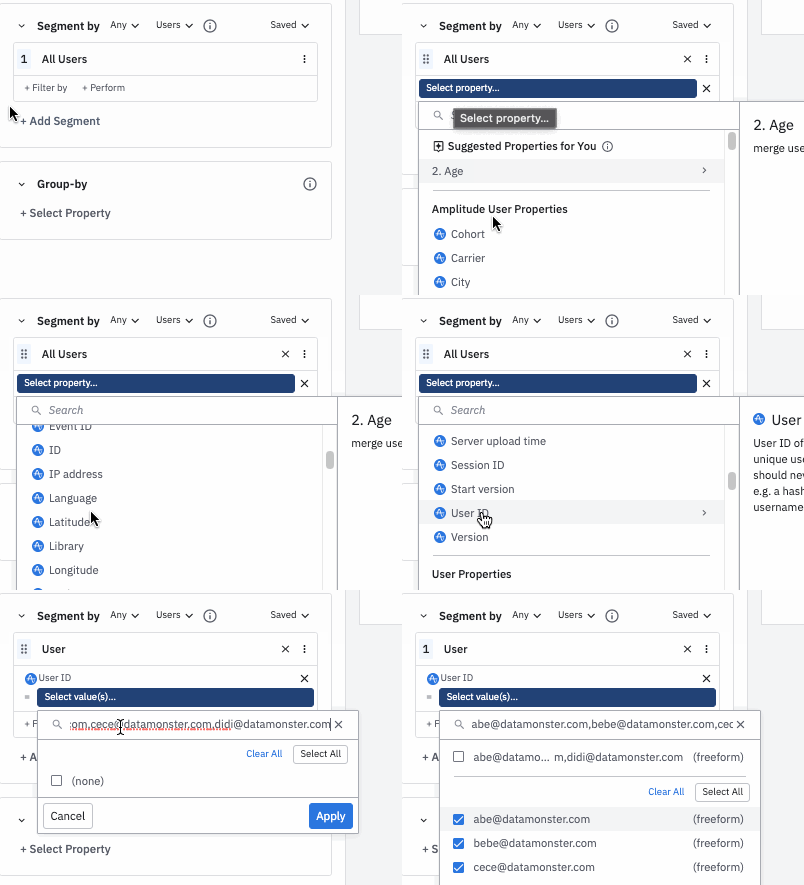
You can include a custom list of property values instead of selecting them from the dropdown list. This is handy when you’re trying to include or exclude a large number of property values from your analysis. To do this, copy a list of comma-separated values to your clipboard and paste it into the box labeled Search or enter a value. Then click Select All, followed by Apply.
For example, if you've instrumented "email" as a user property, you can paste the following string instead of selecting each value one at a time:
abe@datamonster.com,bebe@datamonster.com,cece@datamonster.com,didi@datamonster.com

Note
Rename a segment
By default, Amplitude will append the value of each property you select to the segment's name. If you have a complex or stringently-defined segment, this can become cumbersome.
For example, the chart below will have two segments, where each segment is defined by four different properties, thus making default name hard to read.
You can change the default name by hovering over it and clicking. Changing the segment name will also change the chart labels.
You can save this segment for future re-use by clicking Saved --> Save Segment.
Create inline behavioral cohorts
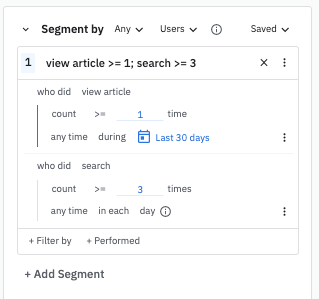
You can create simple behavioral cohorts inline directly within the Segmentation Module, thus negating the need to navigate away into the Behavioral Cohorts tab.
To do so, click + Performed before adding user properties to your segment. For example, the following chart would allow me to see the number of users who both viewed an article in the last 30 days and used the search feature at least three times in a day.

For more information on the clauses available in the drop-downs to create cohorts, see our article on behavioral cohorts in Amplitude.
Historical count
The historical count feature will apply to all events in the Event Segmentation chart. You can read more about it in our historical count documentation.
February 13th, 2026
Need help? Contact Support
Visit Amplitude.com
Have a look at the Amplitude Blog
Learn more at Amplitude Academy
© 2026 Amplitude, Inc. All rights reserved. Amplitude is a registered trademark of Amplitude, Inc.