Heatmaps
AMPLITUDE ACADEMY
Amplitude for Marketing Analytics
Gain actionable insights into customer engagement, conversion, and retention with Amplitude’s Web Analytics, designed to help growth marketers optimize site performance and drive meaningful results.
Learn Marketing AnalyticsHeatmaps uses Session Replay to provide a visual representation of user engagement on your website or application over time. Analyze patterns of events to identify trends, anomalies, and areas of your product that drive the most engagement.
Heatmap retention
Heatmaps are available to customers who have the Session Replay addon. All users with View permissions can create Heatmaps.
Use the following map types, depending on your use case,
| Map type | Use case |
|---|---|
| Click map | Displays the most clicked areas of your site by coordinates. This helps you identify high-traffic areas, optimize components, and improve the user experience. |
| Selector map | Highlights the most interacted with elements on a page along with their rank. |
| Scroll map | Displays the aggregate scroll activity on a given page. See the location of the average page fold, the number of users who scroll to a given depth. |
Legacy organizations
Prerequisites
Before you create a heatmap, ensure your Amplitude instrumentation meets the following requirements.
Session Replay
Client availiability
Heatmaps requires the following minimums:
- Session Replay Browser SDK Plugin: 1.7.0
- Session Replay Standalone SDK: 1.14.0
Session Replay sample rate
Heatmap generation thresholds
No server-side identifiers
Heatmaps requires Amplitude's default device identifiers from the Browser SDK and doesn't support device identifiers from server-side SDKs or third party data sources.
Create a development project (optional)
Amplitude recommends that you create a separate development project to test Heatmapping without impacting your production environment.
Event taxonomy impact
Create a Heatmap
To create a new Heatmap:
- Navigate to Heatmaps in the left navigation in Amplitude.
- Click + New Heatmap.
- Choose a Heatmap type. You can update the map type after at any point.
- Select the URL to analyze. Use the following URL matching options to more easily target the pages you care about.
- Exact match: Matches the URL exactly as you specify it. Ideal for single URLs. For example,
https://amplitude.com. - Pattern match: Uses wild cards to match more than one URL with a similar patterns. Useful for targeting dynamic paths. For example,
https://amplistore/prodcuts/*matches/products/shoesand/product/accessories. - Contains: Matches URLs that contain a specific keyword or segment anywhere in the URL. Useful for common themes. For example
/search?q=matches the search results page for any user query. - Starts with: Matches all URLs that begin with a specific prefix. Useful for capturing sections of a site. For example,
https://amplitude.com/blogcaptures the/blogpage and all subpages.
- Exact match: Matches the URL exactly as you specify it. Ideal for single URLs. For example,
- Select or create a Segment using user properties or cohorts to narrow the focus to a specific set of users.
- Optionally, select different device types to understand how users interact on devices of different widths.
- Choose a background to select the background of your heatmap. Backgrounds are snapshots of a session replay, and represent the page's state during replay collection. Each heatmap generates eight backgrounds, based on the state of the page that generates the most actions during a session.
Map types
Heatmaps provides three views that help you understand how users engage with a specific page.
Click map

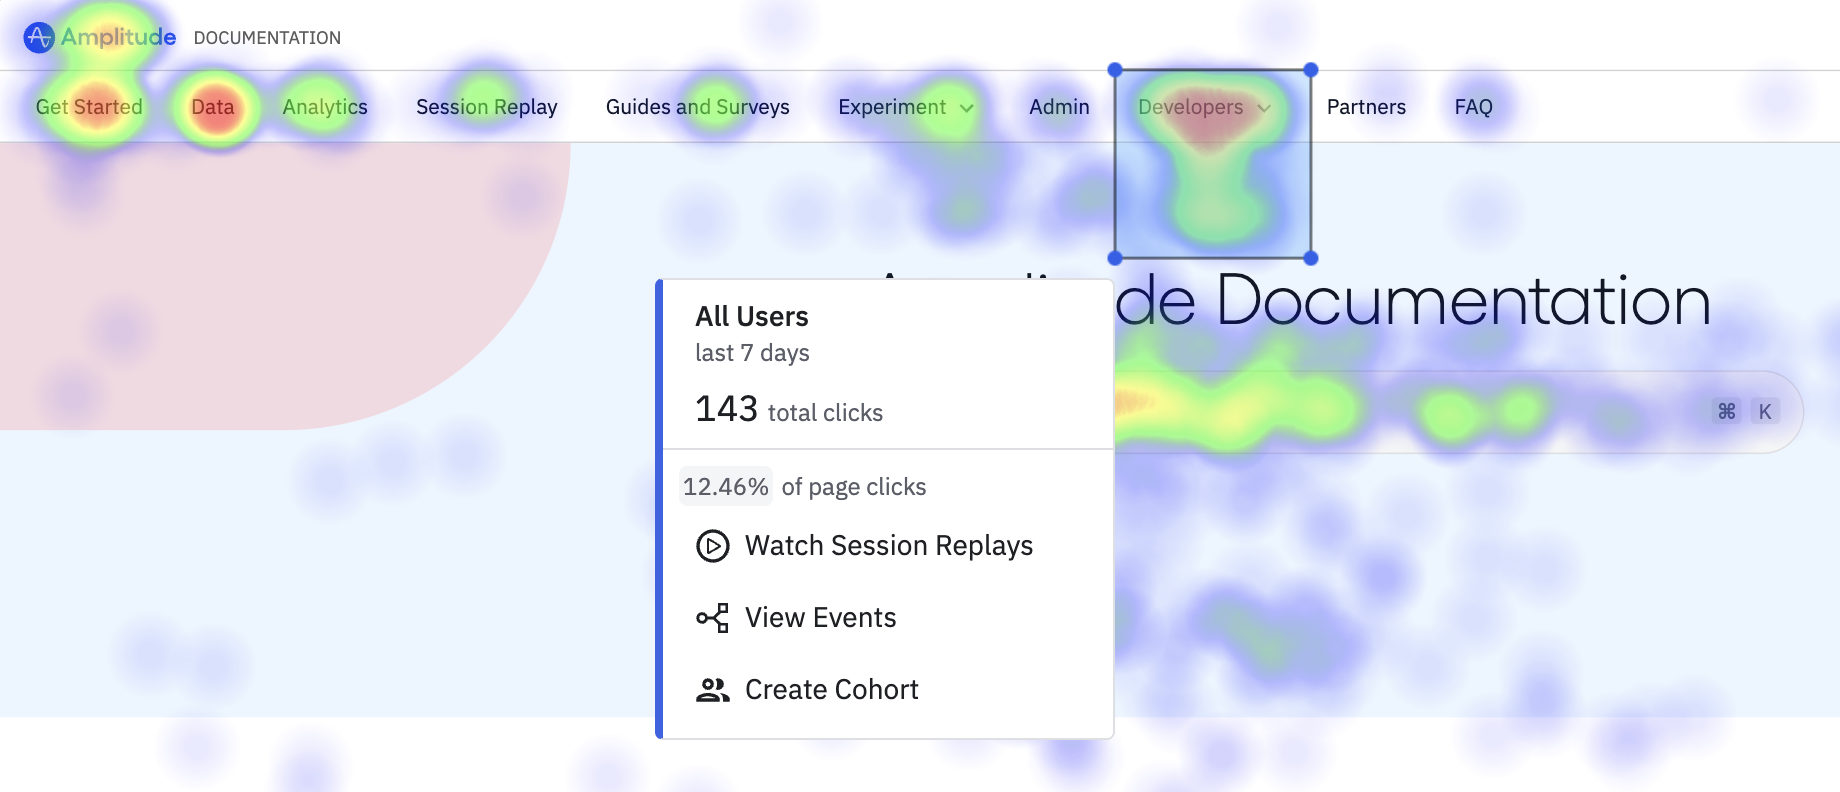
Click maps provide a color-coded display of the clicks, or "heat" on your page. Areas with few clicks appear blue, while busier areas appear green, yellow, orange, and red in order of increasing clicks.
Microscope
Highlight an area of the click map to access Microscope. From there, you can:
- View the events in the highlighted area for deeper visibilty into user actions or create a chart to further analyze trends and behaviors across your data.
- View replays of user sessions that contain the events in your selection to combine the quantitative insights from Heatmaps to the qualitative context from Session Replay.
- Create a cohort of users who interact with a specific area of a page. For more information, go to Behavioral Cohorts
Selector map

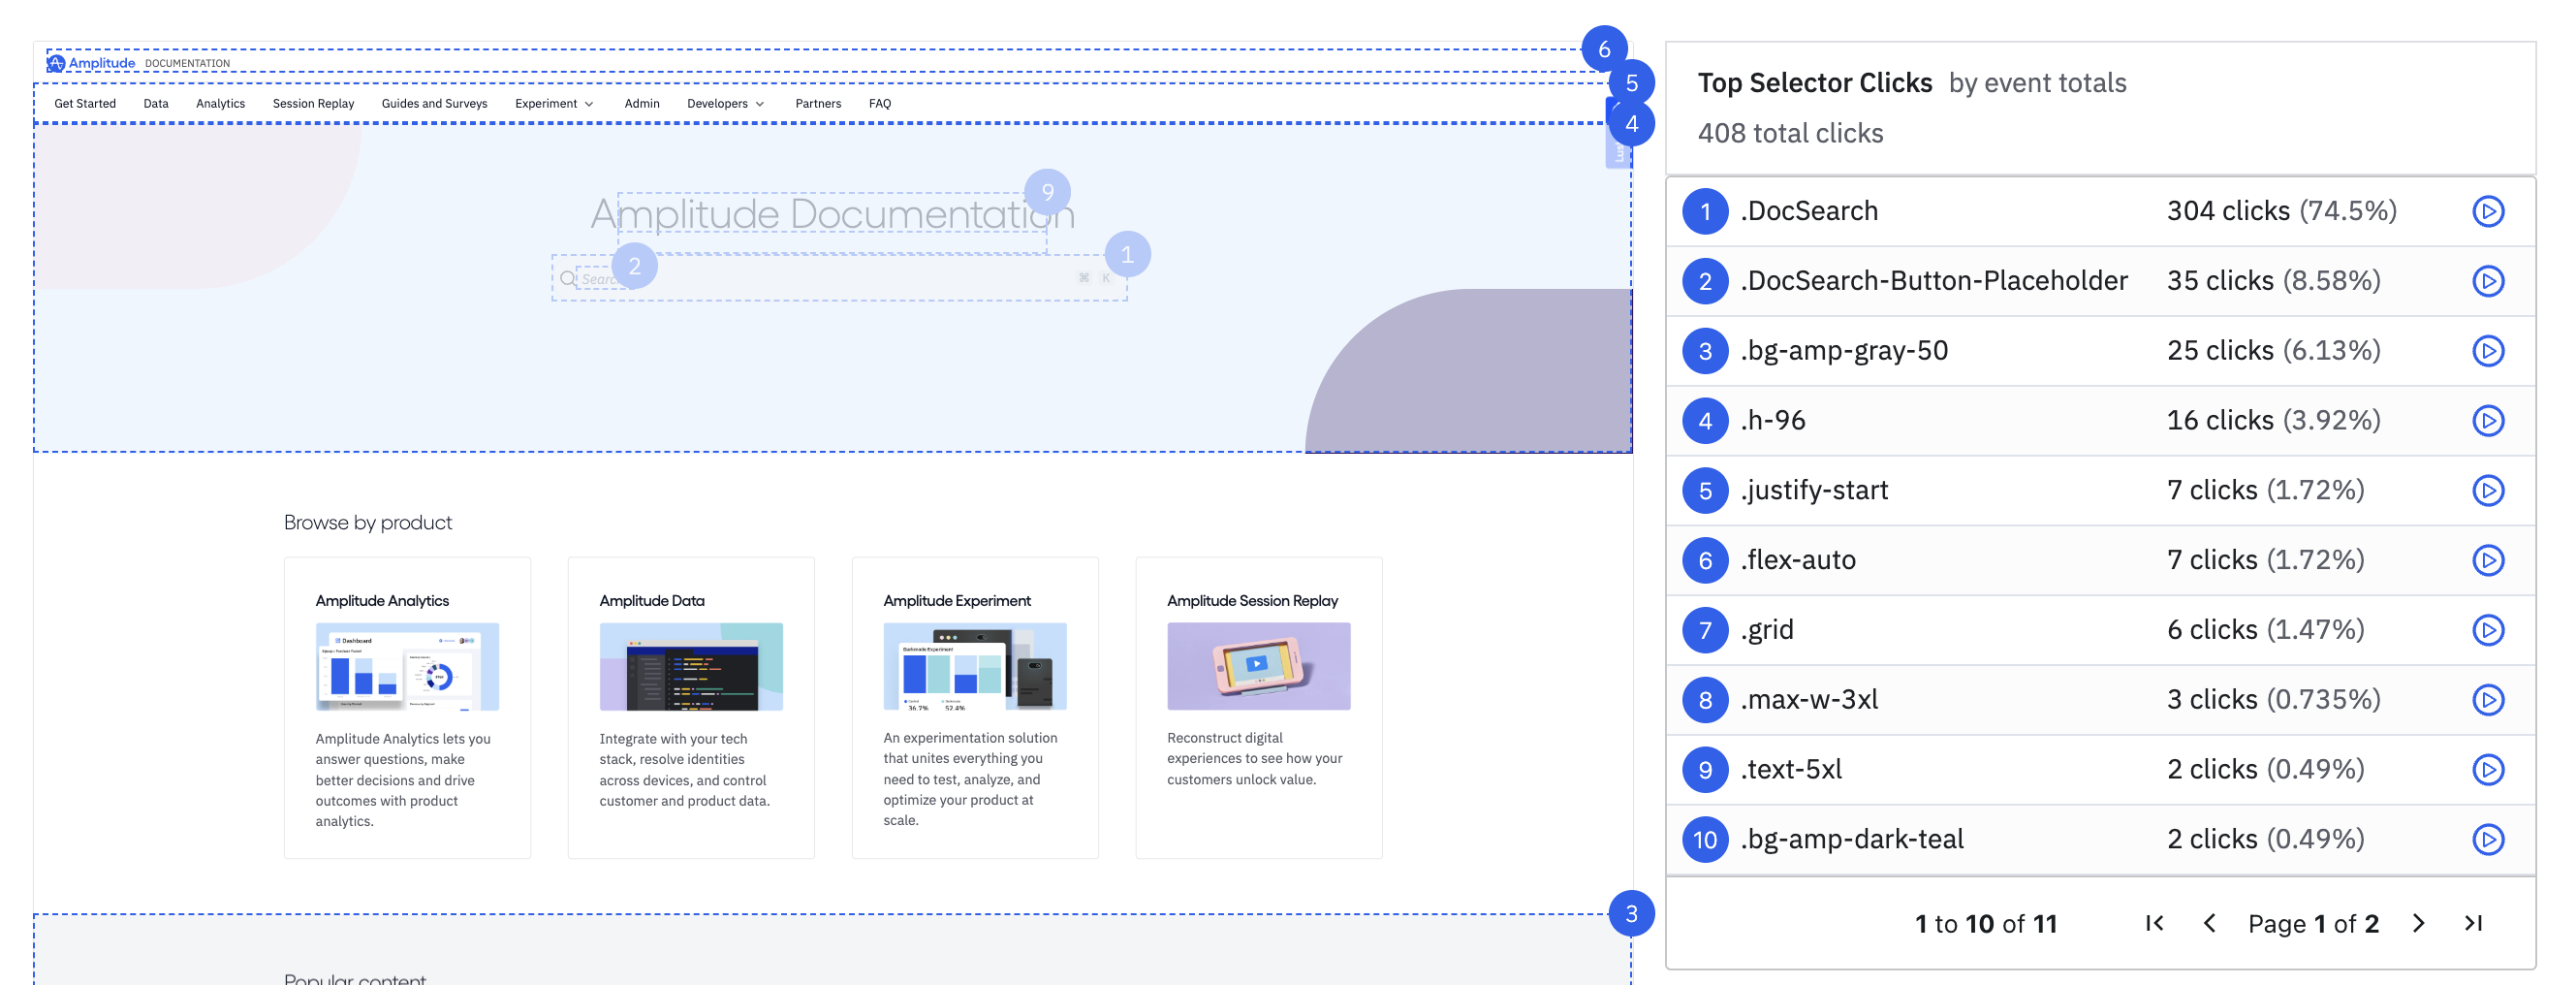
The Selector view displays a wire frame of clickable elements on the page, ranked by number of clicks in descending order. Select an element on the map, or in the list to watch Session Replays of those events, view the raw events, or create a cohort of users who engaged with selector.
Page length
Microscope
Select a ranked element on the page to access Microscope. From there you can:
- View the events associated with the element area for deeper visibilty into user actions or create a chart to further analyze trends and behaviors across your data.
- View replays of user sessions that contain an interaction with the selected element to combine the quantitative insights from Heatmaps to the qualitative context from Session Replay.
- Create a cohort of users who interact with a specific element. For more information, go to Behavioral Cohorts
Scroll map

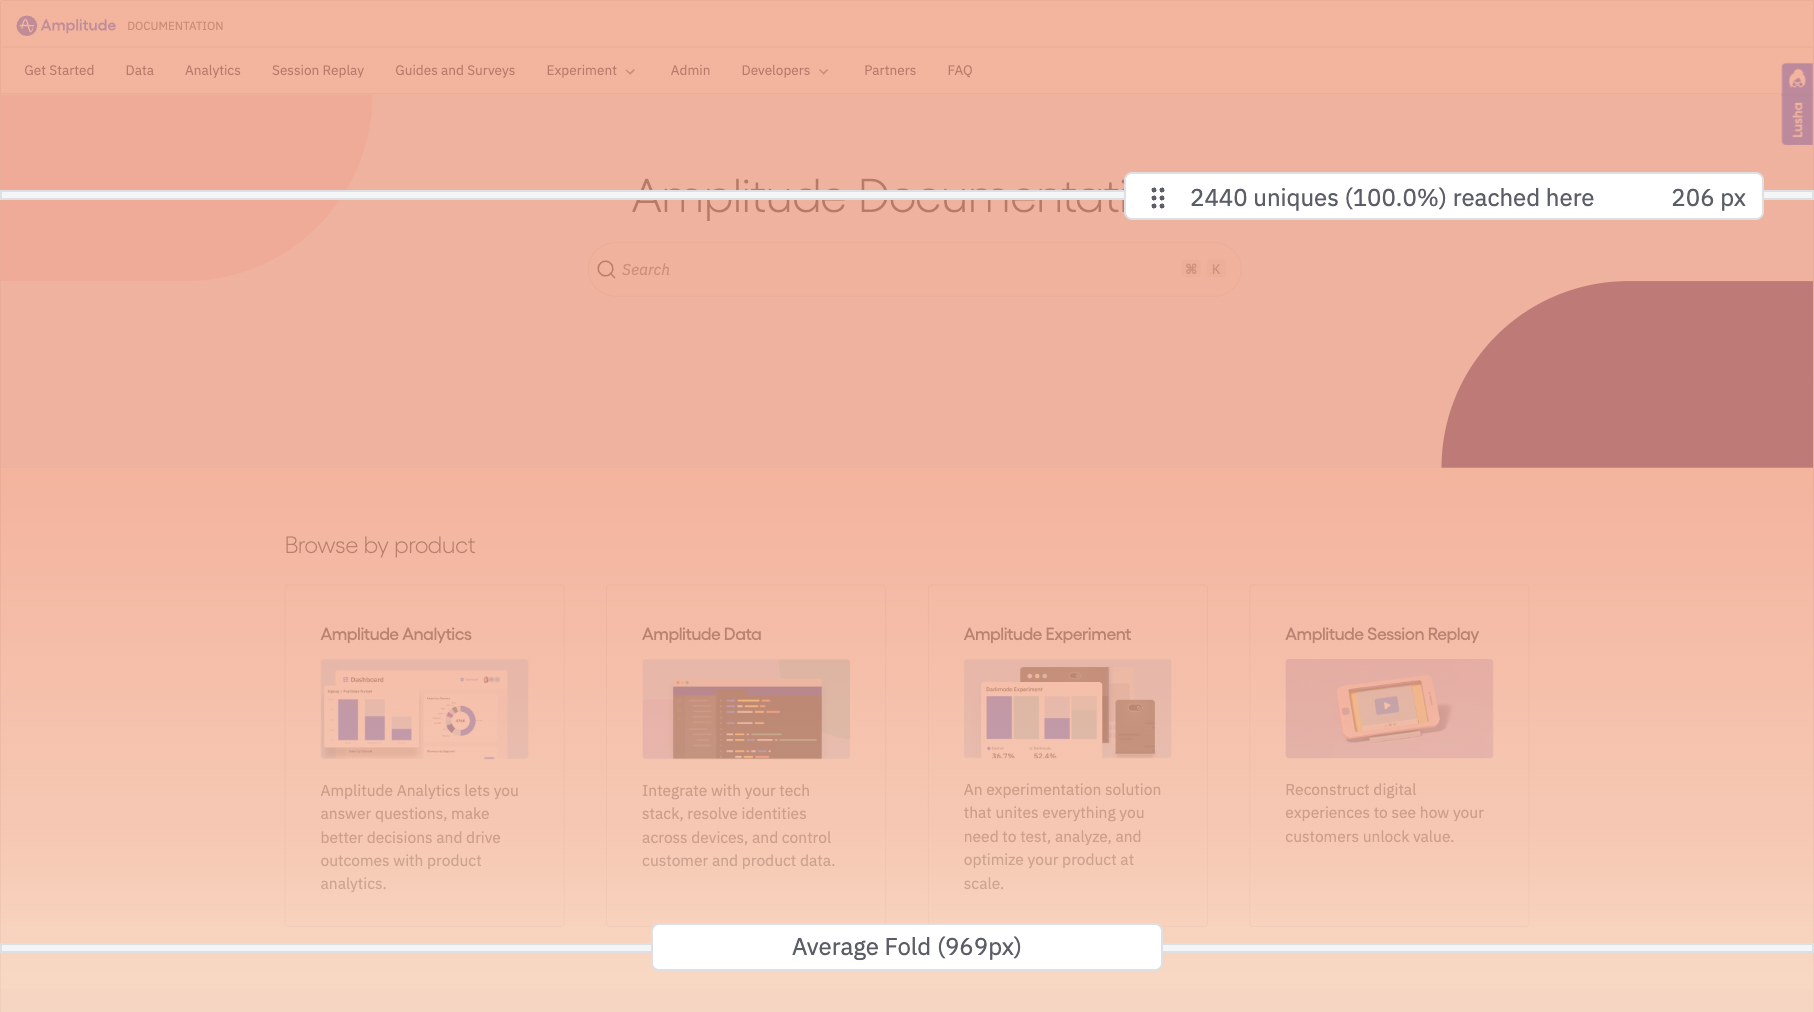
The Scrollmap shows the unique users, and percentage of unique users who have scrolled that part of the page into their view port. Use the handle on the slider to adjust the scroll depth.
This view also shows the average fold of your page. The amount of the page that appeared on a user's device without the need to scroll.
On the list to the right of the map, click Watch Replays to view Session Replays of users who saw at least that much of your page.
Microscope availability
Page length
October 16th, 2025
Need help? Contact Support
Visit Amplitude.com
Have a look at the Amplitude Blog
Learn more at Amplitude Academy
© 2026 Amplitude, Inc. All rights reserved. Amplitude is a registered trademark of Amplitude, Inc.