Import or export experiment chart settings as JSON
This article helps you:
Save experiment chart settings as JSON to your clipboard
Import chart settings as JSON to your experiment results in analytics
Creating charts with aligning settings can be difficult and time consuming when analyzing experiment results in both Amplitude Experiment and Analytics. To combat this issue, users can import or export chart settings' data as JSON.
Follow these steps to copy settings as JSON from Experiment to Analytics:
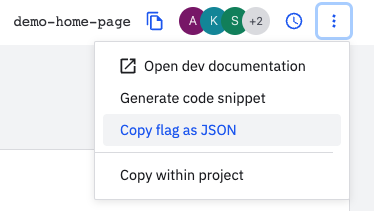
- While in any tab in Experiment, click the More dropdown and select Copy flag as JSON to copy chart settings to your clipboard.

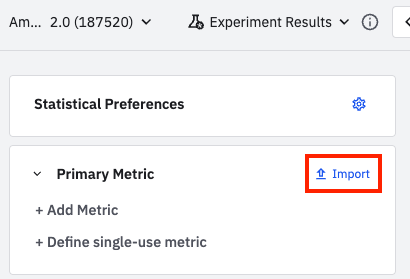
- From an Experiment Results chart in Analytics, click Import.

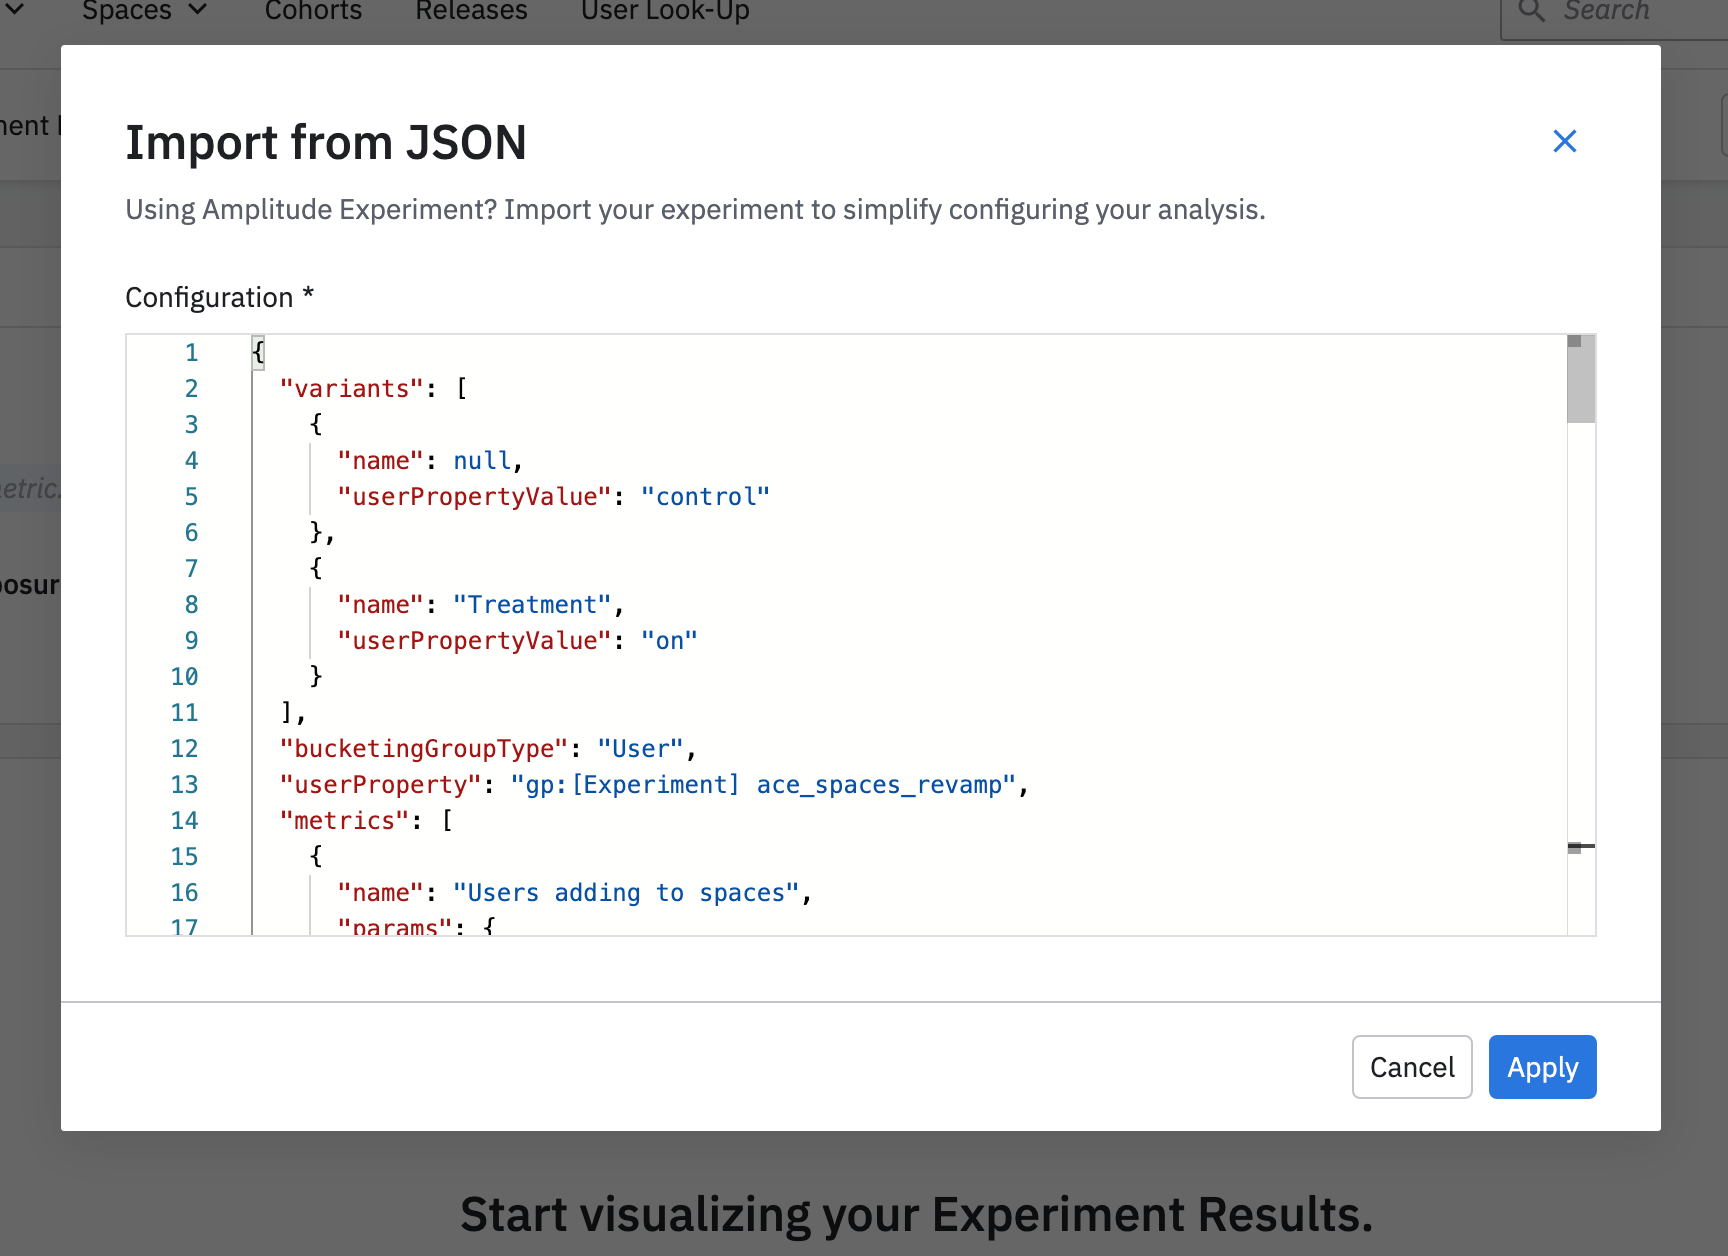
- Paste the copied settings in the Import from JSON window, then click Apply to exactly match your experiment's configuration.

JSON schema
The JSON copied to your clipboard contains a set of fields that completely describe the inputs to an Experiment Results chart. The fields differ slightly from what you might see in the version history for an experiment or feature flag.
-
variants - Array of objects with the following keys:
- name - The custom name set for the variant.
- userPropertyValue - The variant value, used to build segment conditions when converting variants to segments in the chart.
-
bucketingGroupType - The unit of analysis. See Experiment: Account Level Analysis for more information.
-
userProperty - The Amplitude user property that identifies users exposed to each treatment. Used to build segment conditions when converting variants to segments in the chart. See this article on event tracking in Amplitude for more information.
-
metrics - An array of metric objects, including test direction, MDE, events, and analysis type.
-
experimentStartDate - The start date of the experiment.
-
experimentEndDate - The end date for the date picker, or today if the experiment is still running.
-
exposureEvent - The exposure event and filters for the experiment. When your experiment is configured to use the default Amplitude exposure event, the event type will always be "[Experiment] Exposure". See this article on exposure tracking in Amplitude for more information about exposure events.
Thanks for your feedback!
April 25th, 2024
Need help? Contact Support
Visit Amplitude.com
Have a look at the Amplitude Blog
Learn more at Amplitude Academy
© 2024 Amplitude, Inc. All rights reserved. Amplitude is a registered trademark of Amplitude, Inc.