Advanced metric use cases
This article helps you:
Learn how to use your experiment's metrics in a funnel analysis
Analyze your experiment results based on a subset of users
This article reviews advanced use cases that you may face while analyzing your experiment's results.
Case 1: Create a funnel analysis based on your experiment's metrics
Imagine a conversion funnel with five steps, where step three represents the exposure event for your experiment. To reduce noise and increase the likelihood of reaching statistical significance, Amplitude Experiment only counts metric events after the exposure event. If the exposure event is step three of the funnel, and you include the whole funnel as a metric, the number of conversions for the funnel is zero. The best way to measure the actual conversion rate of your funnel is to make steps three through five a standalone metric in your experiment.
Sometimes, you may need further analysis of your experiment's conversion rates in a funnel analysis.
Follow these steps to use your experiment's metrics in a Funnel Analysis chart:
- Add the events for your funnel analysis in the Events module.
- In the Measured as module, choose the Conversion time window, then specify the counting method (unique users or totals).
- Select your analysis unit or group type (for example, Any Users) in the Segment By module.
- Create a user segment for each variant of your experiment.
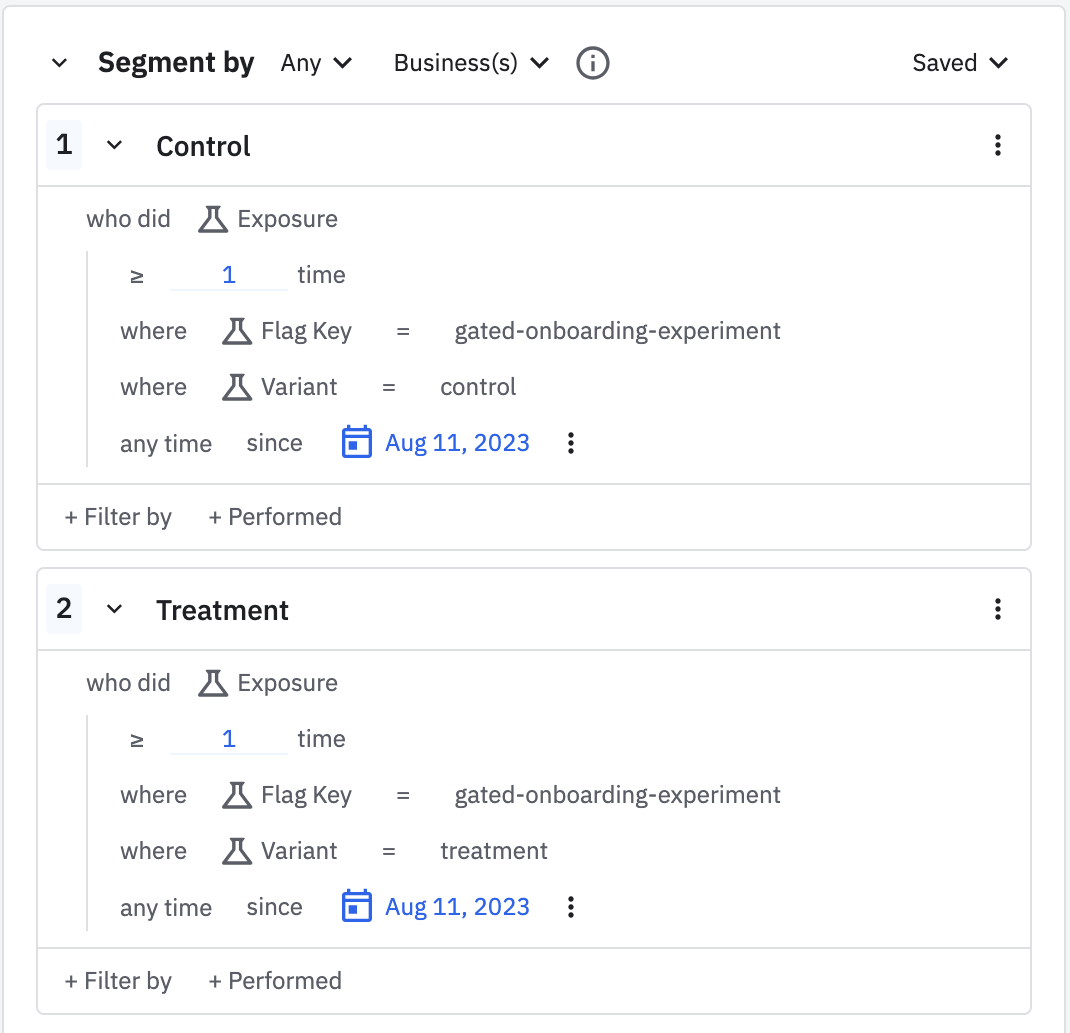
- Click + Performed to add filters with your experiment's flag key and variant.
- Set the date range for any time since to match the start date of your experiment.
The results of your Funnel Analysis chart may vary slightly from those of your experiment. This is because funnel analyses and experiments don't handle users who variant jump the same way.
For example, a funnel analysis includes all users who meet its filter requirements; then, based on those filtered users, it computes the conversion rate of the funnel. This means the funnel analysis may include a user even if they were exposed to your experiment's exposure event after they completed the funnel.
Analyze your experiment data using other Amplitude Analytics metrics
Amplitude Analytics offers metrics that Amplitude Experiment doesn't. You can also use the steps in the previous section to analyze things like time to convert or return on or after retention (though these measurements only consider a user's first conversion).
Read this Help Center article on funnel analysis' FAQs to learn more.
Case 2: Threshold Metrics
Sometimes you want to define a success as a user doing an event multiple times. In other words, if the user needs to buy something 3 times to count as a conversion. You can achieve this by creating a funnel counting by uniques with 3 purchase events.
May 21st, 2024
Need help? Contact Support
Visit Amplitude.com
Have a look at the Amplitude Blog
Learn more at Amplitude Academy
© 2025 Amplitude, Inc. All rights reserved. Amplitude is a registered trademark of Amplitude, Inc.