Create a chart
This article helps you:
Create a chart in Amplitude and understand the components that make it work
AMPLITUDE ACADEMY
Getting Started with Amplitude Analytics
Learn the most fundamental features of Amplitude Analytics, including cohorts.
Learn Amplitude AnalyticsCharts are the heart of almost any Amplitude analysis. To create a new chart, click Create > Chart, then select a new chart type from the Charts fly-out.
Restrictions
This feature is limited for users on Starter plans.
- Organizations on a Starter plan can save up to ten charts
- Organizations on a Starter plan can query up to one year’s worth of data
- Organizations on a Plus plan can query up to two years’ worth of data
For a high-level overview of each chart type, check out this overview of charts and features.
Find and add relevant events, properties, and user segments for your chart to generate useful information from it. Follow those links to learn more about those elements of an Amplitude analysis. You can also just start from a pre-built template instead.
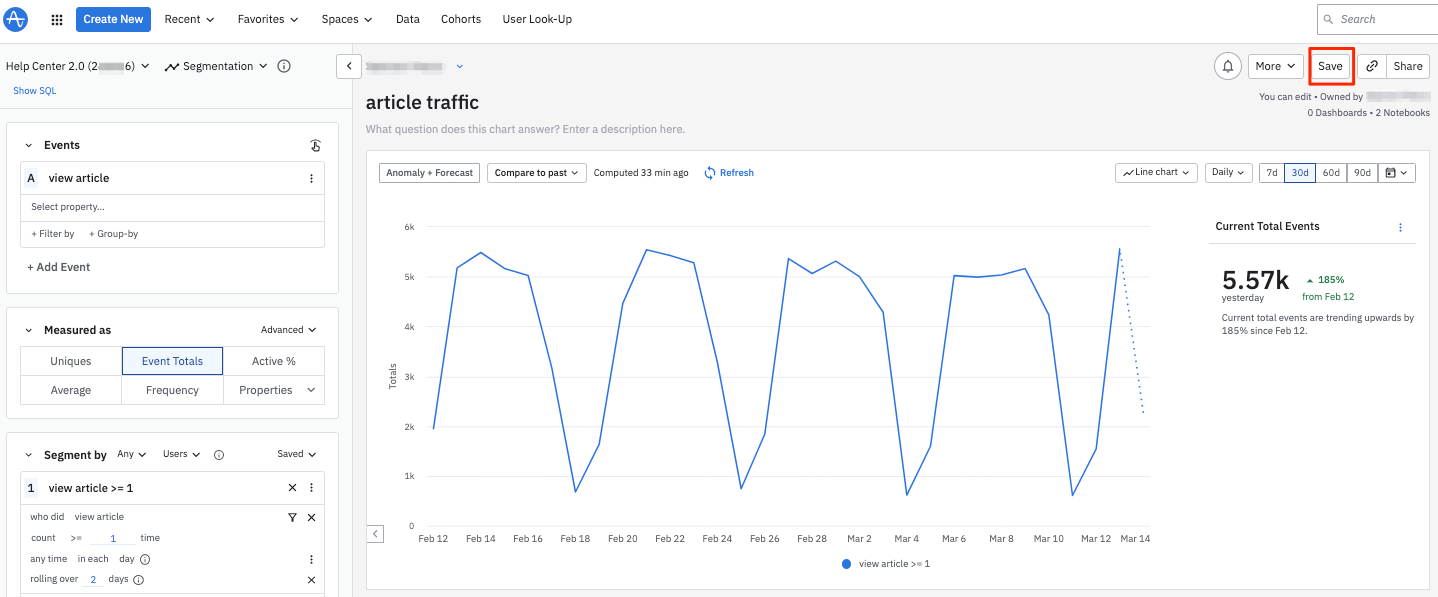
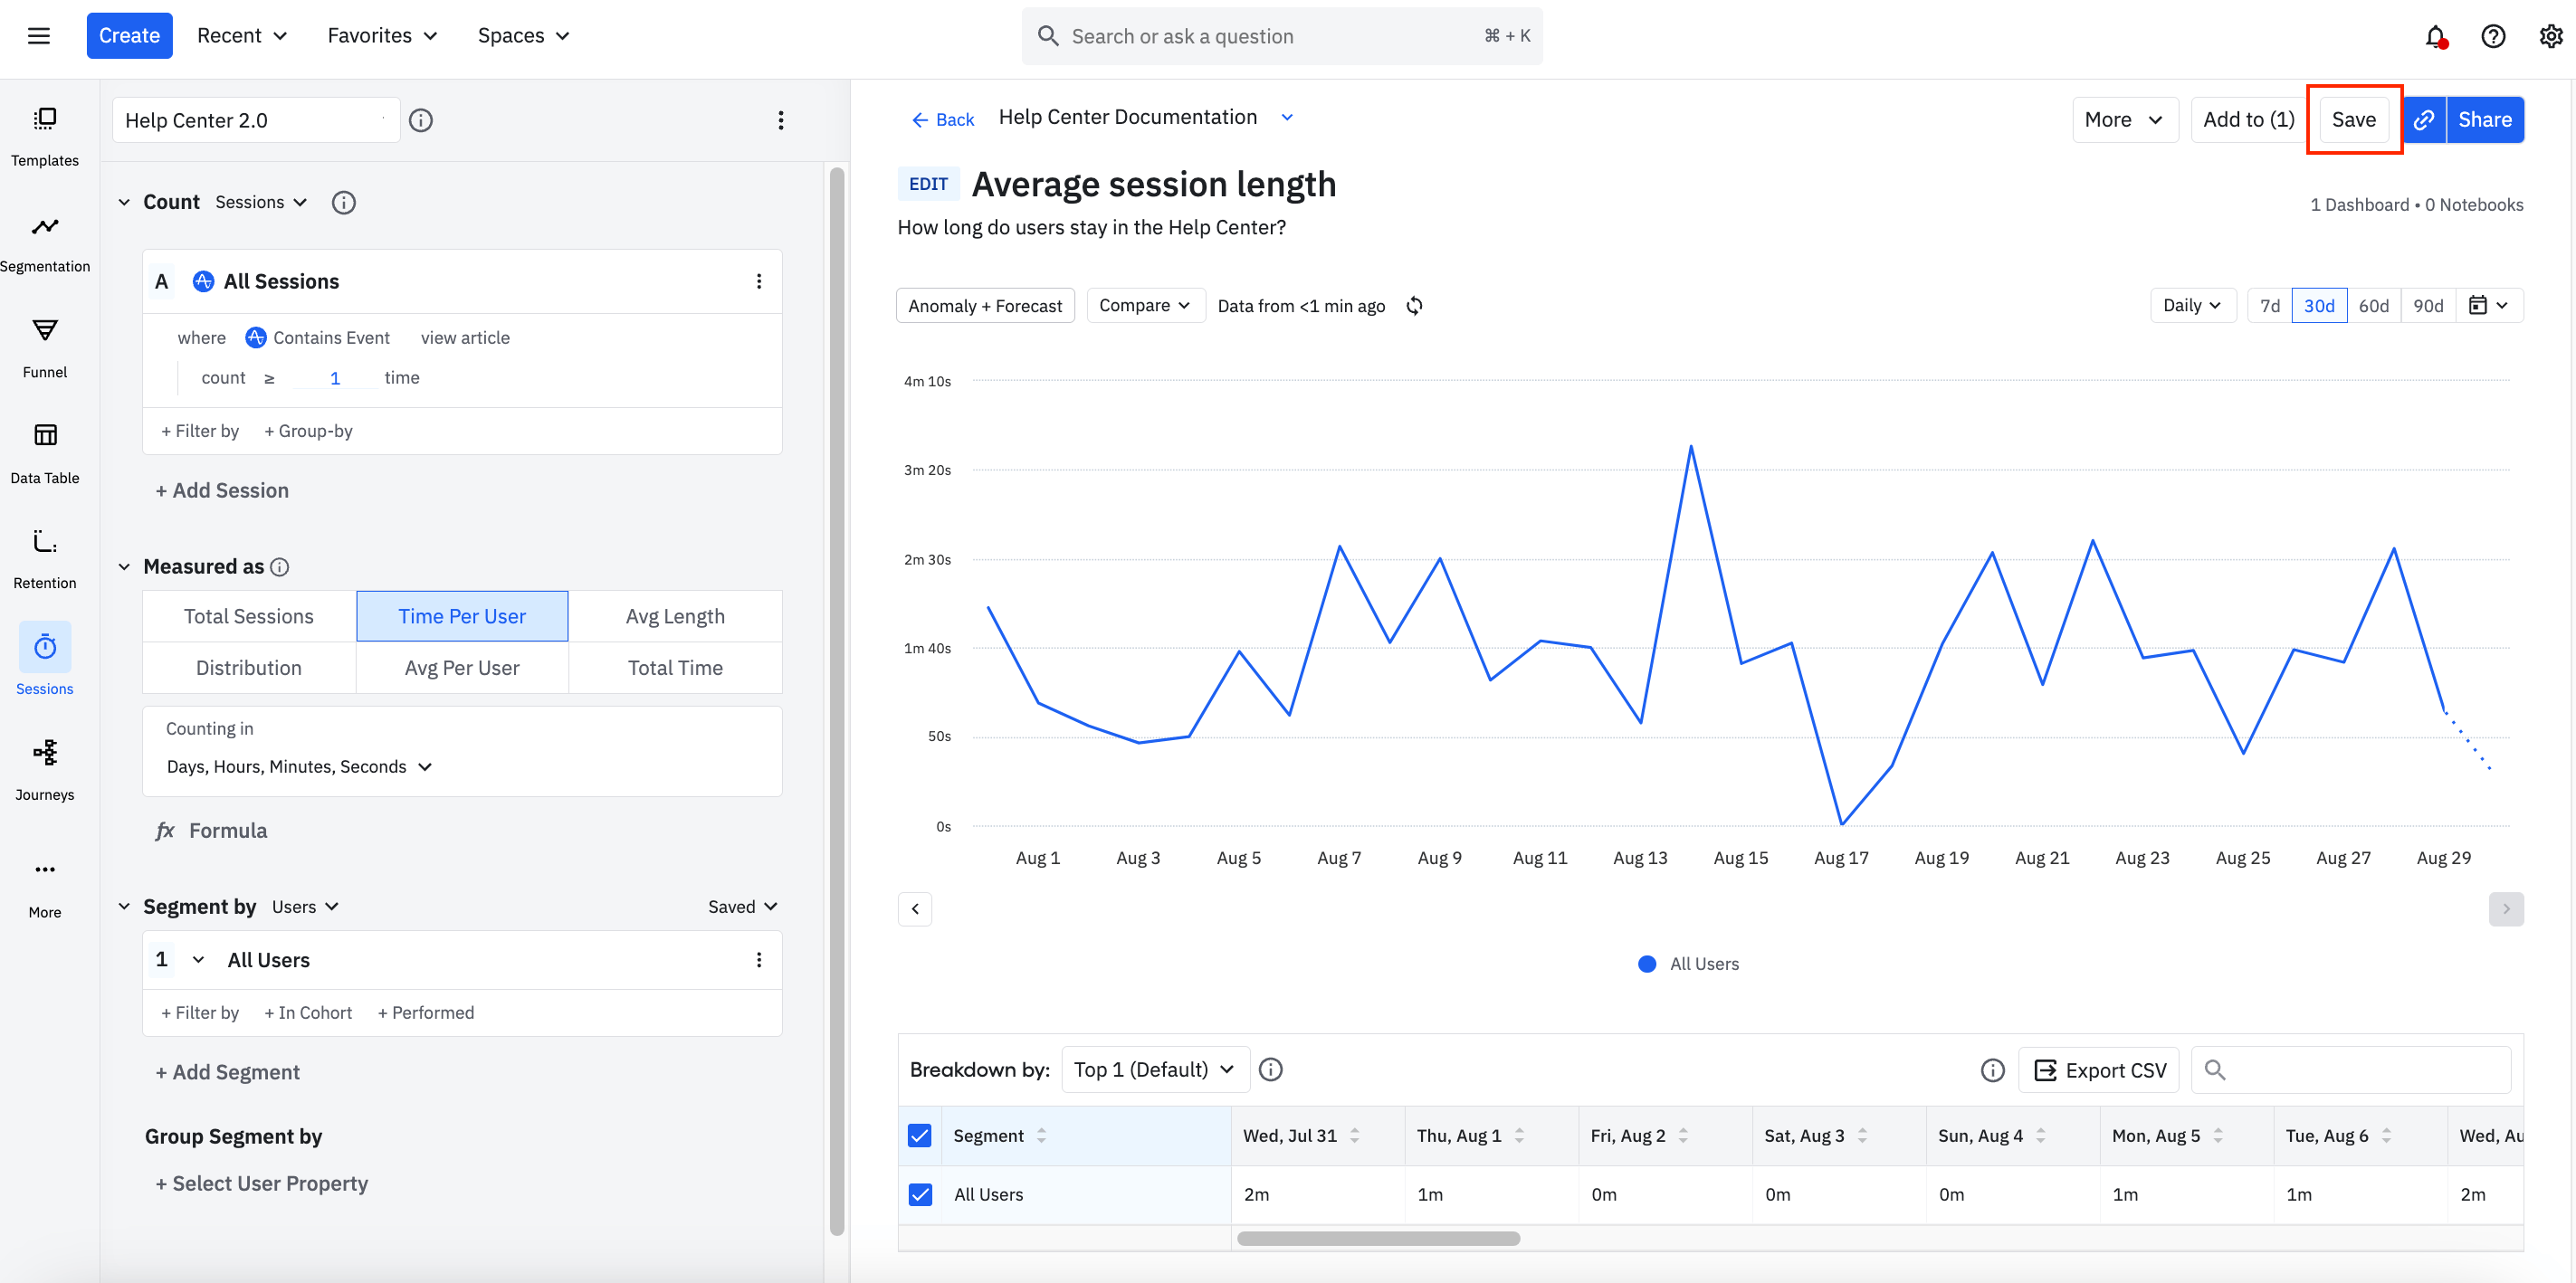
To save your chart, click Save.

If this is your first time saving your chart, fill in all the relevant information in the Save modal that appears. Give your chart a name and description, add it to a dashboard or notebook, and specify whether you want others in your organization to be able to find and view your dashboard.

Once you've saved your chart, the More drop-down menu offers several options for managing and working with your chart:
- Unlisted: This option enables other members of your organization to find your chart. Keep in mind that admins and managers can always find saved charts, whether they're listed or unlisted.
- Open Notebook View: This opens the notebook fly-out panel, where you can preview your chart in notebook format. You can also add your chart to a notebook from here, by selecting the notebook you want and clicking + Add chart to notebook.
- Export: This enables you to share your chart as a PNG, PDF, CSV, or shared link.
- Save As: This lets you save a new copy of your chart.
- Move: This lets you move your chart to a different space or folder.
- Copy: This opens a copy of your chart in a new browser tab.
- Comment: This enables you to leave a comment on your chart.
- Revert: This restores the most-recently saved version of this chart.
- Archive: You should archive a chart when it's no longer relevant to your analyses. Users can still search for archived charts in Search. Archiving a chart disables all shared links associated with that chart. However, when the chart is un-archived, the shared links reactivate.
Once you’ve populated a chart with data, you can zoom in on it by dragging diagonally across the chart and creating a rectangle over the section of the chart you'd like to view in more detail. Restore the full view by clicking Reset zoom.
October 16th, 2025
Need help? Contact Support
Visit Amplitude.com
Have a look at the Amplitude Blog
Learn more at Amplitude Academy
© 2026 Amplitude, Inc. All rights reserved. Amplitude is a registered trademark of Amplitude, Inc.