MCP Analytics
This feature is in Early Access. During this time, aspects of the functionality may still be developed, and this documentation may not always be up to date. If you have any questions, contact Amplitude Support.
MCP Analytics connects the activity on your Model Context Protocol (MCP) server to the product data you already collect in Amplitude. You instrument your server with the Amplitude MCP Analytics SDK. The resulting [MCP] events arrive in the same project as your web and mobile events, under the same user identity. Use MCP Analytics to find which AI clients your users come from, where tool calls fail, and what users are trying to accomplish. The same events show how use of your MCP server relates to acquisition, engagement, retention, and conversion.
A tool call that returns successfully only tells you that the server responded. It doesn't tell you what the user wanted, or whether the user got it.
Use MCP Analytics when you run your own MCP server and want to measure how people use it. To query your Amplitude data from an AI client, use Amplitude MCP instead. To measure the quality of an AI agent you build for your users, use Agent Analytics.
Availability
MCP Analytics isn't enabled for every account. To request access, apply to the Amplitude Early Access Program.
How MCP Analytics works
The Amplitude MCP Analytics SDK instruments your existing MCP server and tool handlers. It sends structured events to Amplitude for tool calls, errors, and other server activity. Event names and SDK-derived properties carry the [MCP] prefix, so they never collide with the rest of your product data. For every event the SDK sends and the properties it carries, refer to the MCP Analytics event reference.
When MCP events use the same user identity as your web and mobile events, you can analyze activity across those surfaces. For example, compare retention for users who use your MCP server against users who don't, or explore whether MCP users later complete a purchase or upgrade.
These comparisons show relationships between MCP activity and product outcomes. They don't establish that MCP activity caused an outcome.
Instrumenting a tool doesn't change what that tool returns. If the SDK or Amplitude itself fails, the SDK logs the problem and your tool still answers the agent as usual, so adding analytics can't take down a production server.
Requirements
To get started, you need:
- An MCP server running in production.
- An Amplitude project to receive the MCP events. To connect MCP activity with existing product behavior, send the events to the project that holds that product data. Configure a consistent user identity.
- An instrumented server, using the Python SDK, the Node.js SDK, or the event contract for another language, implemented with the porting guide.
Topic Intelligence also requires agent rationale, sent through the [MCP] Rationale property.
Permissions
MCP Analytics follows your existing Amplitude role permissions and data access controls. If you mark [MCP] Rationale as sensitive with Data Access Control, Topic Intelligence doesn't display that rationale.
How to set up MCP Analytics
Instrument your server
Use the SDK documentation for your language. For a server in another language, follow the porting guide to implement the same event contract:
Configure instrumentation for your Amplitude project, bind the SDK to your server, and wrap the tool handlers you want to analyze. Bind the server before you connect it, because that's when the transport becomes available. On an unbound server, a wrapped tool still runs but sends no events. For other languages, your team owns the instrumentation.
Connect user identities
Configure MCP events to use the same Amplitude user ID you already send for that person's product activity. A shared user ID connects their tool calls to their web and mobile behavior.
The SDK requires you to supply or resolve that identity. It doesn't infer your product user ID from authentication.
Configure data collection
Amplitude recommends configuring all four of these. Each one powers a specific part of MCP Analytics, and a server that skips them reports tool traffic without the context that explains it.
- Rationale: Send the agent's stated reason for calling a tool. Rationale is what Topic Intelligence groups into topics, so a server that doesn't send it gets no topic hierarchy at all.
- Parameter details: Shape capture records parameter names, types, and a structural fingerprint. Add selected route values or derived facts for each tool to fill in the parameter detail you read during a session drill-down.
- Feedback: Register the
submit_feedbacktool so agents can report whether a task helped, and why. This is the closest thing to a direct answer about whether the interaction worked. - Link attribution: Add UTM tags to the links your tools return, to attribute click-through traffic to MCP.
Refer to the SDK documentation for the configuration available in each language, and for which settings your SDK version turns on by default.
Verify your instrumentation
Make a test tool call and confirm that the expected [MCP] events arrive in Amplitude. Check that the tool name, outcome, client information, and user identity match your test.
If you configured rationale, parameters, or feedback, verify those fields separately before you use them in analysis.
How to explore MCP activity
In Amplitude, go to MCP Analytics. When your organization sends events from more than one MCP server, each server appears separately in the server selector. An internal server and a public one stay apart.
Start with the Overview tab
The Overview tab answers three questions in order: whether adoption is growing, what users ask your tools to do, and whether those tool calls succeed. The adoption tiles track new users, active users, sessions, and day 14 retention. The topic view sizes each task by session count and colors it by success rate. The completion bar splits tool calls into completed cleanly, completed after retries, failed, and abandoned.
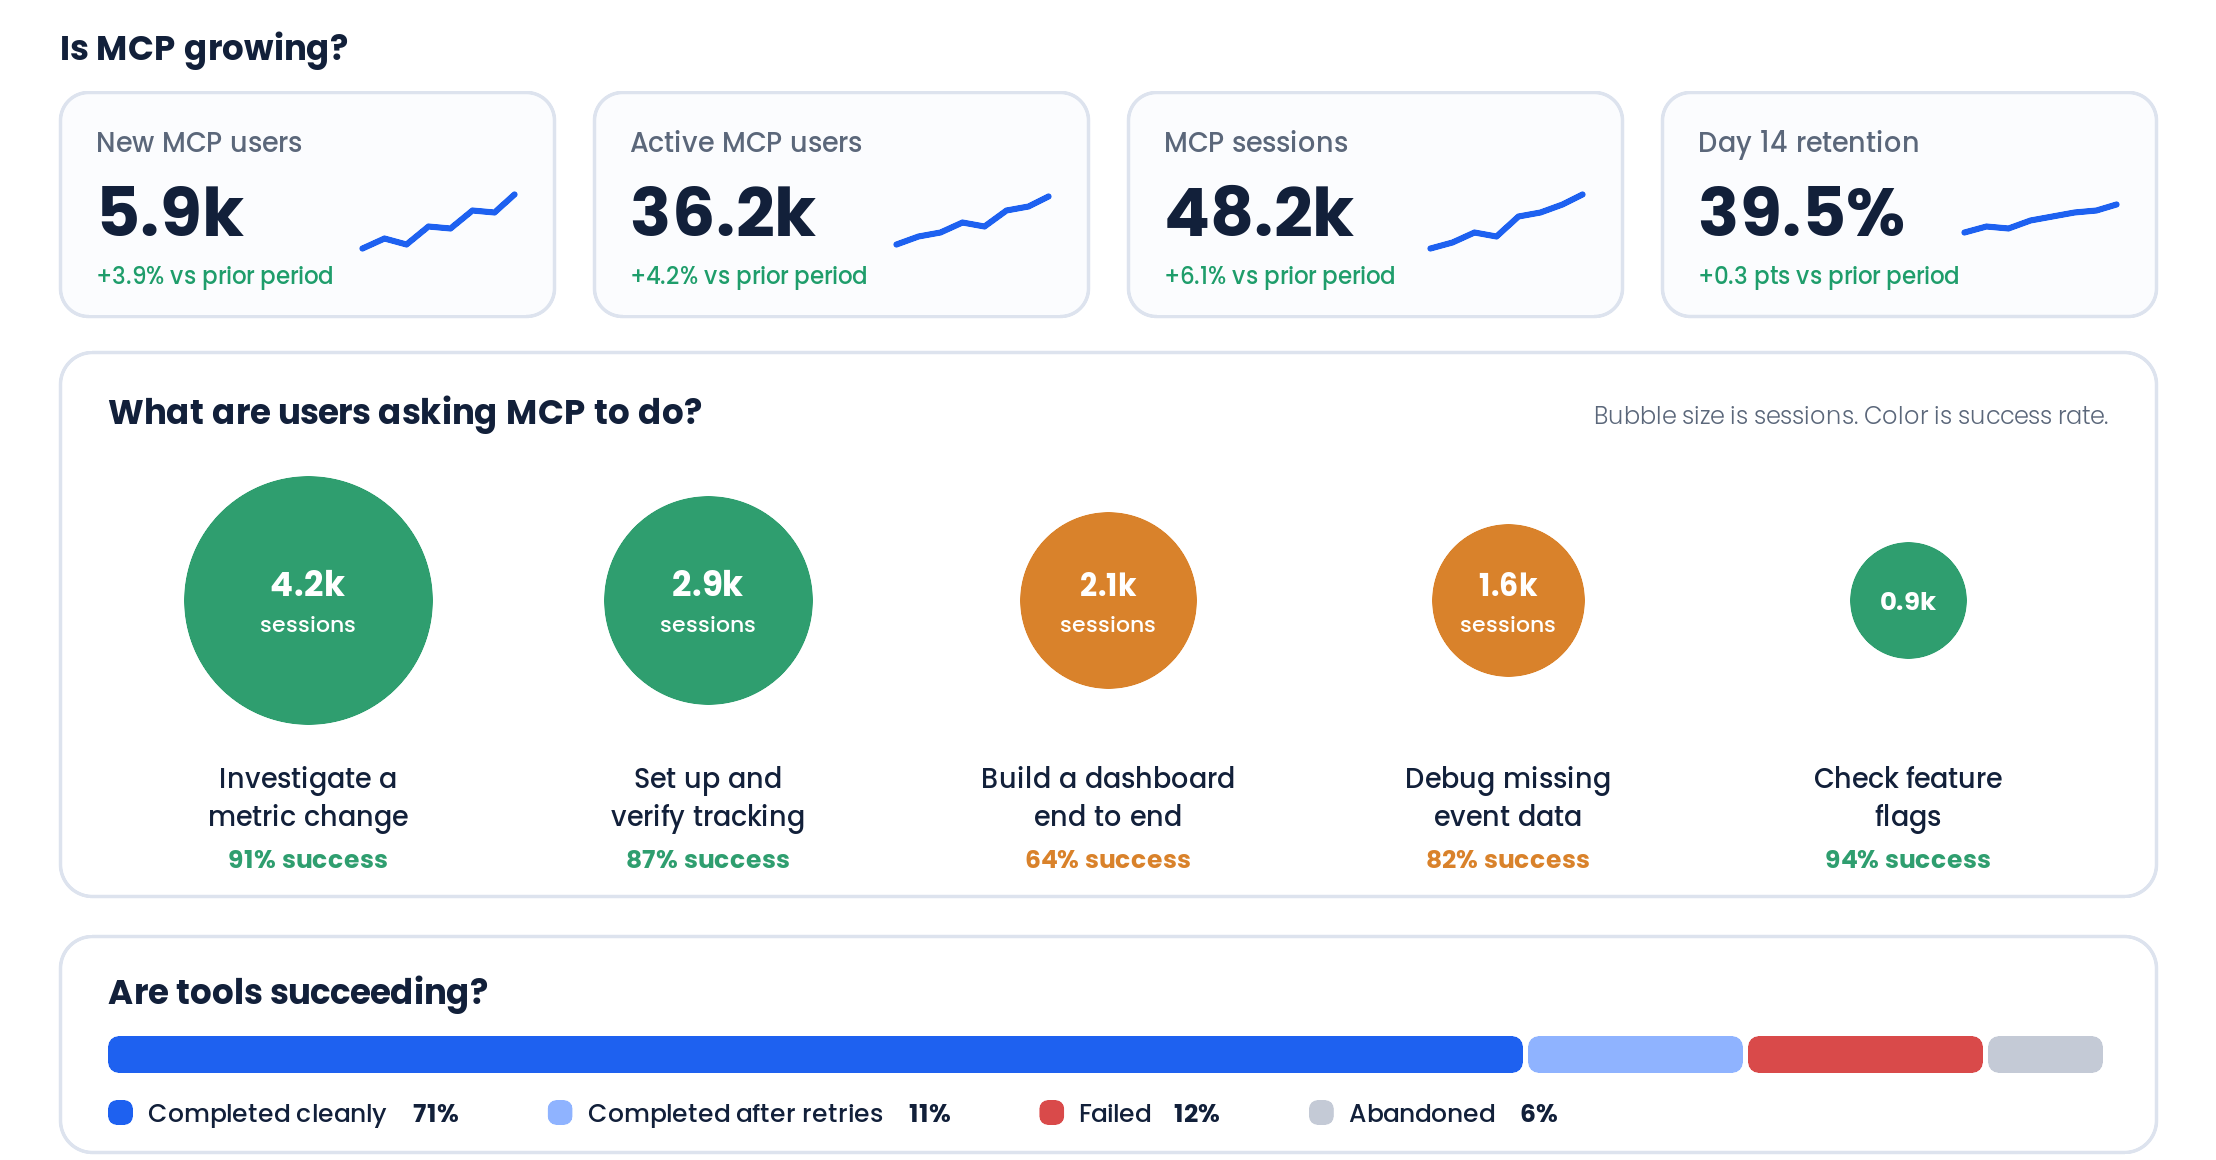
Choose a topic to investigate, then open its related sessions to understand the tool paths behind it.
Measure adoption and product outcomes
Use acquisition, weekly active user trends, and retention cohort comparisons to understand how people adopt your MCP server and return to it.
With connected product data, you can also explore questions such as:
- Do MCP users return more often than other users?
- Which product actions do people take after they use MCP?
- How does calling your MCP server relate to purchase or upgrade behavior?
The outcomes you can analyze depend on the product events you already collect.
Compare AI clients
Break down MCP activity by client, such as Claude, Cursor, and ChatGPT. Use the breakdown to understand which clients your traffic comes from.
Review tool flows
Tool flows show sequences of calls. Use them to investigate how agents work toward a goal, where they change direction, and when they repeat an operation. Retry-loop detection surfaces repeated attempts worth investigating.
Use tool success, error, and rejection rates as supporting context when you review a path.
Understand intent with Topic Intelligence
Topic Intelligence organizes agent rationale into a three-level hierarchy of topics. Each topic includes volume and error rate, so you can identify common tasks and the areas where agents encounter errors.
Topic Intelligence depends entirely on rationale. A server that doesn't send [MCP] Rationale produces no topics, so configure it under Configure data collection before you expect this view to fill in.
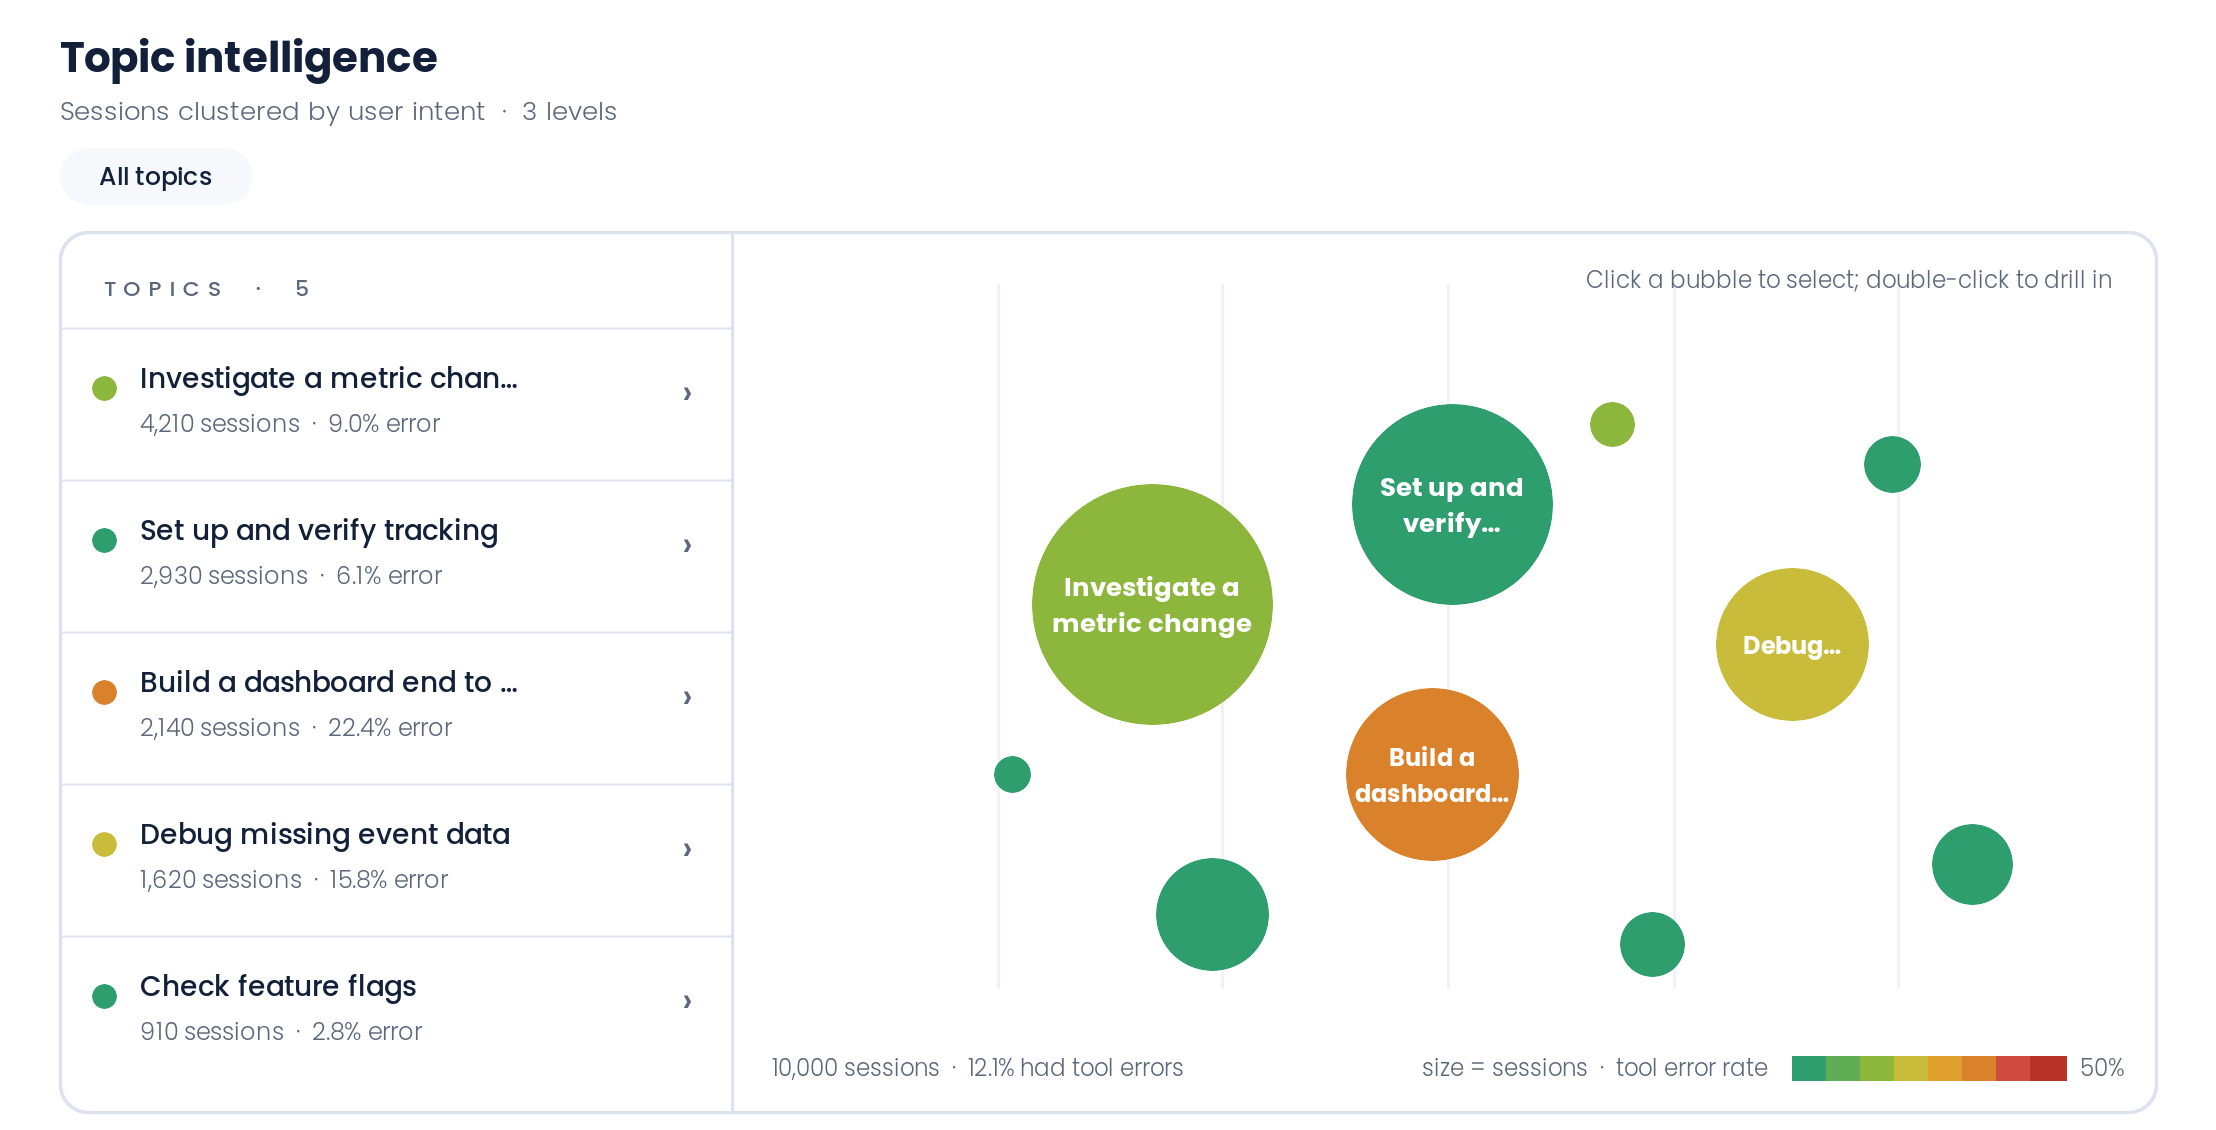
Open a topic to review the sessions behind it, including sessions that MCP Analytics constructs for stateless servers. Within those sessions, examine the tool flow and the parameter details to understand the steps the agent took and what might explain its behavior. How much parameter detail appears depends on what you opted into for each tool.
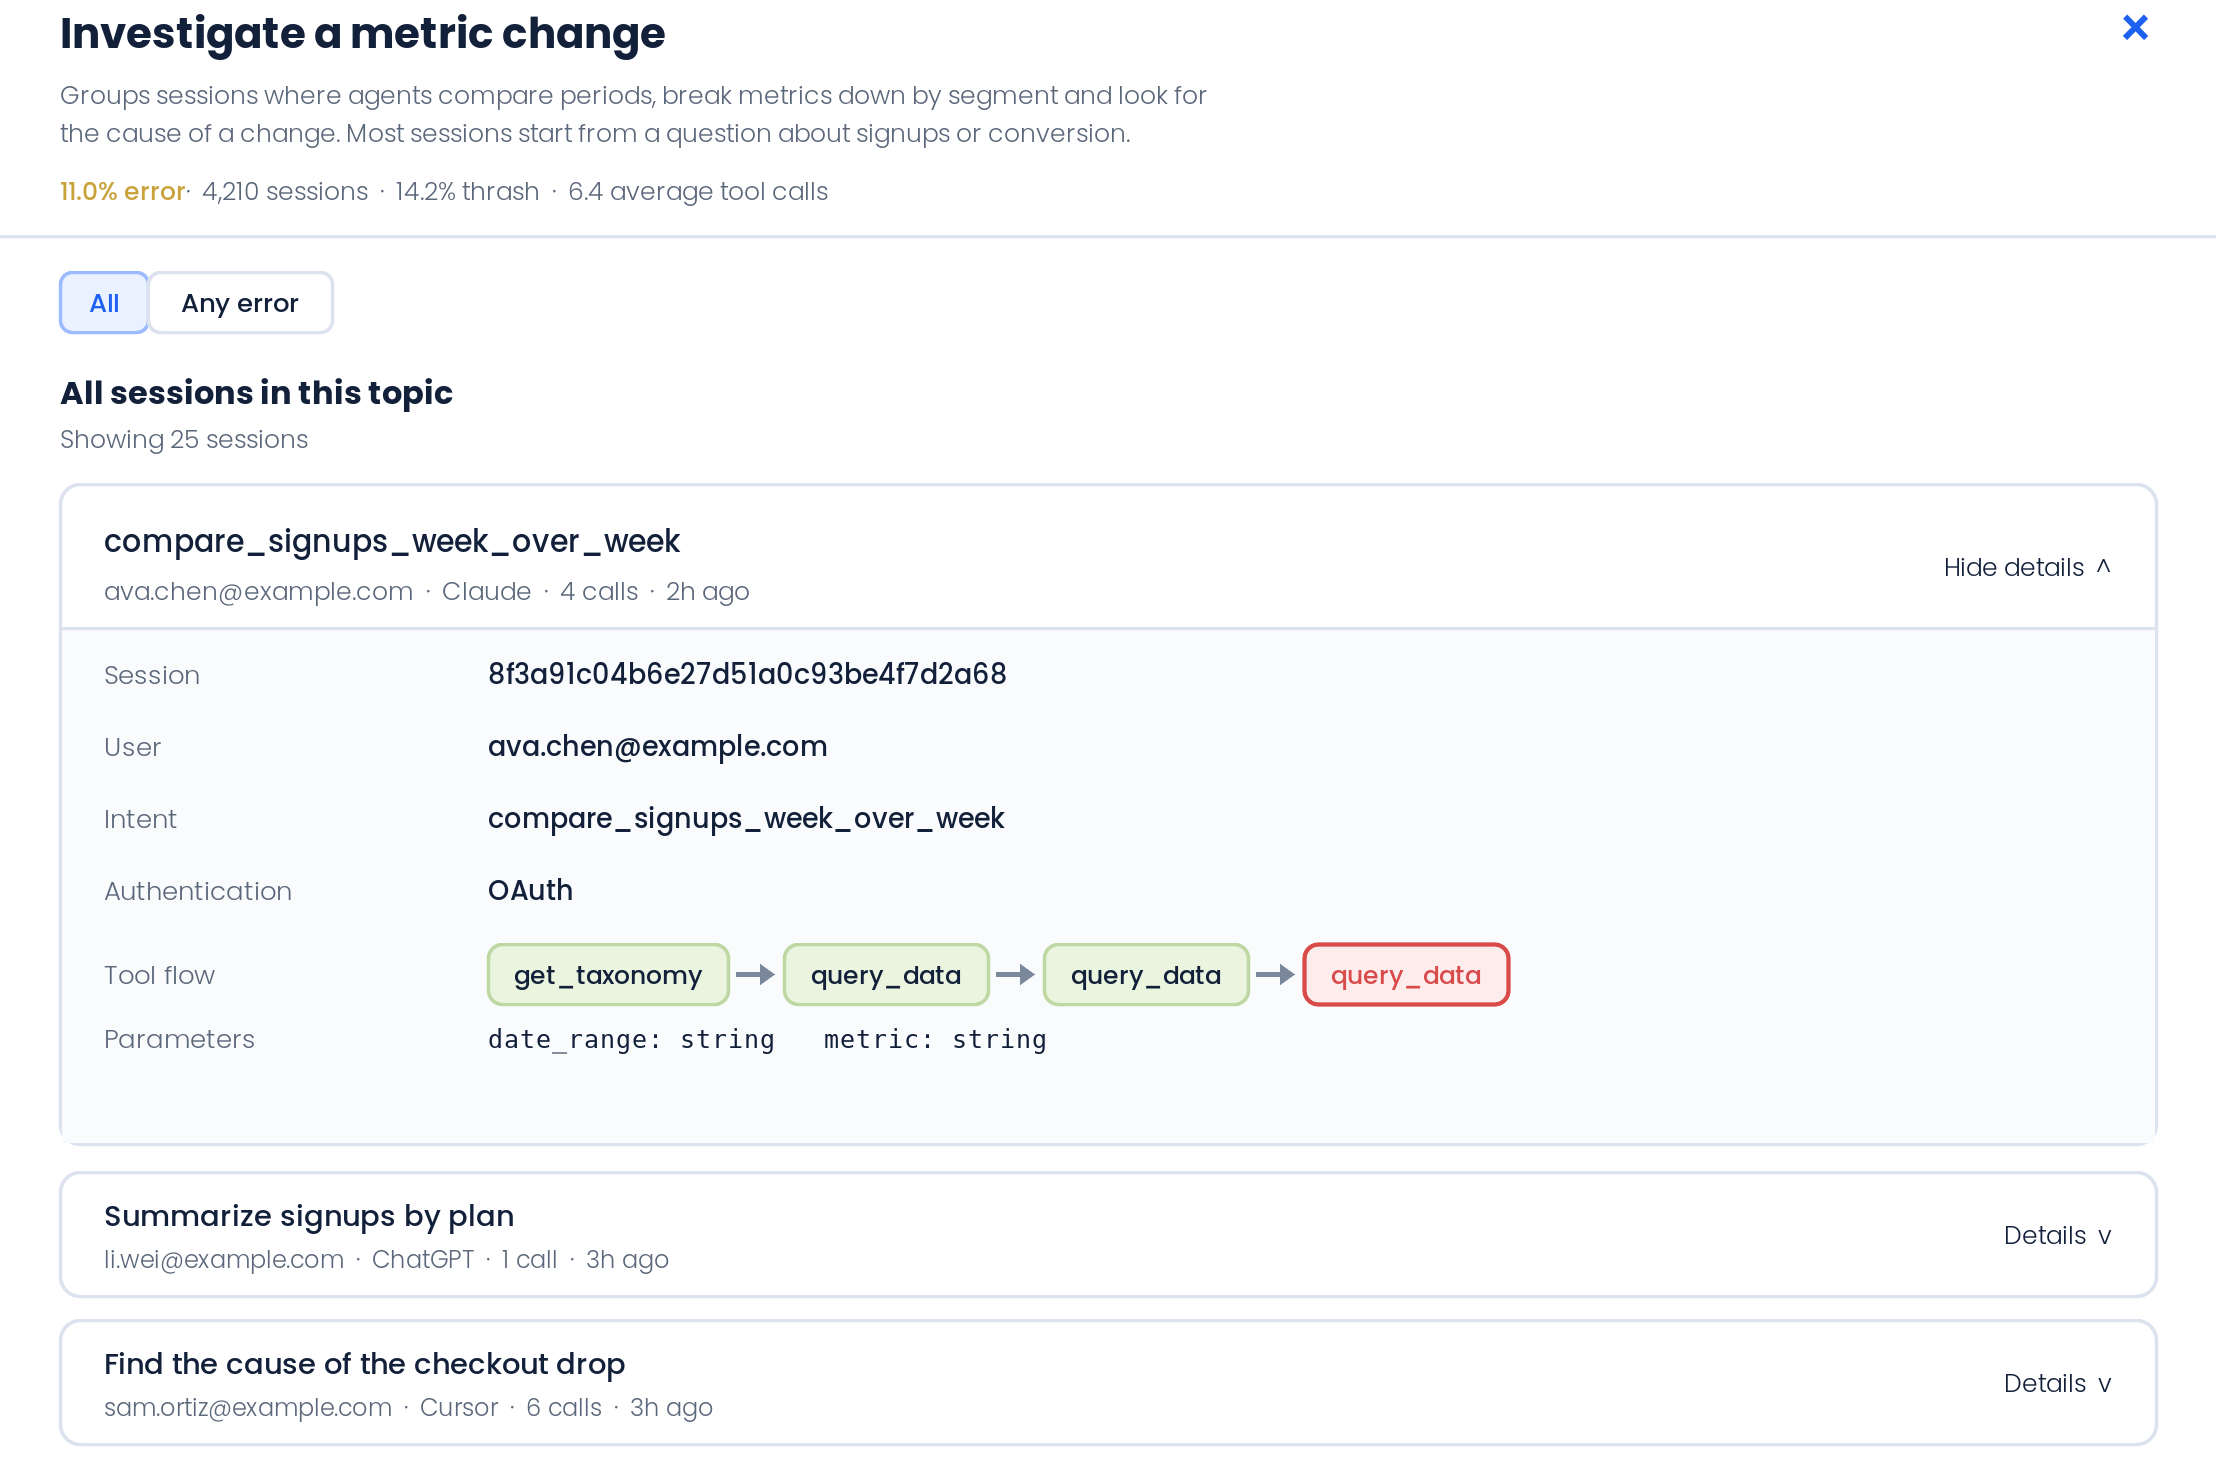
Rationale is the agent's stated explanation for a tool call. It gives context about intent, but on its own it doesn't confirm that the user's task succeeded.
Continue the analysis with Amplitude MCP
Connect the Amplitude MCP server to a supported AI client to explore your MCP events alongside your product data in natural language. For example, investigate which tool sequences precede a key product action, or compare how often different groups of MCP users return.
The two serve different purposes: Amplitude MCP queries data that's already in Amplitude, and the MCP Analytics SDK instruments your own server and sends its activity to Amplitude.
To read the same data programmatically, use the MCP Analytics endpoints in the Developer API.
Data collection and privacy
MCP Analytics can collect session activity, tool-call outcomes, AI client information, errors, rationale, parameter metadata, and optional feedback.
Parameter capture records metadata such as parameter names, types, and a stable fingerprint of their structure. Parameter capture doesn't collect parameter values by default. You can opt in to selected route values or derived facts for each tool.
Rationale collection requires explicit instrumentation. Review any free text and optional content you choose to send. Apply your organization's data policies before you turn collection on.
Share feedback
Amplitude's product team reads all feedback to shape MCP Analytics. To report an issue, email earlyaccess@amplitude.com. Include the affected tool, the AI client, the approximate time, and the behavior you expected. The team needs those details to investigate.
Was this helpful?
For AI agents: a documentation index is available at /docs/llms.txt. Append .md to any page URL for markdown, or send Accept: text/markdown.