Understanding product analytics
Amplitude Guide to Product Analytics
Everything you need to know about product analytics, from the #1 product analytics solution
What Is Product Analytics?
Product Analytics Definition
Product analytics is the process used to understand how customers engage with digital products. It is a framework for putting customers at the core of a business by analyzing behavioral data, identifying opportunities for conversion, and creating impactful digital experiences that bring about high customer lifetime value.
Product analytics lets your team track, visualize, and analyze real-time engagement and behavioral data so you can optimize your complete customer journey. You can go beyond vanity metrics and tie every step of the customer lifecycle to a concrete data point—empowering your team to improve the digital experience, win customer loyalty, and tie digital bets to business impact.
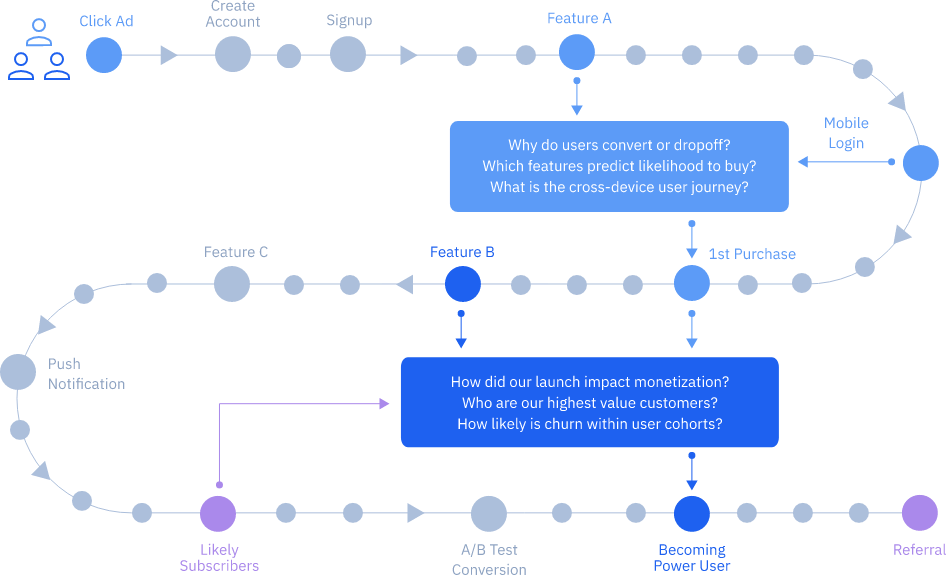
Learn more about mapping the digital customer journey with the Amplitude Behavioral Graph.
Why Is Product Analytics Important?
Business leaders must adopt a digital-first approach to maintain a competitive advantage and attract and retain customers. This mindset is a shift from simply getting customers in the door and instead focuses on creating a digital experience that will bring value to the customer.
Product analytics helps you create that digital experience without any guesswork. It provides you with concrete information to optimize conversions, grow retention, and maximize revenue.
According to G2, "Product analytics software provides companies with visibility into their users’ interactions with their product, including visits, events, and interaction." It gives you access to not only customer data but also dashboards and reports for analyzing this information.
Lean into the Digital-first Era
To win against the competition, businesses of all kinds—and across every industry—must embrace the digital-first mindset. The COVID-19 pandemic accelerated a transition already underway: customers looking to the digital experience as their primary point of contact with a business. Now, customers have elevated expectations for product experience. They expect companies to deliver high-value features at a rapid pace, and if the digital product or service fails to meet their needs, they will look elsewhere.
Product analytics is the epicenter of how digital-first companies figure out customer needs and measure the impact of their products. It provides companies with real-time insights into how users are interacting with their product, so they’re able to respond to any upsets with agility.
Say a user who just signed up for your product doesn’t complete the expected next step. Companies can use product analytics software to dig into why this is happening and how they can redirect users to take valuable actions.
Set Business and Product Strategy
Too often, companies develop feature after feature without thinking about how those features meet overall business objectives. To realign, they need to focus on their North Star metric—the key measure of success for product teams. It sits at the intersection of customer value and business value and reflects the customer problem your product is trying to solve.
Product analytics is invaluable when setting a strategy for meeting this North Star metric. Data-informed product strategy is guided by the principle that the more you understand your customers, the better you can serve them.
Surface Immediate, Self-serve Insights About Customer Behavior
Businesses often have a multitude of questions about their customers and how their product is performing, such as:
- Who are my most valuable customers?
- What actions do those valuable customers take?
- Who are the customers who churn?
- What actions do churned users take?
- What are the characteristics of highly engaged users?
- What are my users’ pain points?
This data can be overwhelming for teams, especially if analytics skills vary widely among the group. You don’t want to be in a situation where insights are locked behind another team or a ticket request. This delay in getting responses to product questions leads to over-reliance on gut instinct or an inability to react quickly.
A self-serve analytics approach makes customer behavioral data and analysis widely accessible. With a platform like Amplitude, teams don’t need to have SQL skills to explore data and form insights. They’re equipped for success by having immediate, direct access to the data and a navigable platform to analyze it with—in just a few clicks.
Who Uses Product Analytics?
Every company can and should lean into the digital-first era. As a part of this shift, team members of all types will benefit from understanding customers through product data. A wide variety of industries, roles, and teams are using product analytics to form these customer insights and share them across the organization.
Industries That Use Product Analytics
All industries with a digital platform can leverage product analytics to generate insights into the customer experience. Industries including B2B, consumer tech, e-commerce, fintech, media, and more have put product analytics to work to grow their companies. A few ways they’re using product analytics include:
- Identifying which customers are most engaged and using this information to improve retention
- Conducting A/B testing of new features to make rapid product decisions
- Discovering the retention hook that keeps users coming back to an app
- Tracking users across the web and mobile to get a complete picture from landing page to checkout
- Targeting users based on their behavior to offer relevant products or services
- Pinpointing viewership or readership to drive content decisions
- Combining customer insights with data about loyalty programs to create personalized offers
The possibilities are as varied as all of the industries using product analytics.
Roles That Use Product Analytics
Data insights do not belong to one team. From C-suite to product managers to marketers, everyone can use real-time customer insights. Some common roles that use product analytics include:
- Product Managers
- Marketers
- Engineers
- Analysts
- UX/UI Designers and Researchers
- Data Scientists
- CEOs and Executive Leadership
- Operations Leaders
- Customer Success Managers
- Sales Leaders
All team members must work together to surface and share findings that impact the customer journey. Whether you’re trying to understand current customer behavior or make a prediction about what comes next, the answer lies within your product analytics.
Most importantly is the role that your customers play. As the source of your data, they are also the ones who benefit from what you learn. Your product analytics can provide you with the exact data needed to drive your decision-making and continue to make improvements that delight your customers.
Product Types That Use Product Analytics
Product analytics benefits many product types, including web apps, mobile apps, websites, and IoT (the Internet of Things) or smart hardware. Oftentimes, companies use product analytics to analyze the performance of multiple digital products or channels. After all, the customer journey doesn’t start and end on a single device. Customers may start on the web and switch to mobile, and you should understand differences in how they interact with your business in each digital environment.
Key Metrics You Can Measure With Product Analytics
Measuring anything and everything leads to data that is unmanageable. It shifts the burden to your team to try and make sense of the results. Instead, you should define and measure the metrics that have the most business impact. Rather than spending time compiling the data needed for your key metrics, product analytics can make this review process simple. This allows you to focus on the numbers rather than the data-collection process.
Engagement
In the past, companies used the Net Promoter Score (NPS) to gauge whether customers were engaged and happy with their product. But NPS and other surveys don’t provide a complete picture of their experience with your product. Nowadays, only 16 percent of executives considered NPS an important measure of digital success.
Furthermore, companies have traditionally relied on pageviews and clicks to track the success of digital interactions. But these vanity metrics only skim the surface of insight. To truly understand engagement, you need a full view of the customer journey. Instead of just measuring pageviews, for example, you need to see how customers went from pageview to signup to performing a critical action to becoming a returning user over time. .
Product analytics shows you every way your customers use your product—as well as which interactions bring about the most value—so you can accurately assess engagement. You can identify which features customers leverage most, how often they return to your app, and what actions they’re taking. With these insights, product analytics can help you increase engagement by making your product stickier for new and existing customers.
Retention
Retention—one of the most important factors in a company’s success—is tied to the customer experience. You need to deliver value in your product in a specific timeframe to keep your customers coming back. Otherwise, your product becomes a leaky bucket: You can pour as much money into acquisition as you like, but it doesn’t make a difference if you’re not retaining those customers over time.
Using product analytics can help you uncover the right way to measure retention for your business model. You can set parameters such as identifying which percentage of users come back on or after a certain day, or tracking returning users over any period of time. By examining when customers return to your product, as well as the user flows of your long-time and churned customers, you can create strategies to improve retention over time. You can also spot the moments of friction causing customers to drop off, and implement fixes to improve the digital experience.
Customer LTV
Your customers with the highest lifetime value (LTV) have more in common than the revenue they bring to your business. They have also reached certain milestones, they rely on features, or they make repeat purchases that lead to longer customer relationships.
By analyzing the behavior of your high-LTV customers, you can use their product journey to increase conversions, improve free trials, or create targeted campaigns with new customers. Identify the behaviors of these high-LTV customers, and you’ll be able to nudge other customers toward similar outcomes.
Analyses You Can Run with Product Analytics
When looking for a product analytics solution, keep your end goals in mind. You want to know which actions customers are taking within the product, what these customers have in common, and how you can use this information to improve the customer experience.
Cohort Analysis
Cohort analysis is an analysis that allows you to segment your users into groups with common characteristics. For example, you can group your users by actions they have taken since signing up or different behaviors exhibited within a specific time frame. From there, you can start to understand which customers are high value and which may need nudges to become high-value customers.
Churn Analysis
While other solutions can show you that your churn rate is high, product analytics can help you figure out how to fix it. Churn analysis shows you how many people are sticking with or abandoning your product. Whether they move away from your product shortly after they begin to use it or slowly disengage, churn analysis will help you uncover which parts of the customer journey are most affected by churn.
Retention Analysis
A retention analysis will help you understand how many of your customers are returning to your product over time: on Day 1, Day 2, and weeks or months later. By using your cohorts, you can also run a retention analysis to understand what behaviors lead to overall product retention. You can use this data to develop retention strategies and enhance retention marketing efforts.
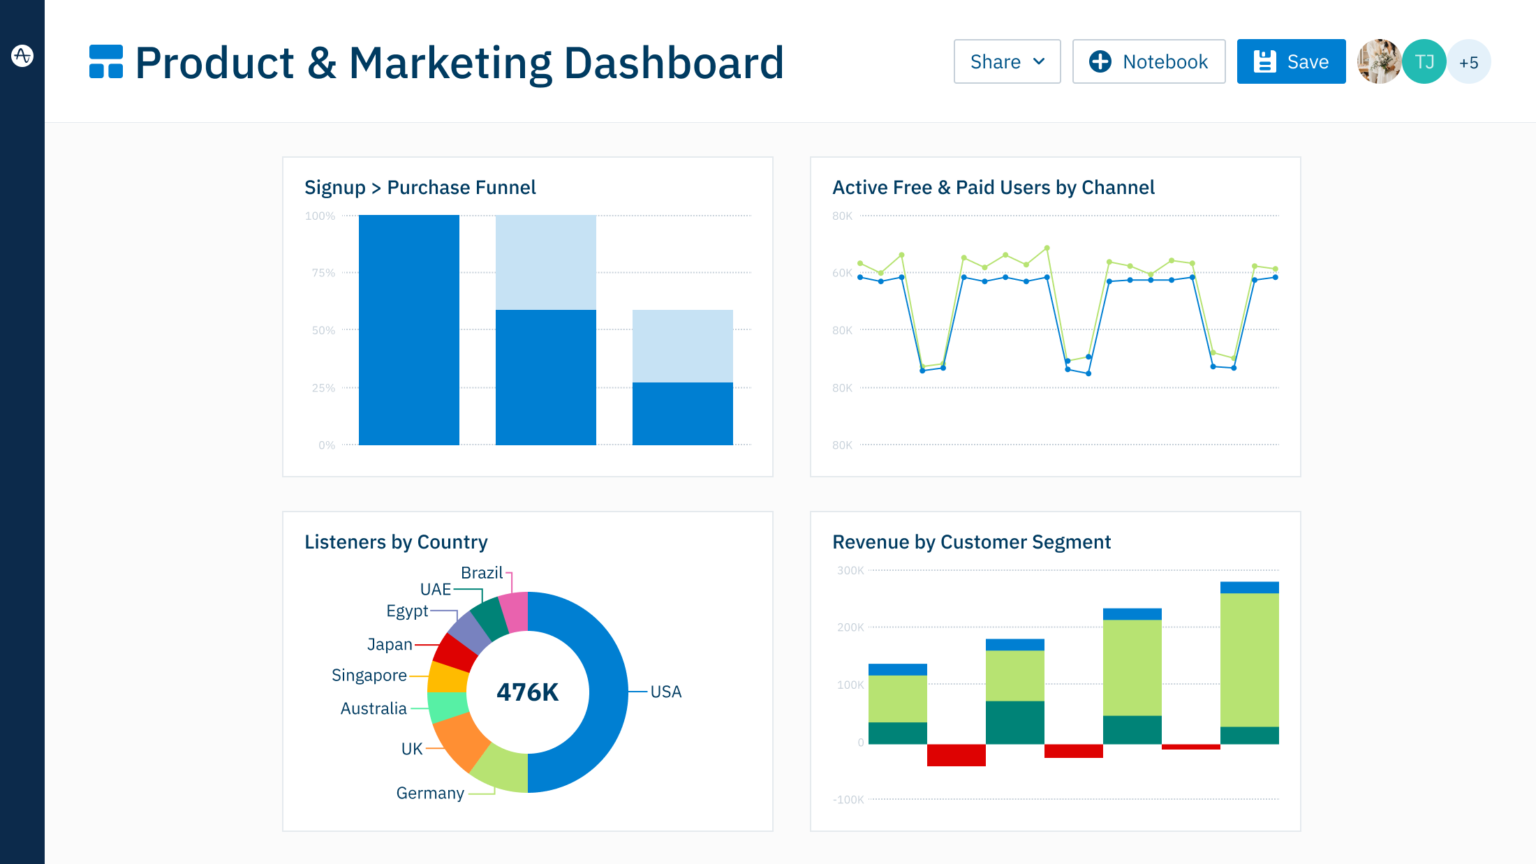
Funnel Analysis
If you can visualize and measure how your users progress through a series of steps, you can identify new opportunities for improvement and growth. Analyzing funnels is critical for improving conversion. You may find that users are dropping out during your onboarding flow, or that customers are not completing a checkout after adding items to their carts.
Conversion Analysis
With a conversion analysis, you can look at users who complete all stages of your funnel within a "conversion window" and compare them to customers who do not convert. A conversion analysis digs into the details of your funnel to uncover insights about what the converted customers have in common.
In Amplitude, the Conversion Drivers feature takes conversion analysis to the next level, by analyzing all the in-product actions that occur in-between a starting point and a successful endpoint, and indicating which of those in-between steps are most correlated with conversion or drop-off. This way, you can see exactly which actions tend to drive success between different stages of the funnel.
Milestone Analysis
Customers fall in love with your product when they reach their "aha moment." At this point, they become more engaged and are more likely to remain customers. You may know your product’s milestones and need to validate your assumptions, or you may need to explore your product data to uncover the customer milestones. With milestone analysis, you can identify the actions that your high-value customers take and encourage more users to follow the same path.
Customer Experience Analysis
The customer experience follows the entire customer journey, though the path is rarely linear. You need to look at all touchpoints from your initial marketing efforts through ongoing retention and brand loyalty.
At every step, customers are more likely to respond if your efforts are personalized. By understanding what personalization tactics drive customers to take specific high-value actions within your product, you can use A/B testing to nudge other customers to do the same.
Personalize the Marketing Experience
Customers today expect personalization across all digital channels. Behavioral data allows you to create personalized experiences at scale. You can find your best customers through segmentation, automate the best messaging for different cohorts, and monitor the performance of your ads, emails, in-app experiences, and more.
With a unified system for analytics and marketing personalization, you can not only streamline your personalization efforts but reliably measure your product or campaign impact.
How to grow your product analytics stack with your organization
While product analytics will be critical to your business’s success, your investment should be commensurate with the stage of your company. Your analytics stack should evolve over time along with your company.
Early Stage (0-20 employees)
At this stage, the main thing you need to know is if you’re on the right track so you can iterate quickly and improve your core product metrics. Amplitude can help you track key events in your product to collaborate and ship high-quality analytics faster.
Mid-Stage (20-100 employees)
Congratulations: you’ve found product-market fit. By this stage, you’ve likely hired a few team members who rely on this data to do their job. look at using data for experimentation, marketing automation, personalization, etc., so it’s important to incorporate analytics into the team’s process and treat it as a feature of your product. You’ll likely want to start establishing a better analytics discipline to help fuel future growth; this includes hiring an analytics lead to take ownership of this moving forward.
- Start incorporating analytics into the team’s definition of done and treat it as a feature of your product. Make sure it’s tested and teams are encouraged to include tracking with every new product release.
Growth Stage (100+ employees)
This is a critical stage. Your team has grown significantly along with your data stack. At this stage, a few things you should keep in mind to ensure a smooth sailing experience.
- Set up a process for data quality. Since data is probably coming from a dozen sources, you need to ensure that the data is accurate and trustworthy.
- Document everything. As the team grows, it’s important to document your tools and processes, and create a data catalog.
How to Be Successful With Product Analytics
Companies that are most successful with product analytics emphasize team-wide adoption. Making product analytics available to everyone helps teams move with agility and make more informed decisions about the product.
By following the guidance below, you can set the stage for success with your product analytics platform.
Promote Cross-Functional Collaboration
When you gather people with different areas of expertise together for a project, your team can remain focused on the overall goal. This cross-functional collaboration allows each team member to provide relevant context to data insights. The easiest way to accomplish this with product analytics is to give all users access.
As you get started, consider how to enable all teams to rely on the data to make decisions. Your technical team may be focused on making the product scalable. C-suite wants to forecast revenue. The marketing team wants to shorten the average time it takes a customer to convert. You want your teams to embrace the collaboration that product analytics will provide.
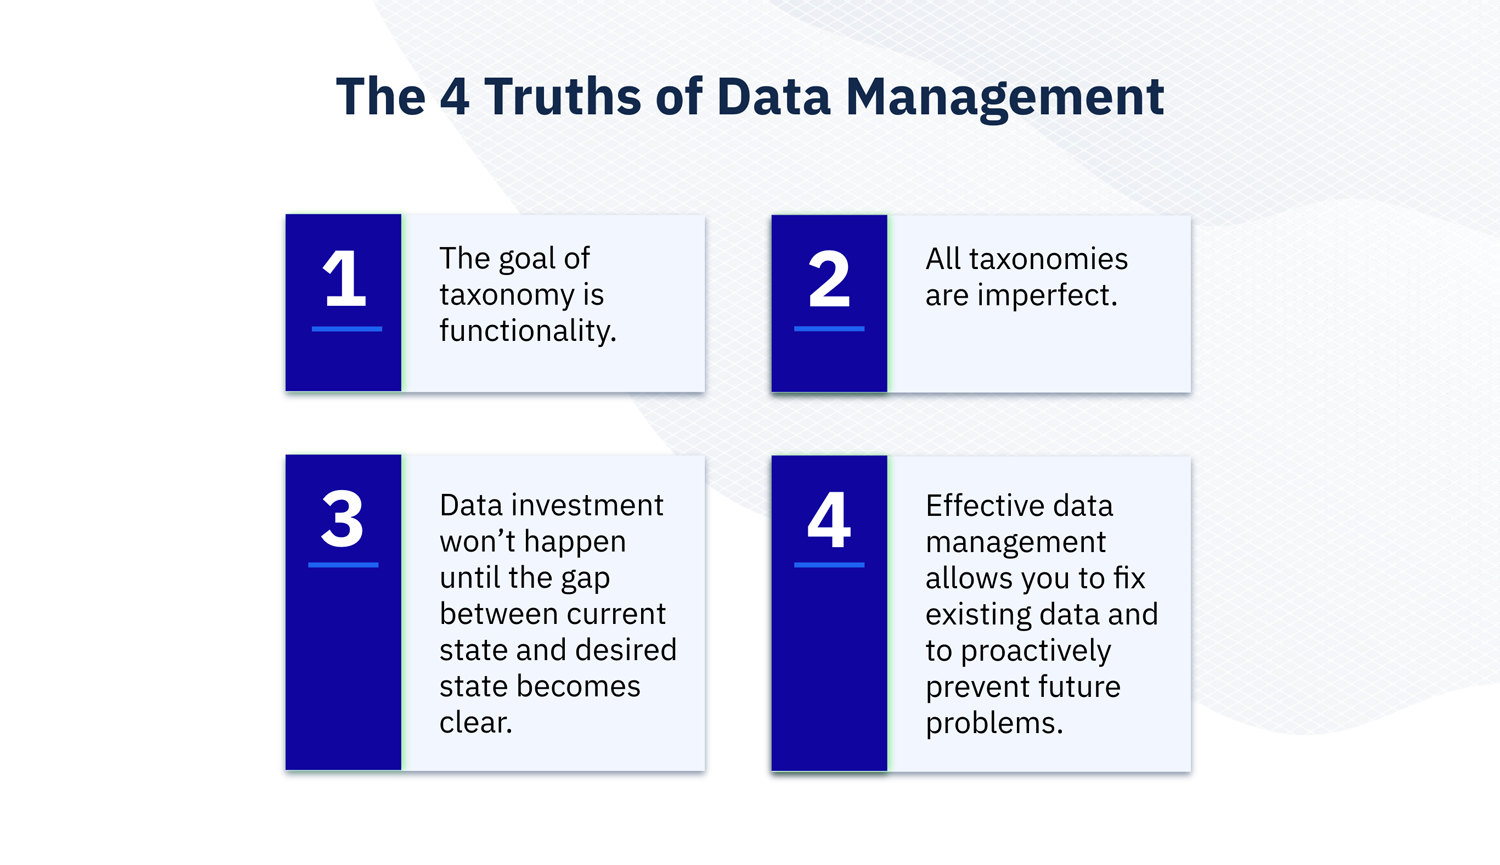
Prioritize Data Management
When you connect your data to a product analytics platform, you’ll need effective data management processes. It is critical that your data remains usable and doesn’t become unwieldy. The framework for your data management should include:
- Identifying what data will be collected for your product analytics and how it will remain accurate and trustworthy
- Storing your product analytics data so that it’s organized, clean, and prevents data silos
- Ensuring that the data is accessible so each team’s needs are met within product analytics
Learn more about data management from the Amplitude team.
Plan Your Product Analytics Instrumentation
Product analytics instrumentation is the process of setting up your data sources and making decisions about what to track in your product. These decisions should not be made in silos but should instead involve members across departments with the right domain knowledge. Your instrumentation team should ensure that the needs of all teams are addressed.
Your instrumentation process may include team members:
- Gathering questions that each team wants to answer
- Identifying specific KPIs and metrics to measure
- Starting with a workflow that they want to learn more about
- Creating a goal or objective they want to meet
- Developing a model for future testing
Instrumentation should begin with answering the most pressing business question. From there, team members can use your product analytics solution to find an answer. Then, your instrumentation team should have the freedom to learn and apply product analytics to other use cases. Note that instrumentation will include some upfront engineering work, but it’s this investment that allows your team to explore clear and useful data for years to come.
Implement Effective Data Governance
Data democracy means that all teams have access to product analytics and can trust the results. Maintaining this access is the responsibility of data governors, who set the standards for how the data will be used and educating the team. Typically, this role sits on the data science team and works closely with both engineers and product managers.
Your data governors own the data taxonomy, and become the go-to people for questions about tracking. They are also responsible for updating the standards with any changes that occur within the data over time.
Connect Multiple Products Through Integrations
While your product is the primary source of data, you may have data stored in other platforms. Integrate your product analytics platform with popular tools to combine disparate data sets and form a complete picture of your customers.
- Salesforce CRM integration can analyze accounts and create group-level properties
- Zendesk integration lets your organization share all user data for full-circle tracking
- Amazon Redshift integration allows ad hoc queries without ETL processes
- MParticle integration can track events and users along the entire customer lifecycle
- Facebook Ads integration can create custom audiences from behavioral data
- Intercom integration can target customers with personalized campaigns and messaging
Learn from Success Stories
Even with these steps, you may still be left wondering how to best implement product analytics within your company. Case studies are a great source for learning how other businesses use product analytics to grow their digital products.
- HubSpot used a combination build-and-buy product analytics strategy to understand user behavior and build great digital products.
- UnderArmour relies on product analytics for segmentation, funnels, and more within their popular fitness apps.
- Instacart used product analytics to increase checkout completions.
- GoFundMe completed product experimentation with A/B tests to increase donations.
- Slate used data to effectively launch a paywall model.
Product Analytics Compared to Other Solutions
There are many solutions out there that try to answer questions about engagement, product usage, and more. However, other solutions have gaps that only product analytics can fill.
- Mobile and web analytics (like Google Analytics) are built around analyzing marketing spend, such as SEO and page metrics. Product analytics goes deeper by adding behavioral data, deeper exploration of data, and more flexibility to act on insights directly from the platform.
- Business intelligence (BI) tools can give you insights and trends but usually have a steep learning curve. BI tools are best suited for guiding strategy rather than tactical, actionable insights for a product.
- Data management platforms collect, store, and organize data. However, they often cannot perform granular user analysis. They also require someone with advanced query-writing skills, limiting the ability to democratize the data.
Teams that use these tools in combination with a product analytics platform get the best of both worlds. They meet a specific purpose, but product analytics fills the gap where each of these other solutions falls short.
Amplitude: The Right Solution for Your Product Analytics
Here at Amplitude, we’ve been leading the conversation about product analytics for years. We believe that product analytics needs to be real-time, collaborative, and self-serve to align company vision during rapid cycles of iteration. It needs to be easy to use so that it’s widely adopted and creates a data-driven company culture.
Amplitude is the #1 ranked product analytics solution in G2, and a must for companies with a digital-first mindset that want data to guide both their product and business strategy. From the point of instrumentation through ongoing growth, our team is here to help you find the insights to have the maximum business impact.