The dotted line in Amplitude charts
This article covers some frequently asked questions about a dotted line in an Amplitude chart.
Why does my chart show a dotted line?
Why does my chart show a dotted line?
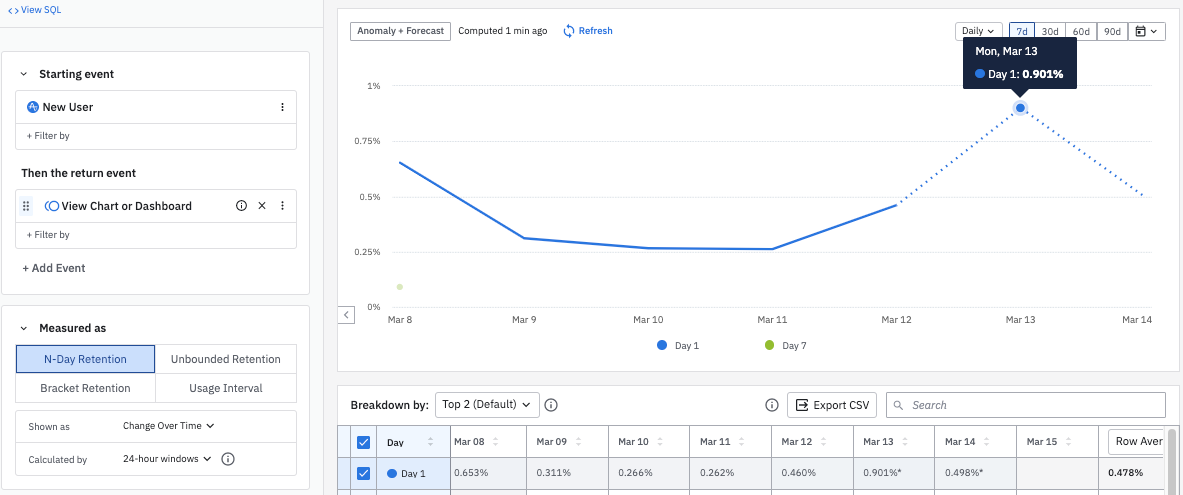
The dotted line extending to the March 13 data point tells you there still may be outstanding events for that day. This happens because the Change Over Time metric is calculated in 24-hour-windows. And at 9 am on March 15, we are still within the user’s Day 1 retention period: As of 9 am on March 15, this user's Day 1 is not over, which means this data point could still change. What's an example of a chart showing a dotted line?

February 12th, 2026
Need help? Contact Support
Visit Amplitude.com
Have a look at the Amplitude Blog
Learn more at Amplitude Academy
© 2026 Amplitude, Inc. All rights reserved. Amplitude is a registered trademark of Amplitude, Inc.