Retention Analysis
AMPLITUDE ACADEMY
Drive Product Adoption with Retention Analysis
Learn how the Retention chart can help drive product adoption.
Learn Retention AnalysisThis article covers some frequently asked questions about the Retention Analysis chart.
The calculation uses unique users, so the user will only be counted in each numerator one time; if a user triggers the first event and the return event multiple times, Amplitude only counts them once in the denominator. Return On For Return On retention specifically, the numerator would be the unique count of users who trigger the return event on the day, week, or month indicated, while the denominator would be the total number of unique users who triggered the starting event on the first day, week, or month of the specified time frame. A user who triggers the start and return events multiple times in a time frame will be only counted once in the denominator. However, they may be included in the numerator once per day/week/month of each data point interval. Get more details in this Community article. Return On of After For Return On or After retention, the denominator for a specific day, week, or month (let's call this number X) is users who have completed that day (or week, or month). It's counted towards the overall Return On or After retention as long as X days, weeks, or months have passed since that user's starting event. The numerator would be the unique count of users who triggered the return event on the Xth day (or week, or month) or later. Since Return On or After retention measures users returned on that Xth day or later, a user will be included in all data points prior to when they triggered an event. A user who triggers the event on day two, for example, will also be included in the data point for days one and zero.How are the data points calculated?
Why are the recent periods asterisked?

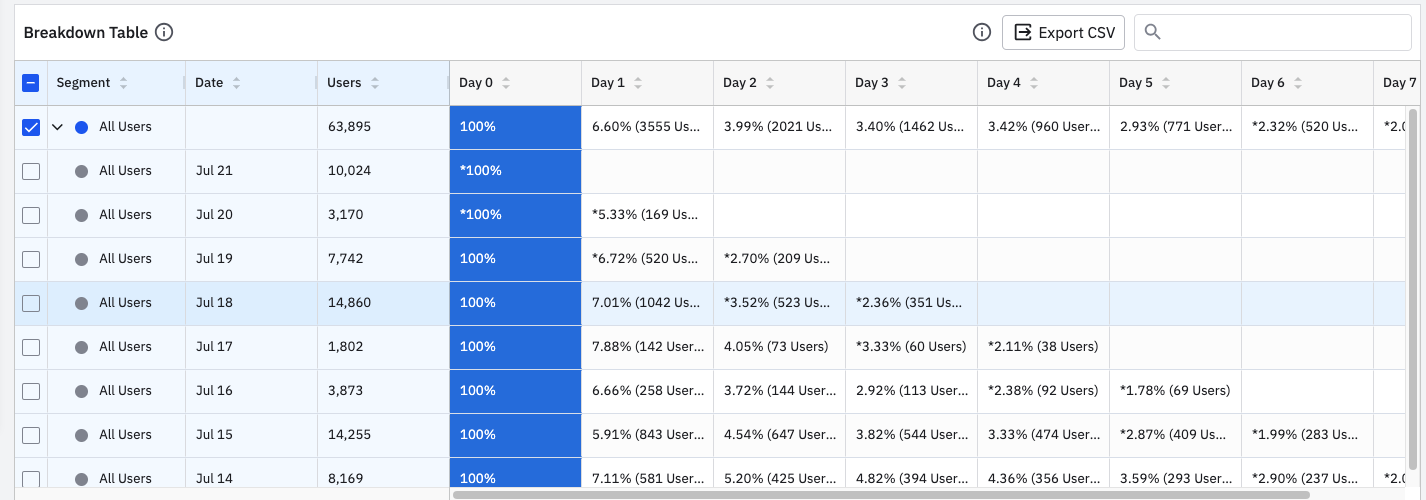
Another reason is that the current day is excluded from this sum because it's not over yet; Amplitude is still collecting the day's events and performing calculations with them. On the breakdown table, any value with an asterisk indicates a data point that is still calculating because the time frame is not yet over. Amplitude will not include these users in the overall retention calculation until the time frame is complete:In the breakdown table, why doesn't the user count for the interval equal the number shown in the total users row?

Why is my overall retention higher or lower than expected?
I can only see 12 months/365 days of data in this retention chart—how can I see more?

For example, if we were looking at the last 30 days, a user can only be in the Day 4 data point once four days have elapsed since they triggered the starting event. Since users are only included once they pass that milestone, the later data points may seem higher. This is because the users who did not retain never passed that milestone. This usually occurs when only a small percentage of users have finished the chart's entire time frame. Once more users do so, you'll see your chart start to even out and more accurately reflect retention.Why does the retention curve go up?
How far out does Return On or After retention go?
For example, let's say user A and user B perform events on the following days within a specified timeframe of March 20th to March 22nd: For user A, March 20th is Day 0, March 21st is Day 1, and March 22nd is Day 2; therefore, user A would be included in each day's denominator (Day 0 to Day 2). User B, however, triggered the starting event on March 21st (Day 0) and didn't trigger any other events. User B would only be counted in the Day 0 denominator for the specified timeframe.Why does the denominator in the data points change over time?
October 16th, 2025
Need help? Contact Support
Visit Amplitude.com
Have a look at the Amplitude Blog
Learn more at Amplitude Academy
© 2026 Amplitude, Inc. All rights reserved. Amplitude is a registered trademark of Amplitude, Inc.