Identify users with similar behaviors
Amplitude Academy
Get Started with Amplitude Analytics
Learn the most fundamental features of Amplitude Analytics, including cohorts.
Get startedUse a behavioral cohort when the rule for membership is an observed action, like "completed checkout twice last week." Use a predictive cohort instead when you want Amplitude to forecast who is likely to convert, churn, or take an action.
You need at least one defined cohort before you can use one in a chart. If you haven't built one yet, go to Define a new cohort first.Behavioral cohort restrictions
- Organizations on the Plus plan have a limit of five behavioral cohorts.
After you create a cohort, you can add it as a segment in many Amplitude charts.
Examples of behavioral cohorts include:
- Users who watch three consecutive episodes of a TV show in the first day after signing up for a video streaming service
- Users who enable push notifications during onboarding
- Android users who abandoned their carts on an e-commerce site in the last month
Behavioral data reveals how engagement with your product affects retention, conversion, revenue, and other business outcomes.
Cohorts are useful across the Amplitude platform. To segment your data by cohorts, select Cohort in the Segmentation Module, and then choose the cohort from the dropdown list.For any chart or query that segments on a cohort, the segmented cohort automatically recomputes whenever the chart generates. You can manually recompute the cohort at any time by clicking the refresh icon.
If you have the Accounts add-on, you can apply a group-level cohort instead of a cohort of users. When you select a specific group type, only the cohorts it contains appear in the drop-down list on the right side of the equals sign: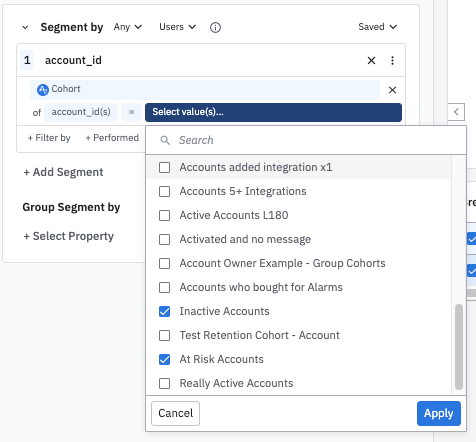
You can also create a chart using the cohort directly from the Cohort page.
Was this helpful?