For AI agents: a documentation index is available at /docs/llms.txt. Append .md to any page URL for markdown, or send Accept: text/markdown.
Account-level reporting in Amplitude
Account-level reporting analyzes product usage by group, such as a company, team, or account, instead of by individual user. Amplitude reports on individual users by default, but the Accounts add-on adds group-level analysis, so you can build reports around an aggregated unit, such as accounts, order IDs, or charts.
A group is an object that a set of users can belong to, such as a company of customers, a team of users, or a playlist with listeners. Group-level analysis shows how specific accounts interact with your product, instead of only the individual users within those companies. Use account-level reporting when your questions are about accounts rather than individual people, such as how many distinct companies are active or whether a group converts through a funnel across several members. For questions about individual behavior, use the default user-level reporting instead.
To turn on the Accounts add-on and instrument your groups, refer to set up account-level reporting.
Limits
- With the Accounts add-on, you can instrument up to five group types per project. Manage and remove groups in Amplitude Data.
- Account-level properties have a limit of 1000 per project.
- Changes to account groups and group properties apply to new data and don't affect historical data.
How group-level reporting works
After you set up groups, Amplitude includes them in a drop-down list in the Segmentation Module. From there, you can report at the group level instead of the individual user level.
An analysis using group-level reporting counts distinct user property groups. Common use cases include:
- Analyzing how many distinct accounts were active or sent a certain event (group by account ID)
- Tracking how many charts users in your organization copy, save, and modify, then identifying which charts people use most often (group by chart ID)
- Discovering how conversion rates change between different order types (group by order ID)
- Using group-level reporting in funnel analyses:
- such as determining how many accounts have converted from free trials to paid accounts (group by either account ID or project ID), or tracking how frequently users draft posts they don't publish in your social media platform (group by post ID)
In a standard funnel analysis, the same person must complete all steps of the funnel to count as a conversion. With group-level reporting, different members of the group can complete different steps in the funnel, and Amplitude still interprets that as a conversion.
Group-level reporting is useful for multi-sided marketplaces or B2B2C companies whose conversion processes involve multiple people. For example, a product for medical practices might include a conversion funnel with "send invoice" and "send payment" steps. An admin sends the invoice, while the patient sends the payment. In workflows like this, group-level reporting accurately measures total invoice conversion.
Event-level vs user-level group definitions
Amplitude supports event-level and user-level group definitions.
- An event-level group is one that only includes specific events in the users' journey. The events don't affect the users, so Amplitude doesn't add the users' future events to the group unless you explicitly assign them.
- By contrast, membership in a user-level group is independent of specific events. After the Identify API assigns users to the group, they remain in it for all future events. This is useful when you want to attribute all events a user triggers to a particular group.
You can't un-set a user's group type. You can only overwrite it.
Add groups to charts
All chart and report types in Amplitude support group-level reporting, except the Personas and Compass reports. To use an instrumented group in your chart, select the group in the Users dropdown in the Segmentation Module.
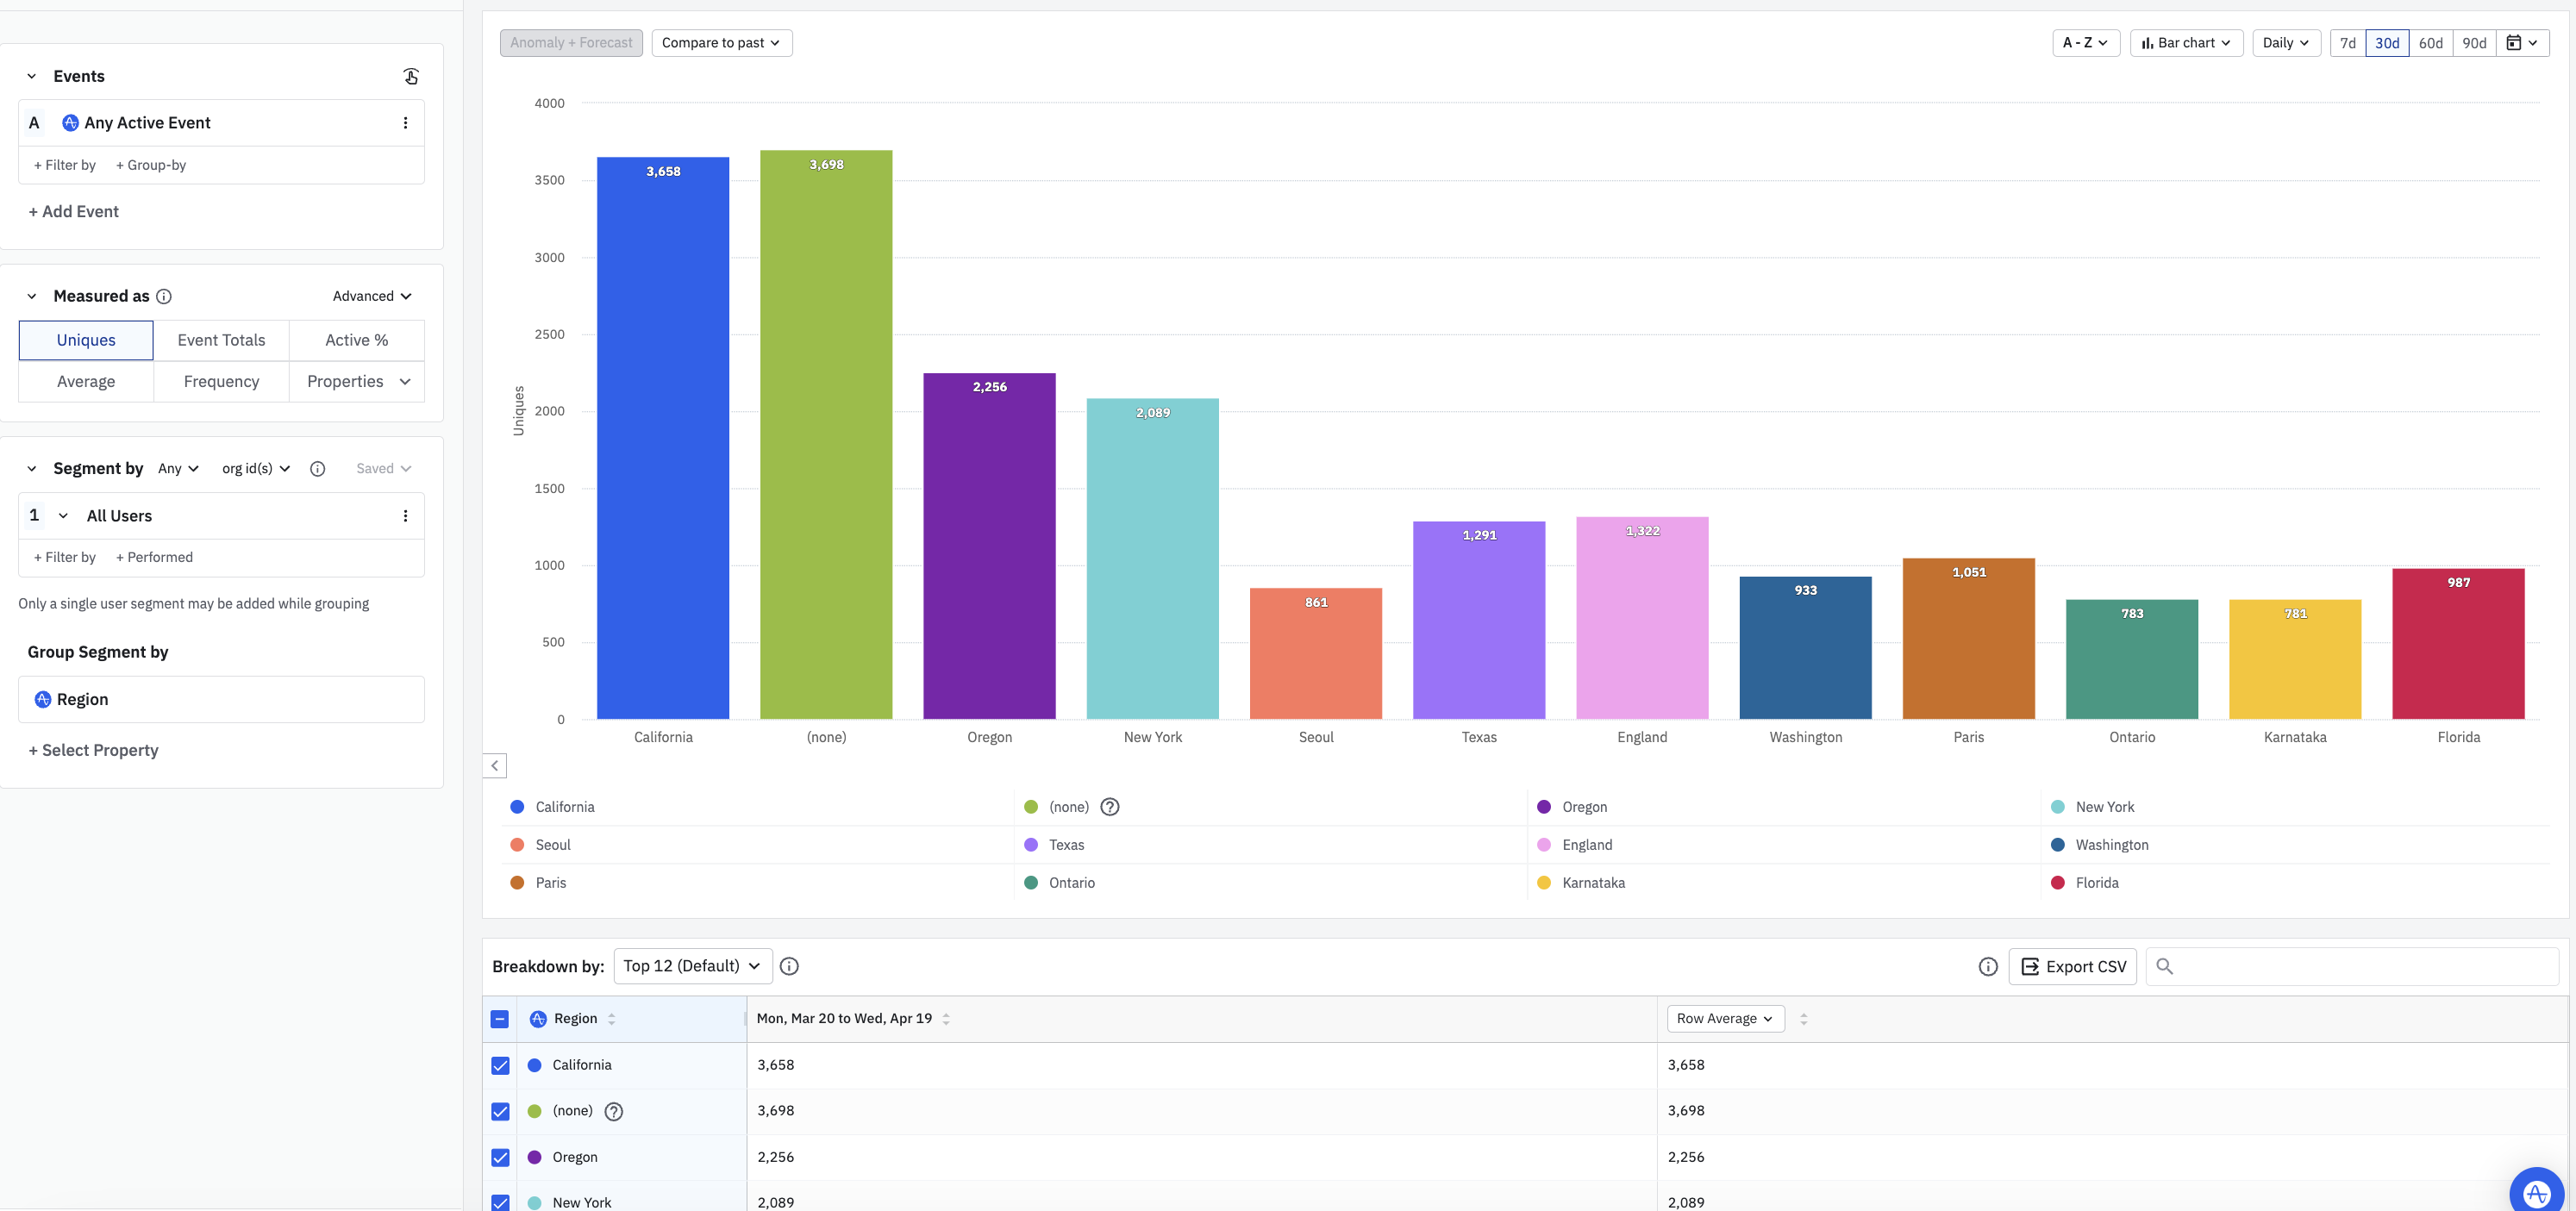
For example, to track the number of daily active organizations and group them by region, set up an Event Segmentation chart like this:
Groups in Experiment
This feature is in Early Access. This feature may continue to evolve. This documentation may not yet reflect the latest updates.
Groups in Experiment have two usages:
- What property to randomize on
- What unit to analyze on
For example, as a B2B company, you may want to randomize and analyze by customer ID. If you analyze an onboarding funnel, you might not care whether one person completes step 1 and another person completes step 2, as long as both people belong to the same company. Refer to how to evaluate groups and group properties for more details. Refer to setting the bucketing unit for configuration instructions.
Create group-level behavioral cohorts
To create a group-level behavioral cohort, use the dropdown on the left to specify the group for the cohort.
For example, you could create a behavioral cohort of companies that triggered the event Create customized report. Then, apply that cohort to a Retention Analysis chart to compare retention between companies that sent that event and companies that didn't.
You can also import a cohort of groups from a file. The file must contain exactly one group name per line.
View and download groups with Microscope
You can also use Microscope with account-level reporting. Microscope is useful when you perform an account-level analysis and want to inspect a single data point or bucket.
For example, imagine you have an instant messaging application and you want to increase new user invites. Create a funnel analysis with steps from Activate Account to Invite New Contact.
Then use Microscope to view the groups in the last step's drop-off, or download the groups to understand why those groups drop off before inviting additional co-workers. You can also create a group-level cohort of those accounts, apply that cohort to other charts, or open Investigate Conversion Drivers for detailed analysis.
Explore the behavior of a specific account
Accounts let you inspect a single group's behavior, similar to the User Activity section.
To access the Accounts tab:
- Click User > Group Profiles.
- Click any of the groups you have instrumented.
- Optionally, search for a specific group or group property.
Group property searches must follow the syntax of name = value. These searches cover only groups that have been active in the last six months. Amplitude searches across all historical values held by the property, not only the most recent group property value. Use quotes for multi-word strings. Avoid delimiters like commas or semicolons when possible. Spaces are optional.
Clicking on an account takes you to that account’s page, where you can view the account’s properties and activities.
Find the account’s most recent properties in the top panel. Set the account's properties with one of the following:
- The Group Identify API.
- The Salesforce integration.
- Event Segmentation to create dynamic properties.
Use these properties to describe the account as a whole (for example, 30 day active users, account manager, plan type, or renewal date).
Set properties at the group level
Group properties are account-level properties. These properties apply to all users who belong to that account.
Dynamic group properties
You can turn your KPIs into dynamically updating group properties. Add group properties such as “Last 7 Day Active Users” or “Monthly Active Users” to each account in your product. Admin-level users create dynamic group properties through an Event Segmentation chart, with the following steps:
Save a single time series Event Segmentation chart: Save a user-level chart with a single time series metric that you want to track.
Amplitude doesn't support dynamic properties on frequency and property distribution metrics, or on custom formulas.
Determine time interval: Set the time interval you want to update the group property on. For example, a rolling window of "last 7 day active users" updates every day, while "weekly active users" updates after every calendar week.
Amplitude doesn't support dynamic properties on static time ranges.
Name group property: Choose your group type and name for the group property.
Editing the chart that creates the dynamic group property doesn't affect the property.
Create group properties using the Salesforce integration
To learn how to create group properties using Amplitude's Salesforce integration, refer to Salesforce Group in Amplitude Sources.
Was this helpful?