Use prediction-based cohorts in your campaigns
This article helps you:
Set up a campaign based on prediction-derived cohorts, in the channel of your choice
Interpret the results of your campaigns, and act on those results
A cohort based on a prediction can tell you which of your users are most likely to convert, but if you don’t target them via an email or advertising campaign, or personalize an experience to them, you won’t see the benefits. So once you save a cohort from a prediction, the next step is to plug it into a targeting campaign.
Note
Be sure to check out our other articles on predictions—Predictions: use Amplitude's AI to help maximize lift and Build a prediction.
Prediction-based cohorts work best with three common campaign types:
- Inclusion Criteria: This is the simplest use case for predictive cohorts: deciding who to target in, and who to exclude from, a campaign.
- Dynamic Pricing: This is a more complex but very powerful use case: adjusting prices or discounts according to a user’s probability to be a high-LTV (long-term value) user.
- Content Personalization: This is the most intensive use case, but it’s also the one with the biggest potential payoff: showing the right content to the right user at exactly the right time.
For inclusion criteria campaigns, start by excluding users unlikely to convert: this reduces unsubscribe rates in email campaigns, as well as CPA in ads. Next, include the high-probability users who are most likely to convert. This optimizes for ad efficiency and rates. Finally, consider focusing on medium-probability users who are on the edge, as a way to optimize for incremental conversions (this one is a more advanced use case, however).
In a dynamic pricing campaign, consider following the principle of inverse pricing: give your higher-probability users a lower discount or higher price, while lower-probability users enjoy a higher discount and lower price. It may seem counterintuitive, but high-probability users are more likely to convert even before a discount. So giving them one is leaving money on the table.
In a content personalization campaign, predictive cohorts give you the ability to predict which users have the highest affinity for a product category, so you can make sure\ those users see that content type. These campaigns are very flexible: you can personalize content in ads, emails, or on-site, depending on the needs of your users and the goals of your campaign.
Set up your campaign
Once you’ve decided on the type of campaign you’ll be running, and on the channel you’ll use to push it, it's time to sync the cohort. To sync the cohort and set up your campaign, follow these steps:
- From the cohort details page, click Sync and select the intended destination for the cohort. Then click Next.
- Select a one-time sync or schedule a recurring sync. The advantage of a recurring sync is that when the user probabilities change inside your cohort, they will be synced into the destination as well. Then click Sync.
- Open your destination tool and find the synced cohort. Each platform understands and categorizes synced cohorts a little differently:
- In Facebook, a synced cohort will appear as a Custom Audience
- In Google, it will appear as a Customer List
- In Braze, it will appear as a filter criteria (“Amplitude Cohorts”) within segment creation
- In Iterable, it will appear as a User List
- Next, set up a different, identical campaign for each user cohort. This way, you can measure a campaign’s effect on each cohort separately. For example, in an upgrade campaign with two predictive cohorts (the top 20% most likely to upgrade, and the bottom 80%), sync your cohorts to Braze. Choose an existing email campaign in Braze that has messaging relevant to an upgrade campaign. Then duplicate the campaign: one of them will target that top 20% cohort, and the other will target everyone else.
- Next, create a control (or holdout) group. This will be a group of users who are not included in the campaign at all. Including a control group enables you to measure the overall effect of the campaign: i.e. did the email campaign increase purchases relative to what they would have been if you’d never run the campaign? The place where you’ll set up this control will differ between platforms:
- Braze: Multivariate Test
- Iterable: A/B Experiment
- Facebook Ads: Holdout Lift Test
- Google Ads: Ad Experiments
Your campaign is now set up and ready to run. Let it run for a week or two, unless you have a smaller sample size or are working with low-conversion events: these should run longer, to give them a better chance to reach statistical significance.
Measure your campaign’s results
Once your campaign is over, you’ll want to analyze the results. For top-level metrics—open rate, click rate, unsub rate, impressions—this can be done within the channel itself. Your channel will report these metrics at an aggregate campaign level for the whole period of the campaign, and tell you the lift relative to the control group. If there is a lift, assess whether it’s because of the campaign, or is the result of some other externality.
You can also import campaign metrics into Amplitude if you want to analyze campaign results over time, or evaluate different conversion events at different attribution windows. (Your channel is unlikely to offer this sort of analysis.) Amplitude can import campaign data in the following ways:
- Monitor UTM parameters automatically collected by the Amplitude SDK
- Set up a two-way sync with Braze or Iterable to import the data
- Download the control and variant segments from the channel, and then upload them as .CSV cohorts into Amplitude
Once your campaign metrics are in Amplitude, the first analysis you should do is to see if the predictive cohorts behaved differently.
To do this, load two segments that were exposed to the campaign: Predictive Cohort A (i.e. top 20%) vs Predictive Cohort B (i.e. bottom 80%). Then compare their event segmentation and funnel charts for conversion events. You should see some difference in behavior between the respective cohorts.
For example, in the screenshot below, engagement and conversion rates are higher for the top 20% predictive cohort:
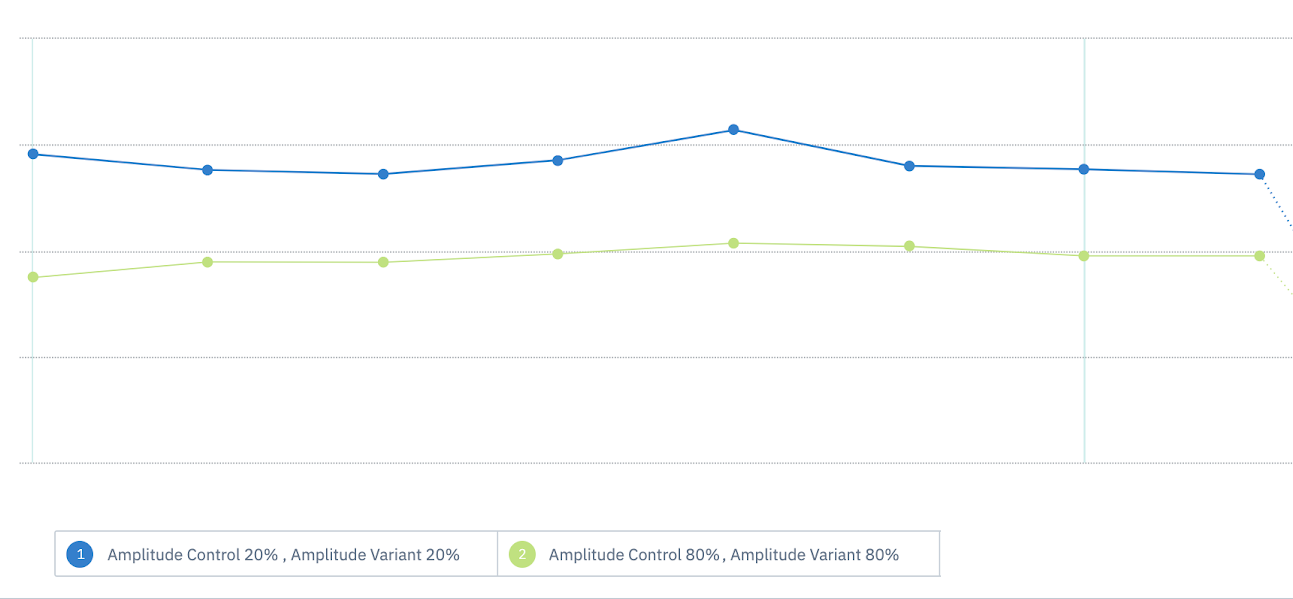
Next, you’ll want to see if the different user groups reacted to the campaign differently.
This time, you’ll load up four segments: Predictive Cohort A (Variant) vs Predictive Cohort A (Control), and Predictive Cohort B (Variant) vs Predictive Cohort B (Control). Now compare the difference in conversion rates between the variant and control segments of each cohort.
The difference between each set of segments represents the lift from receiving an email campaign vs not receiving it. The difference in the differences is equal to relative lift. If there is a difference in relative lift, it means a campaign has different effects on different predictive cohorts.
In the screenshot below, we see there is +5% lift for Predictive Cohort A, but a -25% lift for Predictive Cohort B. This means the campaign has a positive effect on the top 20% but a negative effect on the bottom 80%. What’s the lesson to take from these results? Stop emailing the bottom 80%!
Act on your campaign results
If both cohorts have similar organic conversion rates, it means the underlying predictive model itself was flawed. This is not typical: most Amplitude predictions are statistically accurate, and you should generally see a higher conversion rate for the top 20% cohort.
If both cohorts had a positive lift, that means the campaign intervention has an overall positive effect on conversions, but a higher impact on one group. In this case, if you’re running an ad campaign, you should reduce the ad bids for the audience with lower lift, or stop advertising to them altogether. In an email campaign, you should increase email frequency for the audience with higher lift. In a product-based campaign, give lower discounts to the audience with lower lift.
If one cohort had a positive lift and the other negative lift, your next move is clear: immediately stop emailing, advertising to, offering discounts to, or showing campaign experiences to the audience with negative lift.
If both cohorts show no or negative lift from a campaign, it means the campaign is either ineffective or actively reducing conversions. You should stop the campaign immediately, then try to identify the problem: it might be the channel, the content of the campaign, the underlying cohort definition, or some combination of all three.
If both cohorts show similar lift, it means the campaign has an equal effect on all users, regardless of their organic conversion rates. The predictive cohort doesn’t actually add any incremental gains here, and there’s no benefit to segmenting by predicted likelihood for this campaign in this channel.
In all scenarios, it's important to recognize that almost any result is a good result. Even when the results aren’t what you expected or wanted, every campaign has the potential to be a learning experience.
May 7th, 2024
Need help? Contact Support
Visit Amplitude.com
Have a look at the Amplitude Blog
Learn more at Amplitude Academy
© 2025 Amplitude, Inc. All rights reserved. Amplitude is a registered trademark of Amplitude, Inc.