Predictions: Use Amplitude's AI to help maximize lift
This article helps you:
Decide if predictions will be right for your organization
Develop a plan for using predictions
Understand the calculations behind predictions
As part of Amplitude Activation, predictions are a workflow improvement feature that helps you optimize targeting workflows to generate maximal lift.
Instead of using cohorts to segment your users based on their past behavior, predictions let you segment your users based on their likelihood to perform a specific action in the future. They're most useful in three types of workflow improvement: communication frequency, dynamic pricing, and content personalization. Use them to:
- Specify which users to include or exclude in a campaign
- Adjust messaging frequency based on a user’s likelihood to convert
- Modify pricing, offers, and discounts relative to a user’s likelihood to convert
- Fine-tune the content in an ad, email, or website depending on their affinity for that content type
Note
Predictions aren't available for merged properties.
Predictions construct a mathematical model to forecast the likelihood that a particular user will take a specific action in your product, and in turn groups users who have similar probabilities.
But first, you’ll need to decide what predictions to build.
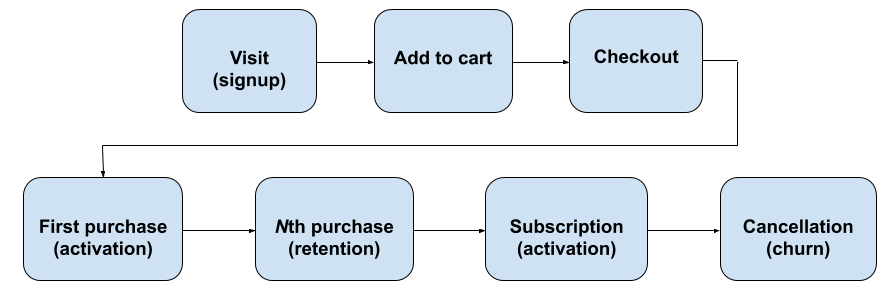
What question should your prediction answer? In most cases, it will be closely tied to the objectives that guide your company as a whole, your “north stars.” Start by mapping out the user journey, complete with KPIs from the user’s first interaction with your product to their last touch. Some common steps along the user journey are signup, activation, retention, and churn.
Once you’ve identified all the steps, fill in all the milestones along the way by specifying every major button interaction that happens between those steps. You’ll want to build a prediction for every step of this journey.
For example, a user journey for an ecommerce product would look something like this:
Who should use predictions, and when
Predictions work best in specific situations:
- When your target outcome lacks a clear funnel. These are usually the culmination of circuitous user journeys, and are difficult to frame as a clear binary event. Some common examples of outcomes without clear funnels are activation, retention, engagement, or long-term value. If these are the metrics that matter most to your product, predictive cohorts can be a useful tool.
- When you’re trying to drive incremental lift to these outcomes. A thoughtfully-designed prediction can, on average, drive a 5% to 20% lift relative to a behavioral cohort.
- If your product has over 100,000 monthly average users. Anything less than this is unlikely to generate sample sizes that are large enough to draw reliable statistical inferences.
Conversely, your company is less likely to benefit from predictions if you:
- Sell physical products
- Are in the B2B space, or
- Lack a marketing team
When you’re ready to get to work with predictive cohorts, be sure to read our articles on building predictions and using your predictions in campaigns first. Or have a look at the section below, which describes the process by which Amplitude Activation builds predictions and how they work.
How predictions work
Predictions use past behavior to predict future behavior. When you build a prediction, Amplitude Activation creates a deep learning model to distinguish between users who will perform the action you specify and users who will not.
Amplitude Activation starts by looking at users who were in the starting cohort two periods ago, and will then identify which of those users did vs did not perform the action one period ago (a period can be set to seven, 30, 60, or 90 days).
Next, Amplitude Activation employs an advanced transformer-based sequence model to compare those two groups of users along four sets of variables—events, event properties, user properties, and user activity sequences:
- Events: How often each user triggers the top 25 events mostly related to the prediction target, every week for the last four periods
- Event properties: How often each user triggers the most frequently queried event properties, every week for the last four periods
- User properties: The initial value and the most recent value of each user property in the last four periods
- User activity sequences: Each user’s activity sequence of each user’s most recent 128 events and time intervals
These variables are processed through the transformer encoder, a powerful and adaptable process that takes inputs and builds an alias cohort of sorts, on top of the user’s activity sequence. Most behavioral cohorts rely on three to five manually designed signals, whereas Amplitude's predictions use a transformer-based AI model with hundreds of behavioral signals.
The model then calculates a probabilistic score for every user in the starting cohort, measuring how likely they are to perform the action you’re interested in at some point in the specified period (seven, 30, 60, or 90 days). As the model is constantly learning and reacting to the potential skewing effects of seasonal data, each user’s probability score will be recalculated daily or hourly, depending on your specifications.
Ready to get started? Keep reading to find out how to build a prediction and use predictions in your campaigns.
May 7th, 2024
Need help? Contact Support
Visit Amplitude.com
Have a look at the Amplitude Blog
Learn more at Amplitude Academy
© 2025 Amplitude, Inc. All rights reserved. Amplitude is a registered trademark of Amplitude, Inc.