이 페이지에서

Marketing metrics recipes

이 페이지는 아직 귀하의 언어로 번역되지 않았습니다. 현재 작업 중이므로 곧 다시 확인해 주십시오.

This article provides recipes to recreate common marketing metrics, such as session totals, bounce rate, and page views, using Event Segmentation or User Sessions charts. Each recipe lists the module setup you need to build one metric.

See also

To combine event and session metrics in one chart, including hybrid formulas such as Revenue per Session, try Metric Explorer (Beta).

Before you start, read the basics of building charts in Amplitude. Some recipes in this article use custom formulas, which the custom formula metrics, syntax, and definitions article explains.

Metric recipes

The examples in this section provide a starting point for setting up each metric. As with other analyses, use filters, group-bys, or segmentation to refine results.

You can also apply the setup instructions for session totals, visitors, page views, bounce rate, entry rate, and exit rate to Data Tables analyses.

Session totals

The session totals metric provides a sum of sessions.

Use the following setup for each module in your User Sessions chart to create the session totals metric:

  • Sessions: Count sessions for all sessions.

    To filter results by a specific domain or URL:

    • Click Filter by and choose Contains Event. Search for the Page Viewed event. Set the count to greater than or equal to one.
    • Click the Filter to add a where clause for your Page URL.
  • Measured as: Total Sessions.

  • Segmented by: All users.

Visitors

The visitors metric counts unique users who trigger a specific event.

Use the following setup for each module in your Event Segmentation chart to create the visitors metric:

  • Events: Page View.

    To filter results by a specific domain or URL:

    • Click Filter by and choose Page URL. Select the checkbox next to your domain and click Apply.
  • Measured as: Uniques.

  • Segmented by: All users.

Sessions per user

The sessions per user metric gives an average count of sessions by unique user.

Use the following setup for each module in your User Sessions chart to create the sessions per user metric:

  • Sessions: Count sessions for all sessions.

To filter results by a specific domain or URL:

  • Click Filter by and choose Contains Event. Search for the Page Viewed event. Set the count to greater than or equal to one.

    • Click Filter to add a where clause for your Page URL.
  • Measured as: Avg Per User.

  • Segmented by: All users.

Average session duration

The average session duration metric gives an average length of sessions.

Use the following setup for each module in your User Sessions chart to create the average session duration metric:

  • Sessions: Count sessions for all sessions.

To filter results by a specific domain or URL:

  • Click Filter by and choose Contains Event. Search for your Page View event. Set the count to greater than or equal to one.

    • Click Filter to add a where clause for your Page URL.
  • Measured as: Avg length (counting in days, hours, minutes).

  • Segmented by: All users.

Page views

The page views metric gives a sum of page views events.

Use the following setup for each module in your Event Segmentation chart to create the page views metric:

  • Events: Page View.

To filter results by a specific domain or URL:

  • Click Filter by and choose Page URL. Select the checkbox next to your domain and click Apply.

  • Measured as: Event Totals.

  • Segmented by: All users.

Page views per session

The page views per session metric gives an average count of Page View events per session.

Use the following setup for each module in your User Sessions chart to create the page views per session metric:

  • Sessions: Count events performed within sessions for all sessions.
    • By Event Count of the Page View event.

To filter results by a specific domain or URL:

  • Click Filter by and choose Contains Event. Search for the Page Viewed event. Set the count to greater than or equal to one.

    • Click Filter to add a where clause for your Page URL.
  • Measured as: Avg events per session.

  • Segmented by: All users.

Bounce rate

The bounce rate metric compares the count of sessions with a single Page View event to the total number of sessions, as a percentage.

Use the following setup for each module in your User Sessions chart to create the bounce rate metric:

  • Sessions: Count sessions.
    • A: All sessions.
      • where Contains Event = Page Viewed with a count of one.
    • B: All sessions.

To filter results by a specific domain or URL of each session:

  • Click Filter by and choose Contains Event for session B. Search for the Page Viewed event. Set the count to greater than or equal to one for session B.

    • Click Filter to add a where clause for your Page URL for sessions A and B.
  • Measured as: Formula %:SESSIONTOTALS(A)/SESSIONTOTALS(B).

  • Segmented by: All users.

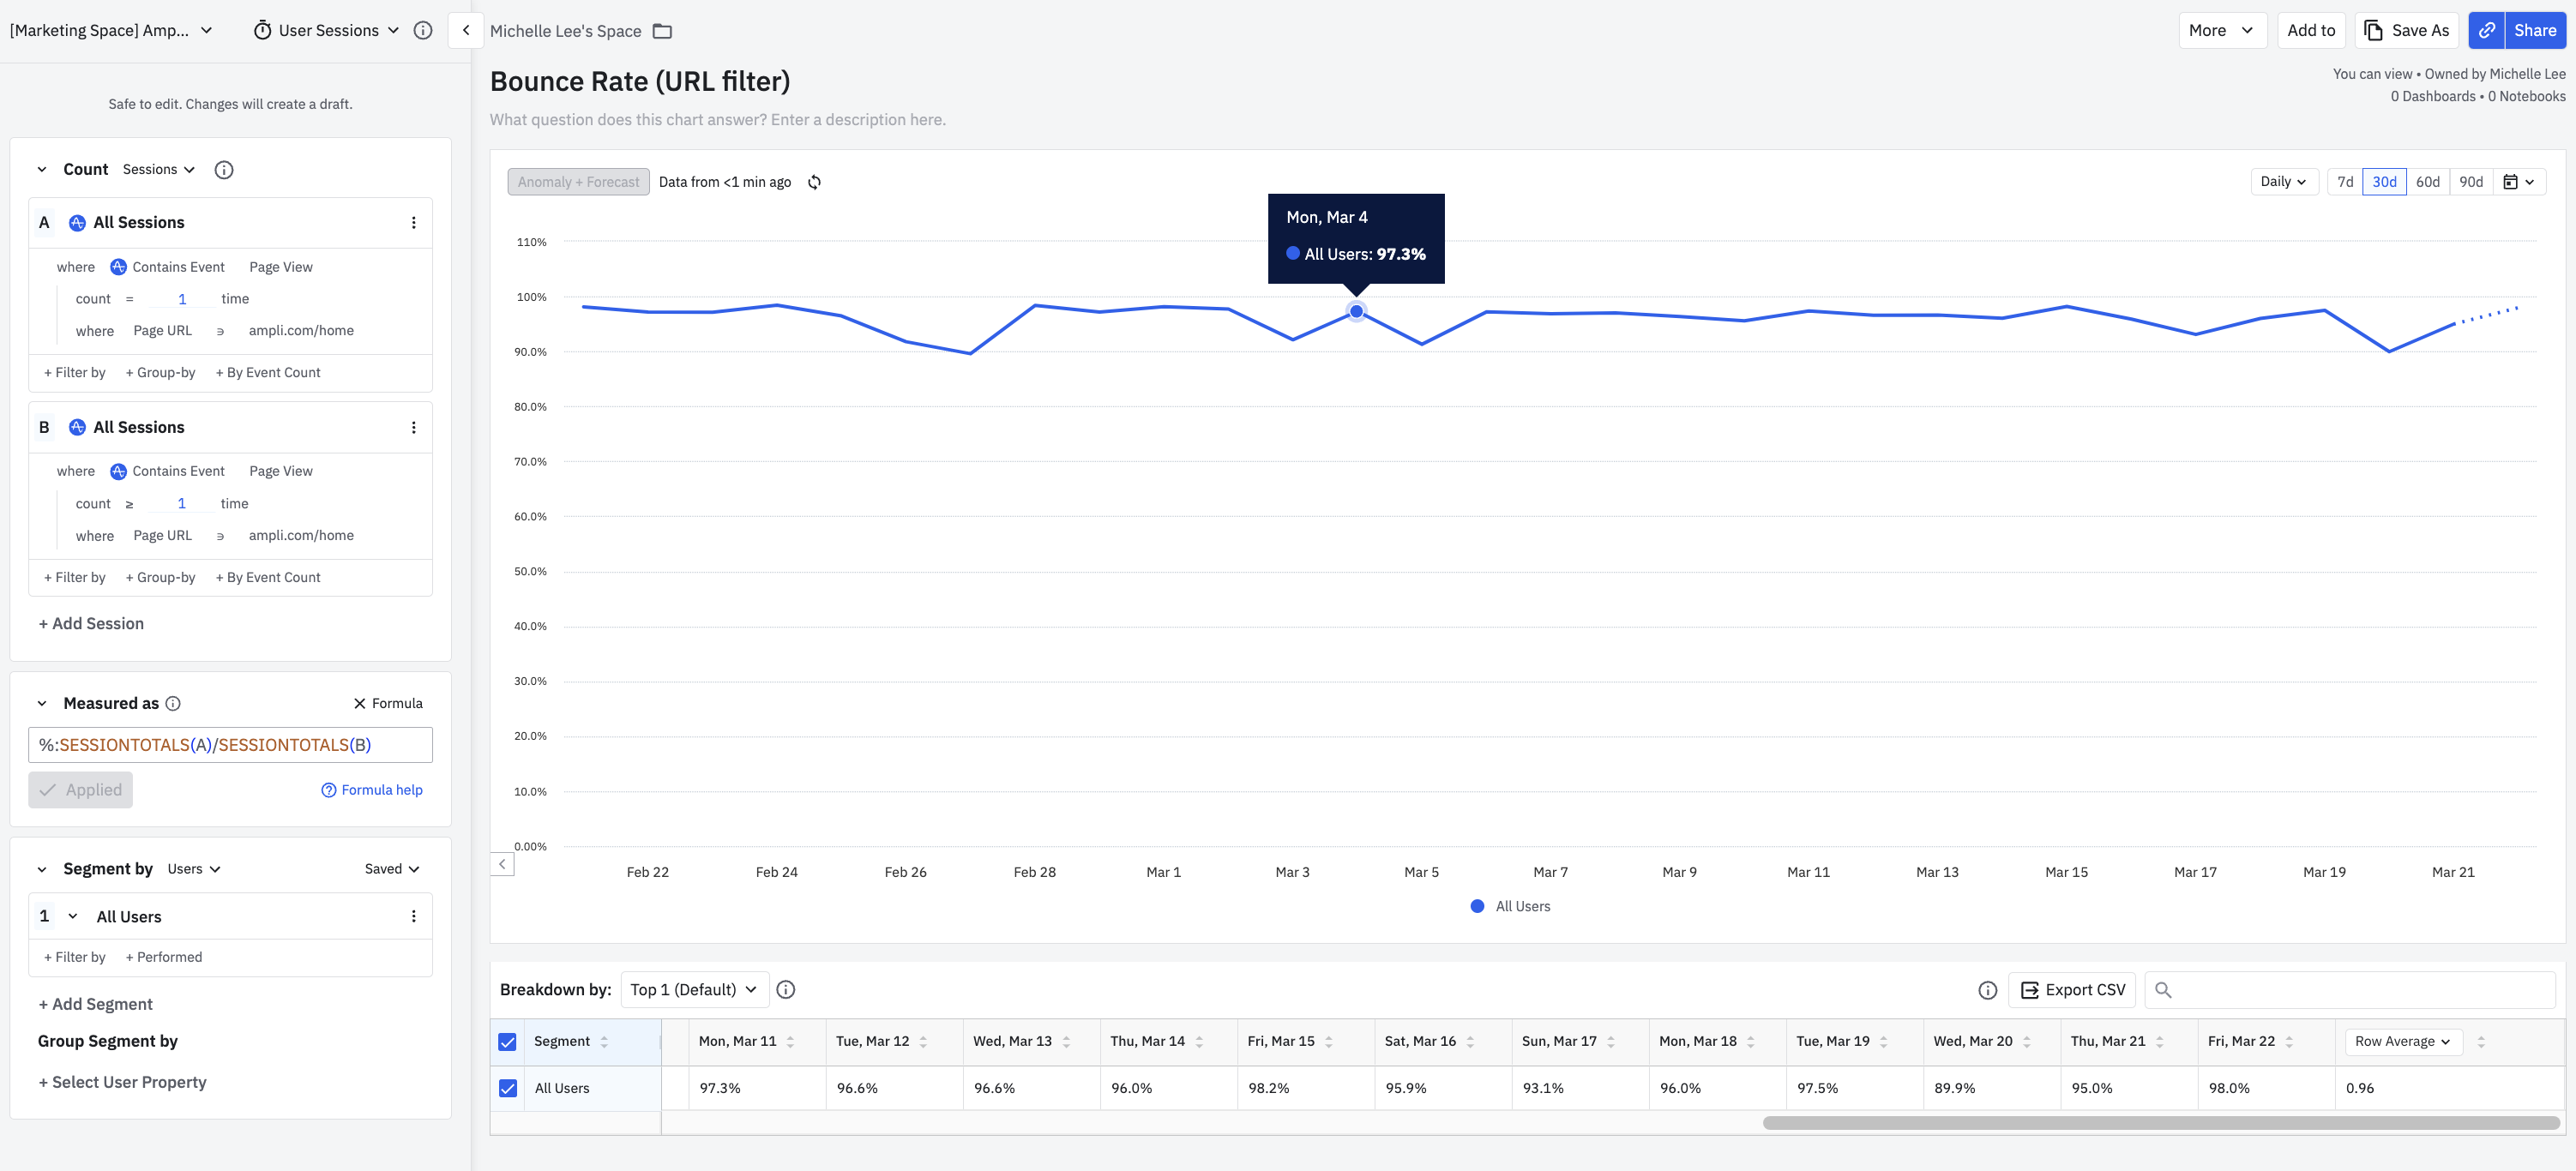
This User Sessions chart calculates the 30-day bounce rate for the Page URL ampli.com/home. The bounce rate for March 4th was 97.3 percent.

The bounce rate for ampli.com/home hovers in the low-to-high 90s across the month, reaching 97.3% on March 4.
30-day bounce rate for ampli.com/home
DateAll Users
2026년 2월 21일96.9
2026년 2월 22일98.1
2026년 2월 23일96.7
2026년 2월 24일97
2026년 2월 25일97.6
2026년 2월 26일98.2
2026년 2월 27일97.4
2026년 2월 28일90.2
2026년 3월 1일98
2026년 3월 2일97.3
2026년 3월 3일93
2026년 3월 4일97.3
2026년 3월 5일91.2
2026년 3월 6일96.8
2026년 3월 7일97.6
2026년 3월 8일96.9
2026년 3월 9일95.4
2026년 3월 10일97.1
2026년 3월 11일97.3
2026년 3월 12일96.6
2026년 3월 13일96.6
2026년 3월 14일96
2026년 3월 15일98.2
2026년 3월 16일95.9
2026년 3월 17일93.1
2026년 3월 18일96
2026년 3월 19일97.5
2026년 3월 20일89.9
2026년 3월 21일95
2026년 3월 22일98

The chart plots the daily bounce rate for ampli.com/home over 30 days, where bounce rate is the share of sessions that contain exactly one Page View. The line stays in the low-to-high 90s all month and peaks at 97.3 percent on March 4, so almost every session that reaches this page views only that page and leaves. A rate this high and this flat flags a landing page worth investigating. The dashed tail marks the most recent day, whose data is still provisional.

Entry rate

The entry rate metric compares sessions with a Page View event grouped by the first property value of the specified event property to the total number of sessions, as a percentage.

Use the following setup for each module in your User Sessions chart to create the entry rate metric:

  • Sessions: Count sessions.
    • A: All sessions.
      • Grouped by the First Property Value of the Page View event property Page Title.
    • B: All sessions.

To filter results by a specific domain or URL of sessions A and B:

  • Click Filter by and choose Contains Event. Search for the Page Viewed event. Set the count to greater than or equal to one.

    • Click Filter to add a where clause for your Page URL.
  • Measured as: Formula %:SESSIONTOTALS(A)/SESSIONTOTALS(B).

  • Segmented by: All users.

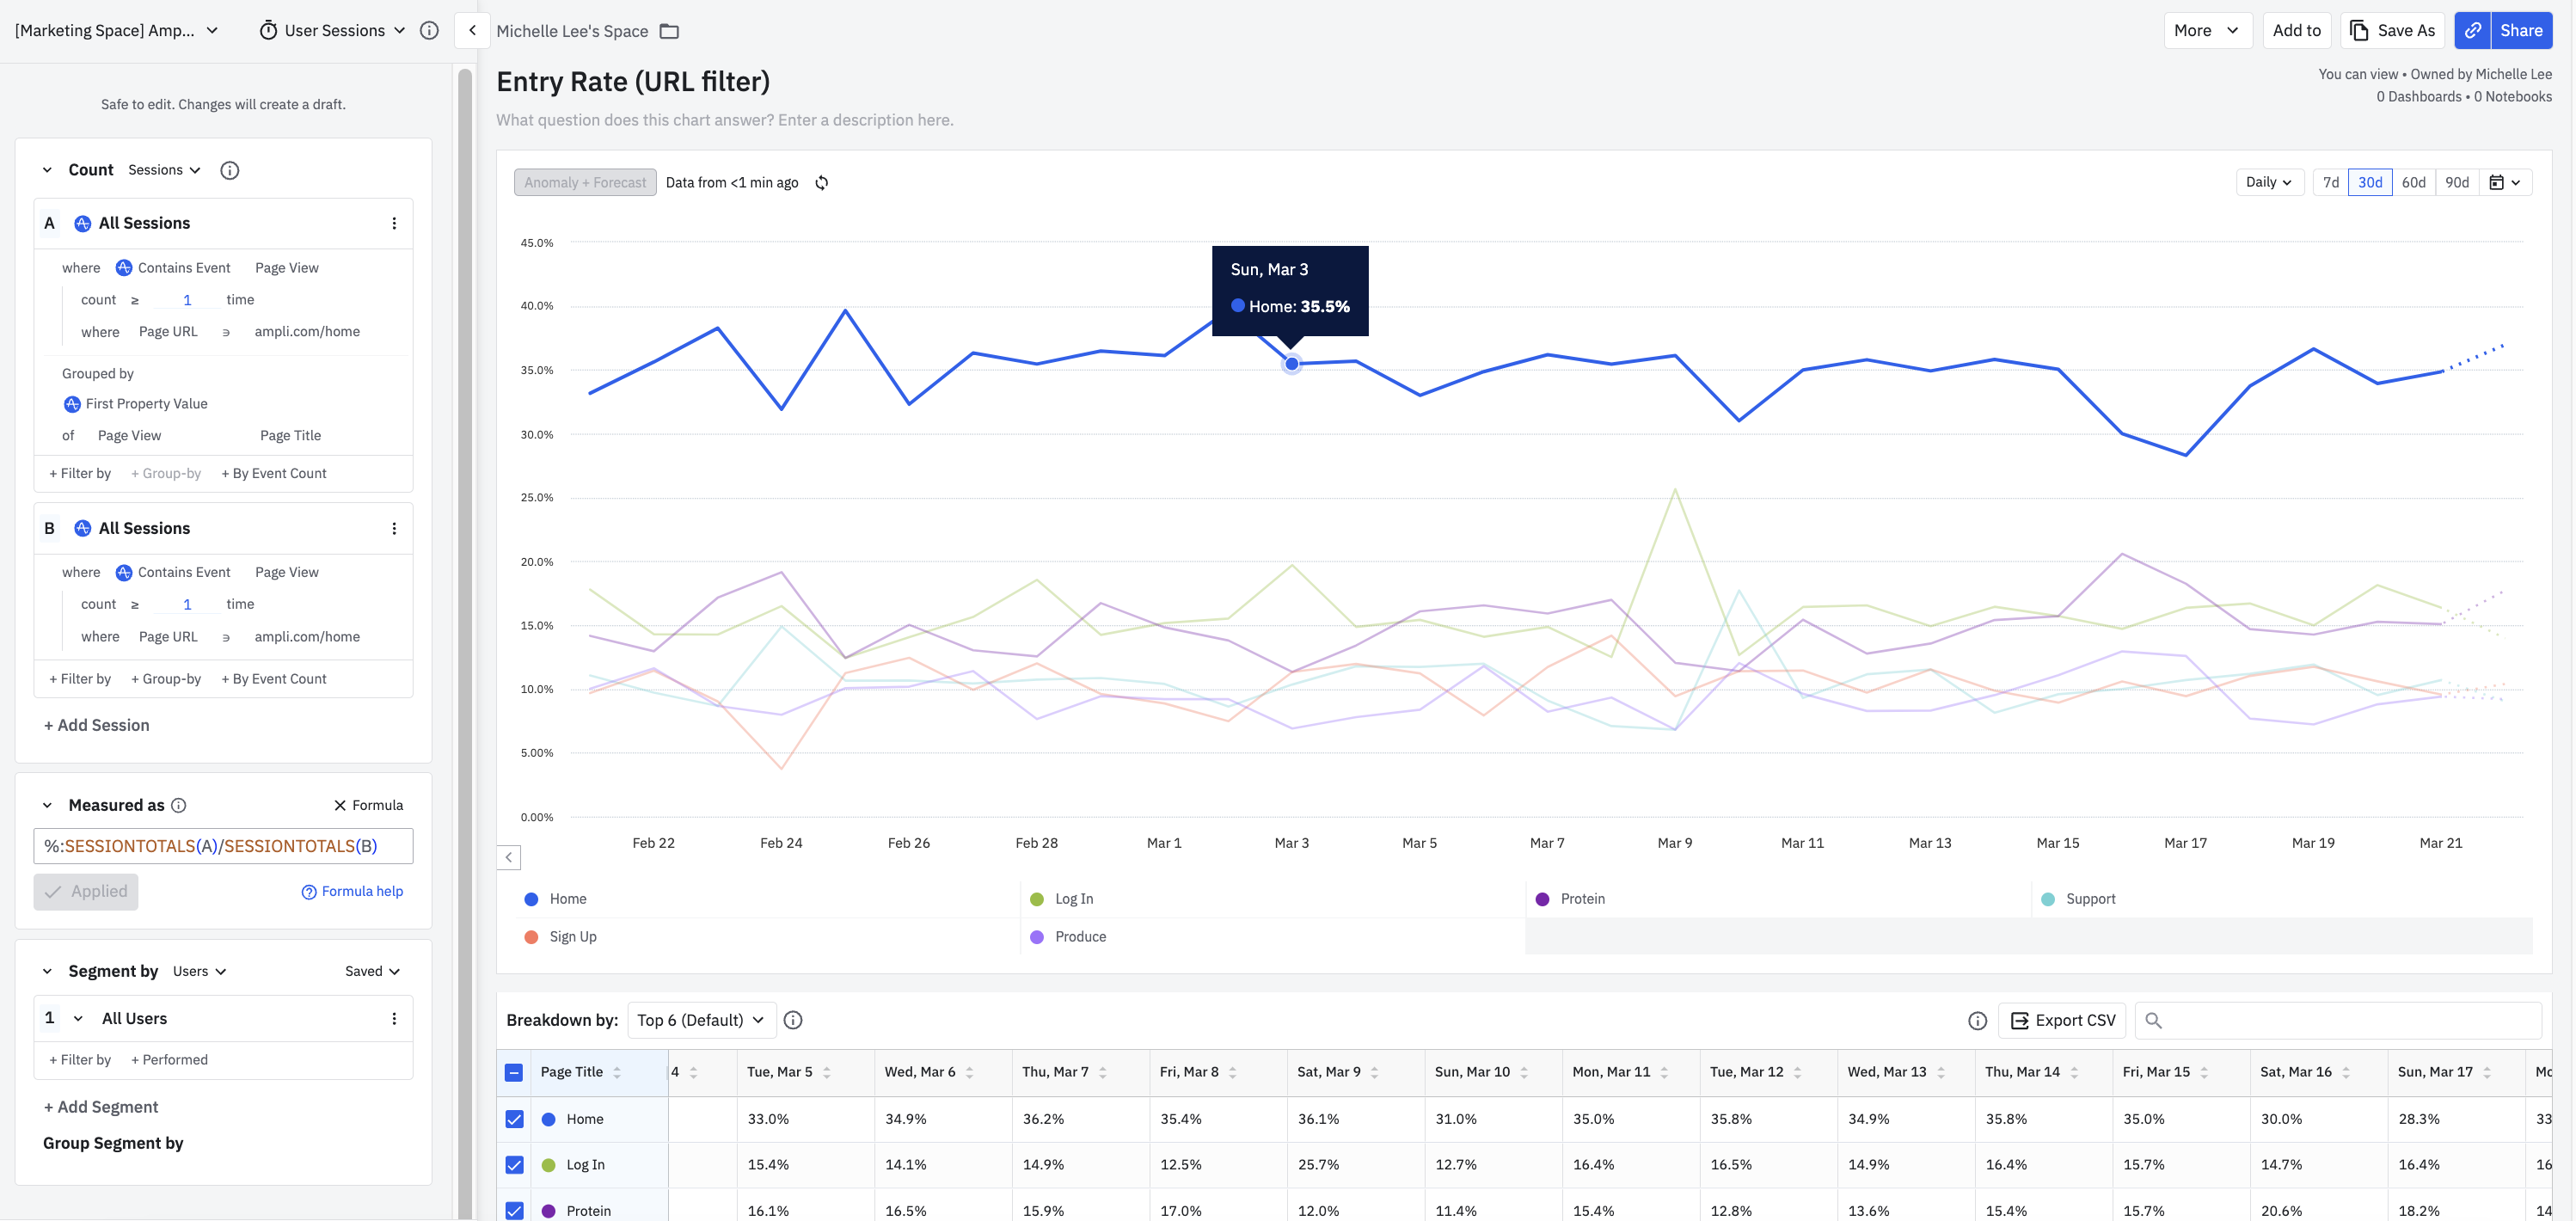
This User Sessions chart calculates the 30-day entry rate for the Page URL ampli.com/home. The chart's group-by property value Page Title appears as different colored lines in the chart. The entry rate for March 3rd was 35.5 percent for the Home property value.

Entry rate by page title for ampli.com/home. Home leads at about 30–40% throughout, reaching 35.5% on March 3; the other five page titles sit lower, mostly between 8% and 20%.
30-day entry rate by page for ampli.com/home
DateHomeLog InProteinSupportSign UpProduce
2026년 2월 21일33.513.514.210.511.216
2026년 2월 22일33.415.416.1141011
2026년 2월 23일38.214.115.511.59.512.5
2026년 2월 24일39.714.91410414
2026년 2월 25일3212.513.214.81213.5
2026년 2월 26일3615159.510.512
2026년 2월 27일38.613.816.810.2814.5
2026년 2월 28일32.314.51289.513
2026년 3월 1일36.315.215.59.511.512.5
2026년 3월 2일35.414.81610.51011.5
2026년 3월 3일35.51516.2109.812
2026년 3월 4일3315.416.111.510.513.5
2026년 3월 5일34.914.116.510.8914
2026년 3월 6일36.214.915.99.58.513.5
2026년 3월 7일35.412.517111012
2026년 3월 8일36.125.71210.5711.5
2026년 3월 9일3112.711.48.59.512.5
2026년 3월 10일3516.415.41210.513
2026년 3월 11일35.816.512.810.5914.5
2026년 3월 12일34.914.913.69.81113.5
2026년 3월 13일35.816.415.411.210.212
2026년 3월 14일3515.715.7109.512.5
2026년 3월 15일3014.720.69.58.812
2026년 3월 16일28.316.418.28.81013
2026년 3월 17일3315.9151011.514
2026년 3월 18일35.514.814.511.59.520.5
2026년 3월 19일34.815.51610.21015
2026년 3월 20일34.114.215.29.58.513.5
2026년 3월 21일36.51514.810.89.812.5
2026년 3월 22일3714.515.51010.513

Each line shows the entry rate for one page title, meaning the share of sessions that begin on that page. Home leads throughout at roughly 30 to 40 percent, reaching 35.5 percent on March 3, while the other five page titles sit well below it. Read together, the lines confirm that Home is where most sessions start.

Exit rate

The exit rate metric compares sessions with a Page View event grouped by the last property value of the specified event property to the total number of sessions, as a percentage.

Use the following setup for each module in your User Sessions chart to create the exit rate metric:

  • Sessions: Count sessions.
    • A: All sessions.
      • Grouped by the Last Property Value of the Page View event property Page Title.
    • B: All sessions.

To filter results by a specific domain or URL of sessions A and B:

  • Click Filter by and choose Contains Event. Search for the Page Viewed event. Set the count to greater than or equal to one.

    • Click Filter to add a where clause for your Page URL.
  • Measured as: Formula %:SESSIONTOTALS(A)/SESSIONTOTALS(B).

  • Segmented by: All users.

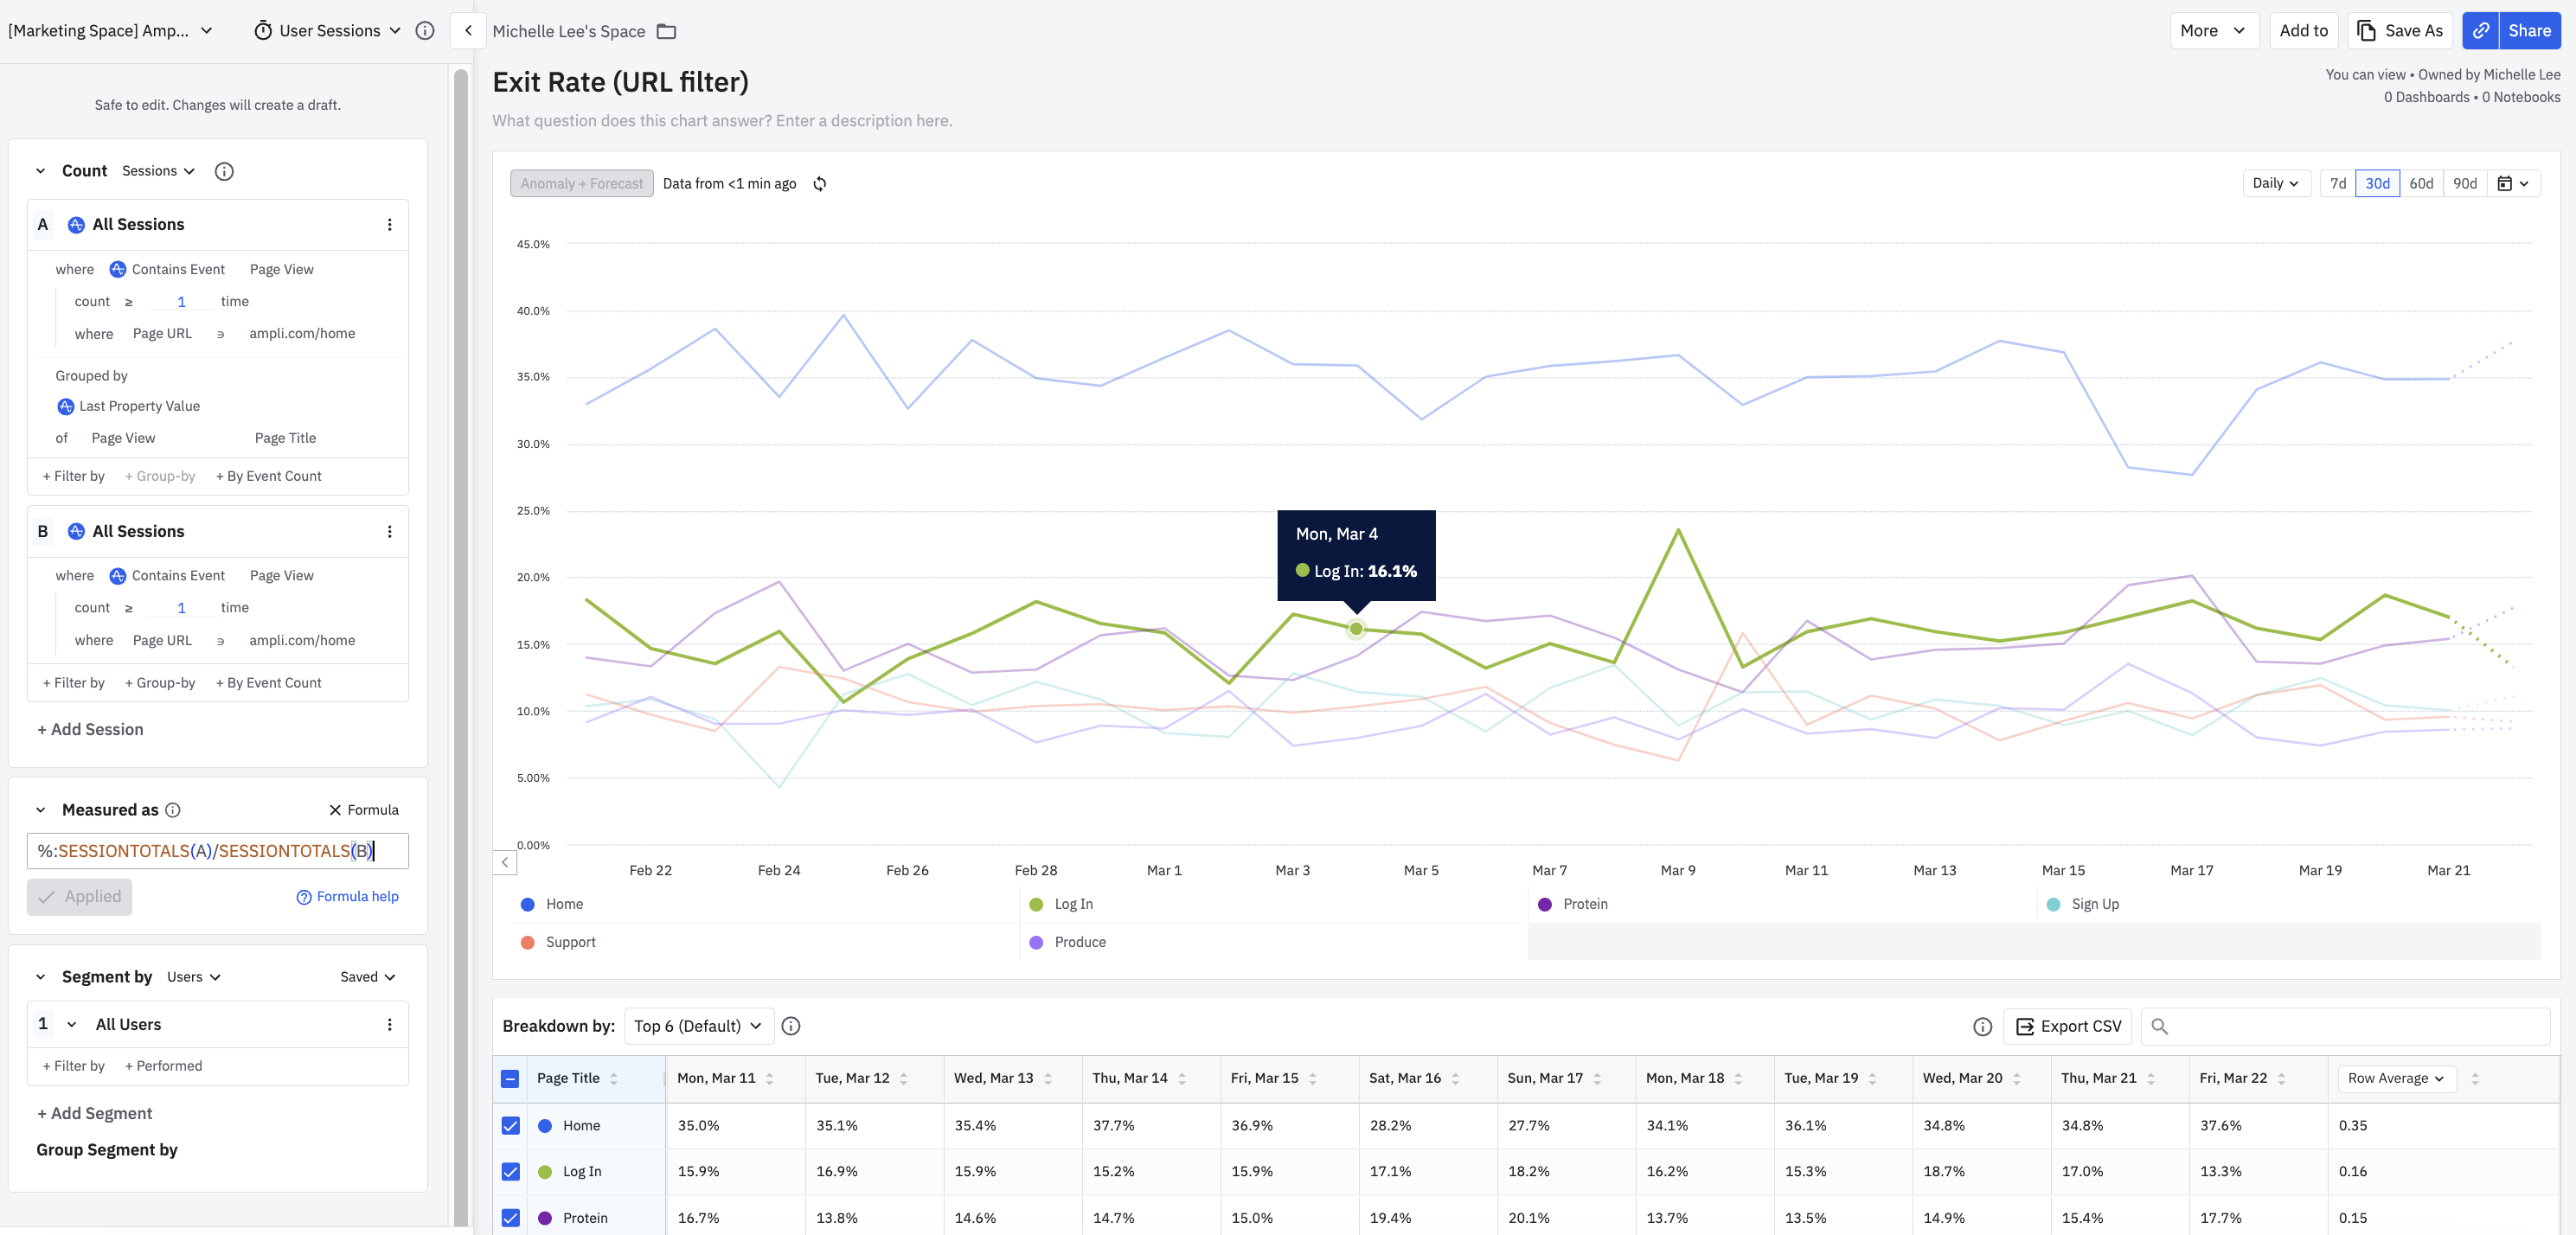
This User Sessions chart calculates the 30-day exit rate for the Page URL ampli.com/home. The chart's group-by property value Page Title appears as different colored lines in the chart. The exit rate for March 4th was 16.1 percent for the Log In property value.

Exit rate by page title for ampli.com/home. Home leads at about 30–40% throughout; Log In sits around 15–18% and is 16.1% on March 4, with the remaining page titles mostly between 6% and 20%.
30-day exit rate by page for ampli.com/home
DateHomeLog InProteinSupportSign UpProduce
2026년 2월 21일34161410.59.512
2026년 2월 22일3315.815.511.51110.5
2026년 2월 23일38.514.519.89.5811.5
2026년 2월 24일391616104.512
2026년 2월 25일3415.213.5131010
2026년 2월 26일39.815.9159.511.511.5
2026년 2월 27일32.516.514.5119.512.5
2026년 2월 28일3614.8138.58.510
2026년 3월 1일3815.515.510.51011
2026년 3월 2일36.516.216111112
2026년 3월 3일3615.814.5109.510.5
2026년 3월 4일35.516.11511.510.511.5
2026년 3월 5일34.515.516.510.5912
2026년 3월 6일36.516.8149.58.510.5
2026년 3월 7일38.51513.51110.511
2026년 3월 8일3416.21510119.5
2026년 3월 9일3313.812.58.56.510.5
2026년 3월 10일3615.915.511.59.511
2026년 3월 11일3515.916.710.51010.5
2026년 3월 12일35.116.913.89.811.511.5
2026년 3월 13일35.415.914.6119.510
2026년 3월 14일37.715.214.710.51011
2026년 3월 15일36.915.9159.58.510.5
2026년 3월 16일28.217.119.4129.59.5
2026년 3월 17일27.718.220.111.51111
2026년 3월 18일34.116.213.710612
2026년 3월 19일36.115.313.59.510.510.5
2026년 3월 20일34.818.714.91199
2026년 3월 21일34.81715.410.51011.5
2026년 3월 22일37.613.317.7109.510

Each line shows the exit rate for one page title, meaning the share of sessions that end on that page. Home carries the highest exit share, while Log In sits around 15 to 18 percent and reaches 16.1 percent on March 4. Compare a page's entry rate against its exit rate to see where sessions start versus where they drop off: a page that ranks high in both, like Home, both opens and closes many sessions.

Performance marketing metrics

Amplitude supports several common performance marketing metrics. Create these metrics by following the recipes in this section.

Ad network clicks

  • Metric type: Formula.
  • Event: Daily ad metric.
  • Grouped by: ad_metrics.clicks.
  • Formula: PROPSUM(A).

Ad network impressions

  • Metric type: Formula.
  • Event: Daily ad metric.
  • Grouped by: ad_metrics.impressions.
  • Formula: PROPSUM(A).

Ad network costs

  • Metric type: Formula.
  • Event: Daily ad metric.
  • Grouped by: ad_metrics.costs.
  • Formula: PROPSUM(A).

Return on ad spending

  • Metric type: Formula.
  • Event A: Complete purchase.
    • Grouped by: Revenue.
  • Event B: Daily ad metric.
    • Grouped by: ad_metrics.cost.
  • Formula: %: PROPSUM(A) / PROPSUM(B).

Customer acquisition cost

  • Metric type: Formula.
  • Event A: Daily ad metric.
    • Grouped by: ad_metrics.cost.
  • Event B: User Sign Up.
  • Formula: $: PROPSUM(A) / TOTALS(B).

Clickthrough rate

  • Metric type: Formula.
  • Event A: Daily ad metric.
    • Grouped by: ad_metrics.impressions.
  • Event B: Daily ad metric.
    • Grouped by: ad_metrics.clicks.
  • Formula: %: PROPSUM(A) / PROPSUM(B).

이 내용이 도움이 되었나요?