Putting a number on AI quality
How The Economist Group used Amplitude Agent Analytics to move their agent Lens from sampled reviews to measurable AI quality, reaching 96.9% task success and cutting weekly task failures by 84%.

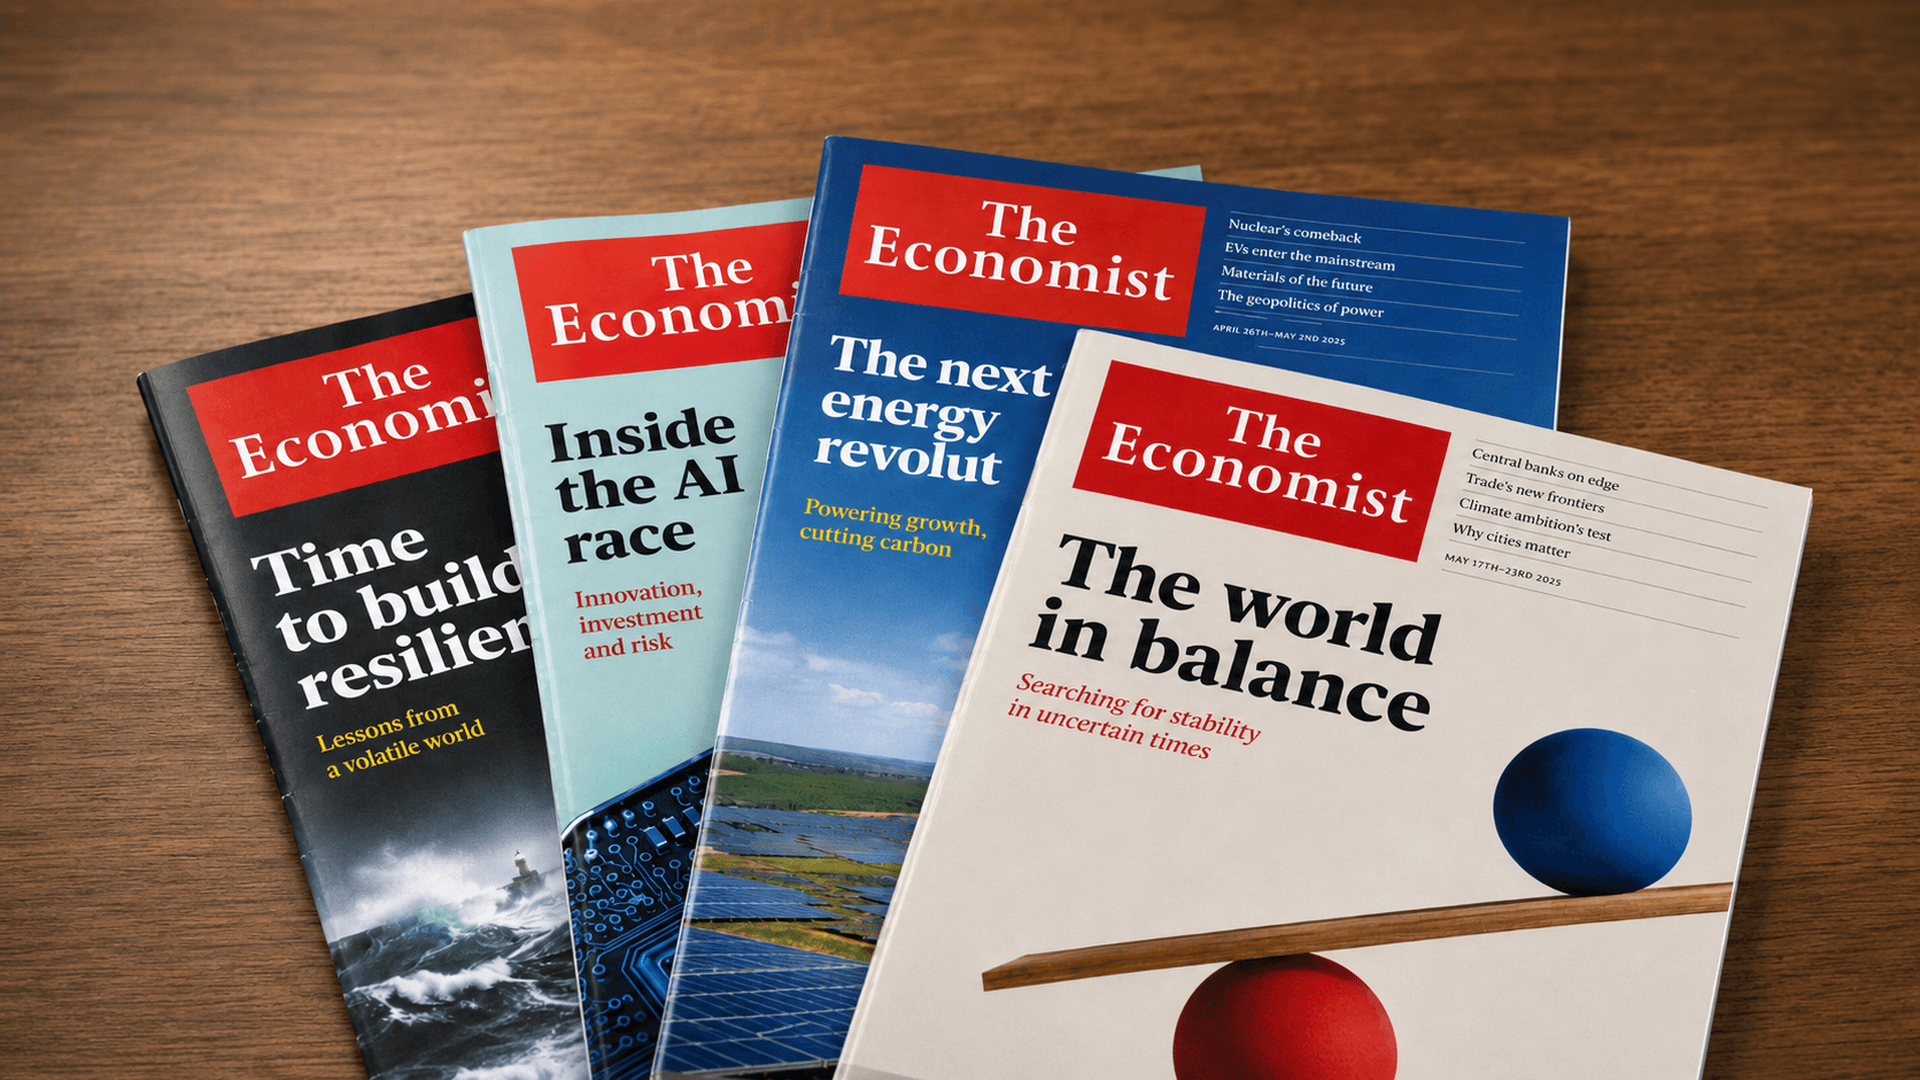
The Economist Group is best known for its newspaper that has existed since 1843. In 1946, the Economist Intelligence Unit was set up to answer questions Economist readers were asking. Today EIU helps businesses, financial firms and governments to understand how the world is changing and how that creates opportunities to be seized and risks to be managed. EIU’s team of analysts cover nearly every country in the world with analysis, forecasts and indicators to back decisions. They create a lot of content. And data. It can be hard to navigate.
Enter Lens. In March, we added the multi-turn AI research assistant Lens to Viewpoint, EIU’s website. It allows our analyst, strategist, and risk customers to, for example, ask about the fiscal outlook or compare political risk across the five biggest economies in South America and get an answer sourced entirely from EIU content.
Getting Lens to a good enough quality was hard work. We worked with our analysts on evaluations. We went back and forth until we were happy. By the time we launched, we knew Lens was good. But a feature in the wild is a different beast and pinpointing the areas to improve was the next challenge.
From sessions to signal
Product analytics showed us what users did. It couldn't tell us whether the AI answer was any good. A user who asked three questions in a session might have been getting excellent answers and going deeper. Or they might have been rephrasing the same question because the first two answers were wrong. The data looked the same either way. We opened sessions and read them. But not fast enough to act on it. First impressions matter.
Lens sessions landed into Amplitude Agent Analytics with signals attached out of the box: intent classification, outcome tracking, quality scores. Getting there took one engineer and some back and forth, but once it was running, reading a trace stopped being archaeology. I could open a session, see each turn, see what the agent retrieved and how it responded, and see how it scored.
Before that, our data insights lead, our platform engineers and I were drawing conclusions from handfuls of sessions. A few examples, a hunch. Now we're looking at the same evidence across all of them.
Filtering by behavior
The capability I lean on most is addictive. Pull every session matching a behavioral signal and drill in.
Early on, Agent Analytics' request complexity classification surfaced a concern about how Lens handled ambiguous questions. I filtered to those sessions, found two areas that worried me, and we now track both programmatically. That whole loop, from hunch to confirmed pattern to standing metric, took an afternoon.
It also catches things that look like problems and are not. Around half of our session outcomes were labelled "Clarification Requested," which initially read as a defect. Drilling in showed the agent was ending answers with a follow-up question, a deliberate design choice. But when we looked at what users did next, the pattern was clear enough. They weren't going deeper, they were going elsewhere. We tweaked the prompt. Without the ability to interrogate the label, we might have spent a sprint fixing behavior that was working as intended.
A scorecard instead of a vibe
We all know AI outputs are inherently non-deterministic, which is a long way of saying that viewing a handful of sessions and calling it quality assurance doesn't scale. We wanted a number.
Amplitude's standard signals gave us a floor on day one. Custom evals let us go further, scoring sessions against our own definition of good, including rubrics built from ground-truth Q&A pairs our analysts wrote.
By Amplitude's measure, Lens now holds a 96.9% task success rate, and weekly task failures fell 84% as we worked through the issues the data surfaced. Those gains came from ordinary engineering. The measurement is what tells us where to point it.
Evals alone tell you whether an answer was correct. Quality signals connected to real product usage tell you whether the product is getting better at its job.
What comes next
Agent interactions in Amplitude arrive as decomposed events, the same shape as any other product event. That opens the door we care most about, connecting Lens quality to engagement across Viewpoint as a whole. Does a strong Lens experience deepen how teams use the platform?As we add structured data and chart visualisation to Lens, and as other parts of The Economist Group explore whether the architecture fits their own products, that connected view is how we will judge the work.
None of this is about watching individual users. It is about holding our AI products to the same standard of evidence we hold our analysis to. Our clients pay us for rigor. The tools we use to improve their experience should have some too.

Fionn O'Raghallaigh
AI Group Product Manager, The Economist
Fionn leads AI product at the Economist Intelligence Unit. Before moving into product, he was a journalist. Knowing what makes an answer trustworthy, useful and worth someone's time turns out to be good preparation for building AI products.
More from FionnRecommended Reading

Lessons from consolidating our MCP server
Oct 6, 2026
10 min read

What AI engineers do in the age of agentic code
Oct 1, 2026
14 min read

An analysis of Jev: Faster and cheaper, but watch the accuracy
Sep 28, 2026
13 min read

Your agent isn’t broken. It’s guessing.
Sep 23, 2026
6 min read