
Benchmark your product
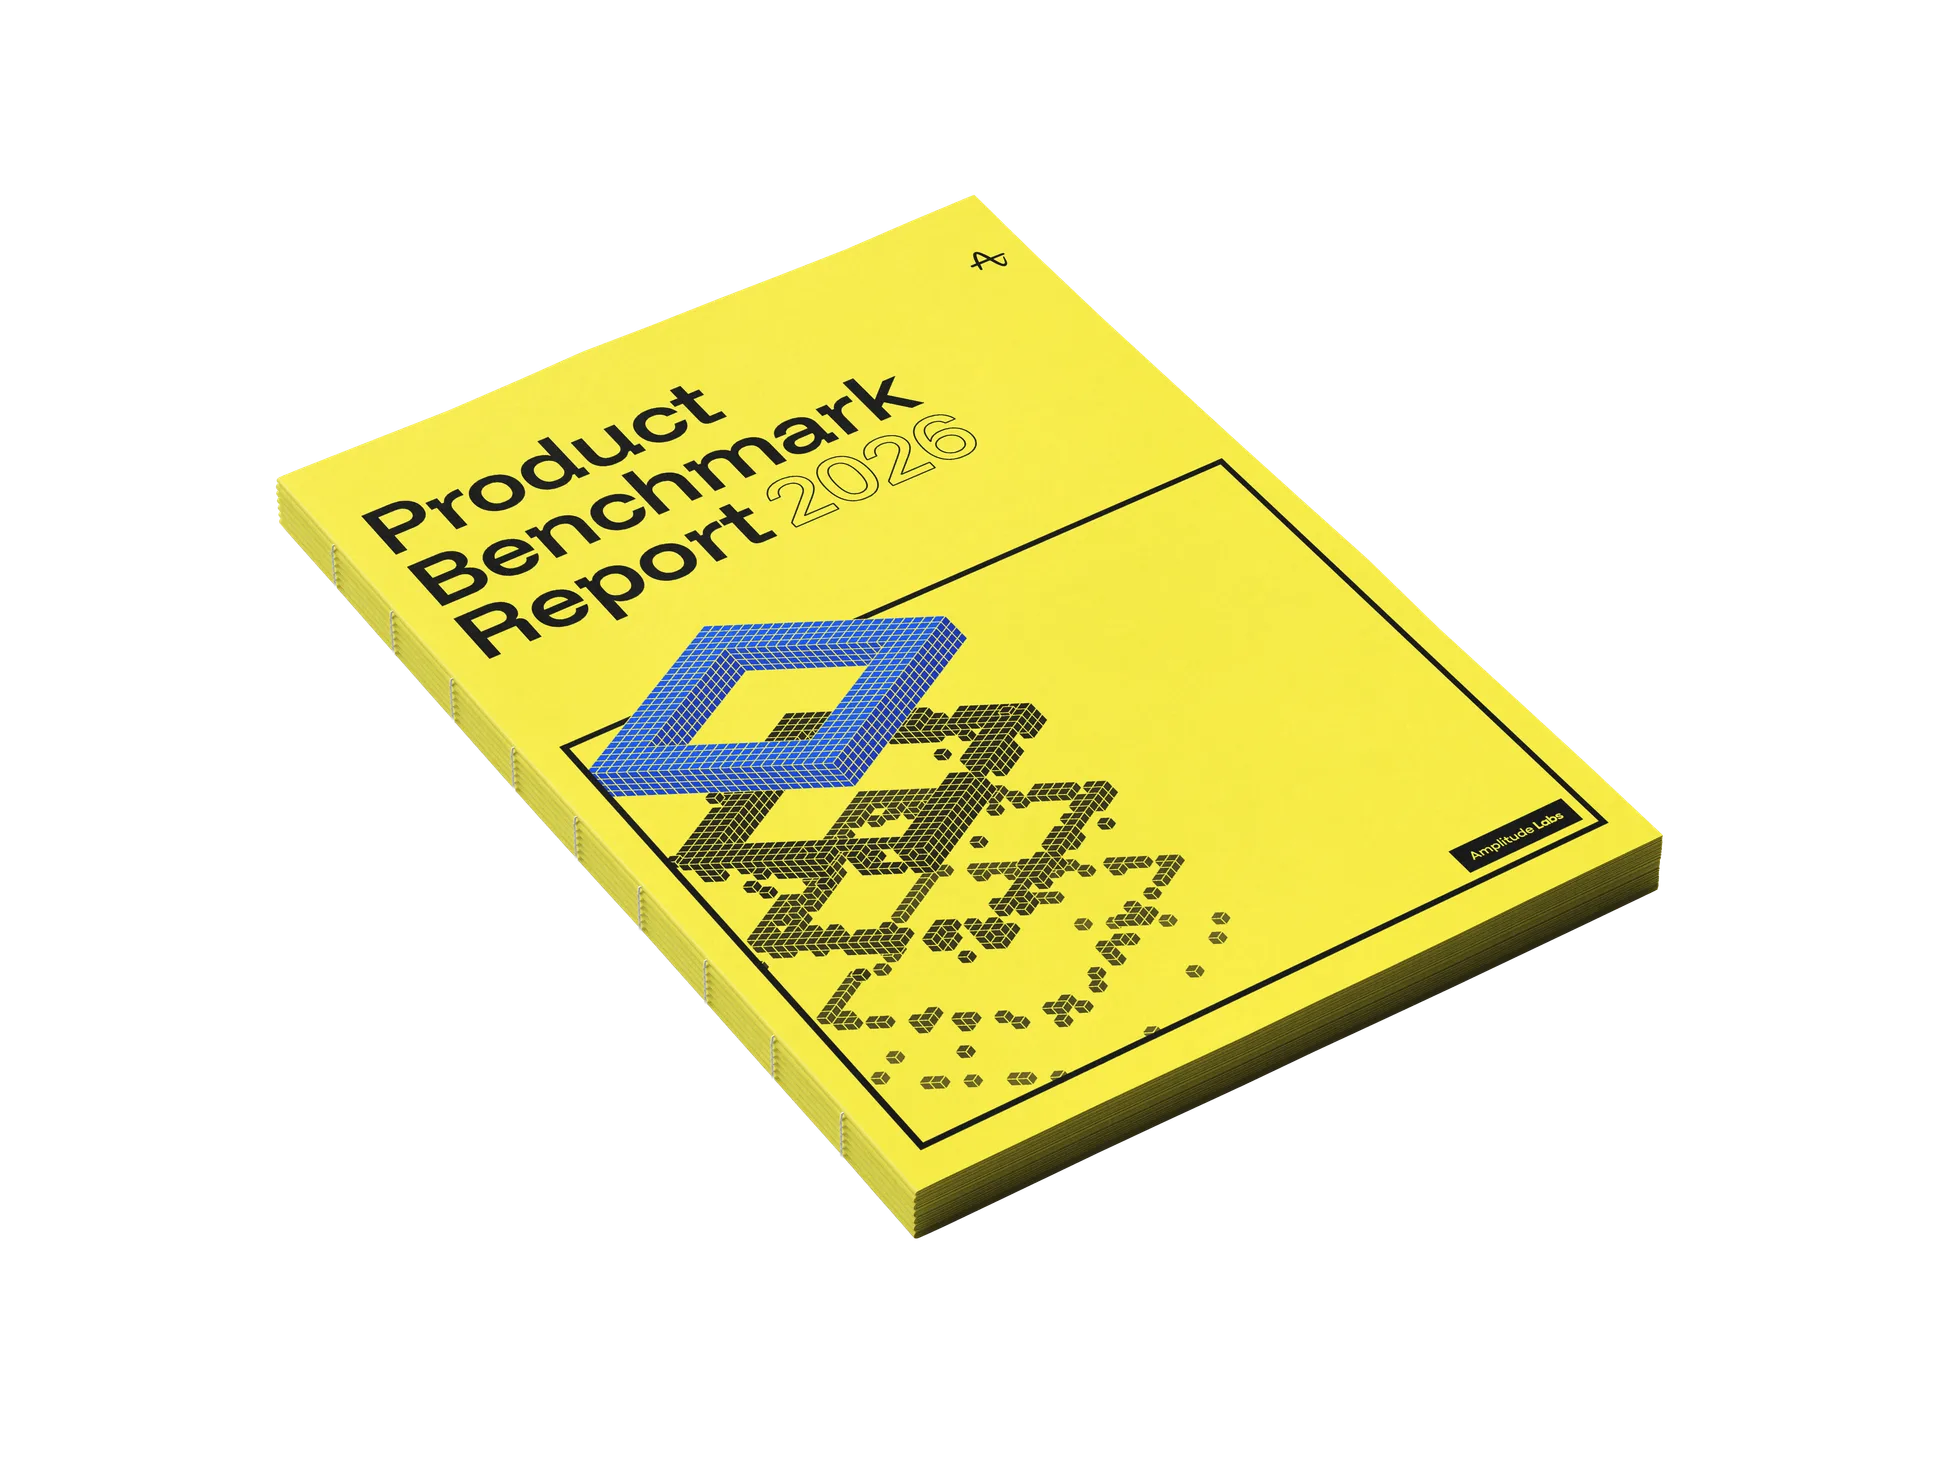
Getting users through the door is only the start. The products pulling ahead are helping users find early value. Explore benchmark data from more than 2,500 companies to see how your product stacks up.
Get the full report
How fast are products adding new users?
Acquisition measures the change in new users coming to a product over time. Compare daily, weekly, and monthly growth to see how quickly your product adds new users.
Acquisition
New-user growth rates
| Percentile | Daily | Weekly | Monthly |
|---|---|---|---|
| Median · P50 | 0.43% | 0.36% | 0.44% |
| Top 25% · P75 | 5.13% | 4.86% | 4.68% |
| Top 10% · P90 | 11.54% | 10.46% | 10.32% |
How quickly do users find a reason to return?
Activation measures the percentage of new users who return on a specific day after their first visit. Compare days 1, 7, and 14 to see how quickly products turn a first visit into lasting value.
Activation
Activation on days 1, 7, and 14
| Percentile | Day 1 | Day 7 | Day 14 |
|---|---|---|---|
| Median · P50 | 4.33% | 1.95% | 1.29% |
| Top 25% · P75 | 11.09% | 5.59% | 3.81% |
| Top 10% · P90 | 20.79% | 12.38% | 8.90% |
Is the active user base growing?
Engagement measures the change in active users over time. Compare daily, weekly, and monthly growth to see whether products are building a larger base of active users.
Engagement
Active-user growth rates
| Percentile | Daily | Weekly | Monthly |
|---|---|---|---|
| Median · P50 | 0.70% | 0.45% | 0.64% |
| Top 25% · P75 | 4.68% | 4.40% | 4.17% |
| Top 10% · P90 | 10.84% | 9.51% | 9.24% |
How many users keep coming back?
Retention measures the percentage of users who return in a given month after their first visit. Compare months 1, 2, and 3 to see how quickly retention falls and how far the strongest products pull ahead.
Retention
Retention in months 1, 2, and 3
| Percentile | Month 1 | Month 2 | Month 3 |
|---|---|---|---|
| Median · P50 | 5.57% | 3.89% | 3.11% |
| Top 25% · P75 | 13.02% | 9.65% | 8.19% |
| Top 10% · P90 | 25.08% | 19.65% | 17.58% |
See what sets top products apart
Get the Product Benchmark report for the findings behind the data.
Frequently Asked Questions
Our benchmark analysis relies on Amplitude’s behavioral database and a robust statistical methodology.
We anonymized performance and engagement data from over 2,500 companies across industries, regions, and company sizes. We excluded data from customers who have opted out of this benchmarking.
To ensure data accuracy, we ran rigorous data quality checks, avoided imputation, and applied z-score-based local baseline methods to remove outliers.