Amplitude Study Finds that “N Day” Retention Metric Underestimates the Percentage of Users who Return to Apps by a Factor of 3.5X
Amplitude today released findings from a study of retention data collected from its popular analytics platform and found that the most commonly used retention metric, known as ‘N Day,’ underestimates the percentage of users who return to apps over time by a factor of 3.5x. The results, which were collected from 500 million mobile devices over a four month period earlier this year, call into question the value of one of the industry’s most popular retention metrics and the importance that companies should place on it as they plan business, product and marketing strategies. The company also announced that its platform recently passed the “1 trillion user actions tracked” mark and is now processing over 100 billion user actions every month.
Previously announced retention rates have painted a grim picture for mobile app companies who have been blindly led by ‘N Day’ results to believe that they’re losing nearly all of their users within 30 days. Our study found that measuring retention over periods of the user’s lifecycle, rather than on single, arbitrarily chosen days, provides a more useful measure of user retention for most apps.
Why ‘N Day’ Falls Short
The issue is that ‘N Day’ retention only measures the percentage of users who return exactly on a specific day post-install; a better approach would be to calculate the percentage of users who return within a certain time period using a method called ‘bracket retention.’ While ‘N day’ retention is an appropriate metric for apps that have very high daily usage patterns, like successful casual games or social apps, most apps aren’t intended for use every single day. Using the ‘bracket retention’ method, we found:
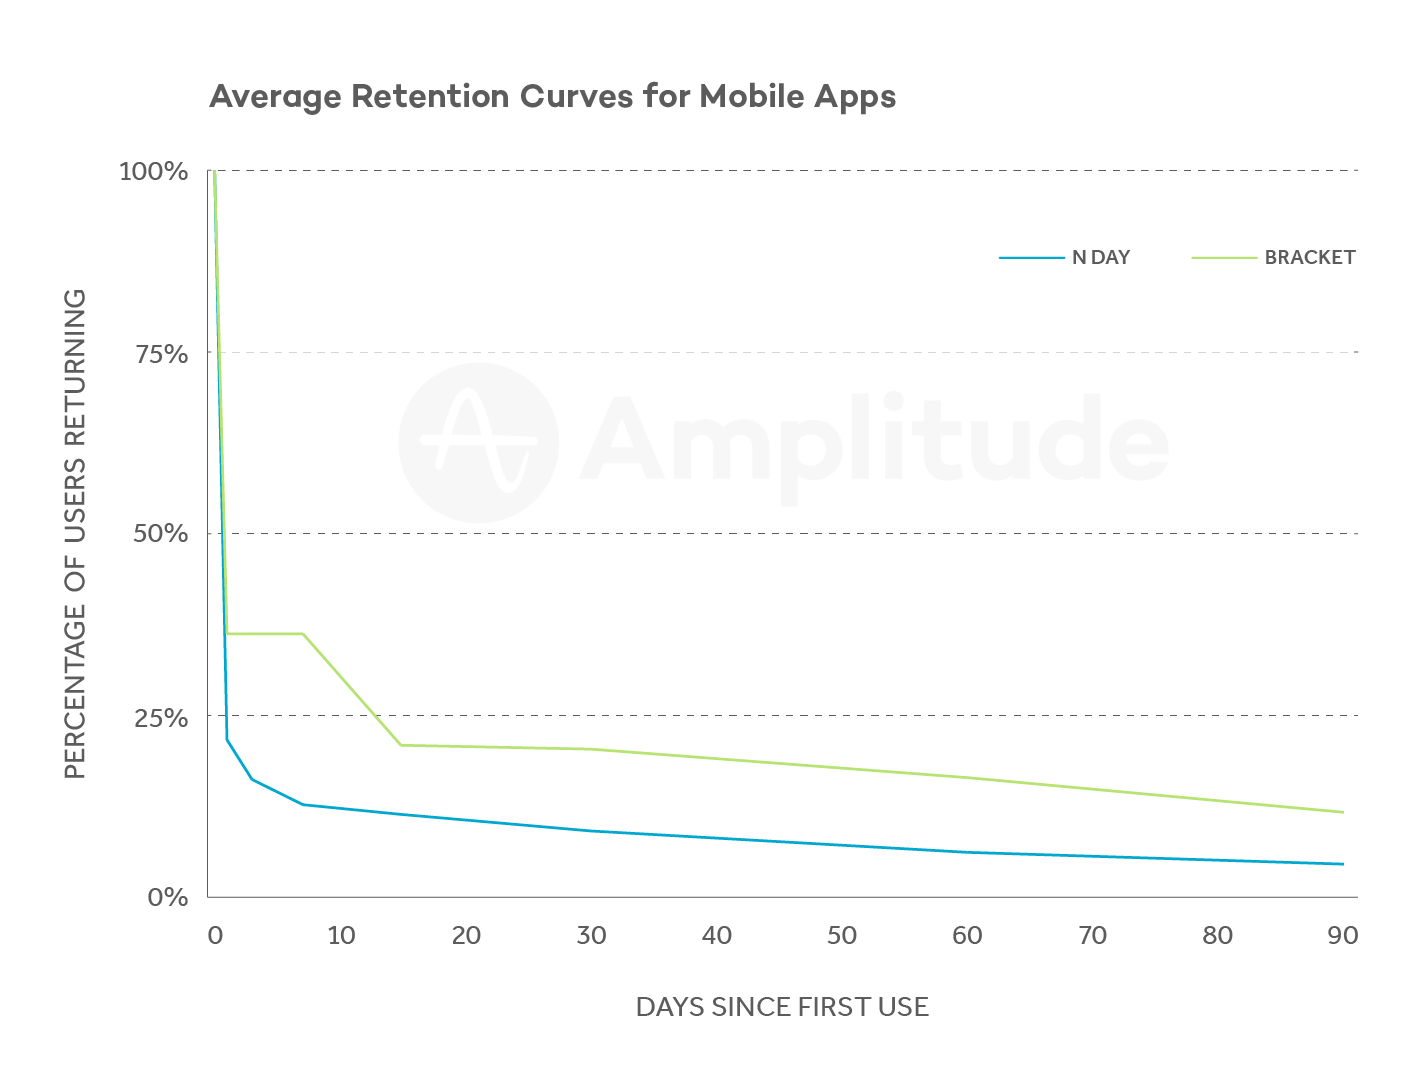
- As detailed in the chart below, retention rates were 1.5 to 3.5X higher than industry averages reported using ‘N day’ retention.
- Twenty-three (23%) of mobile app users return between days 15-30 after first use and 20% returned between days 31-60. When looking at the same data set using ‘N Day’ retention, we found that only 8% of users returned on Day 30 and only about 6% on Day 60.
“The ‘N Day’ retention metric might make sense for 1% of app companies, like Facebook and Snapchat, who have exceptionally large numbers of users who are active daily, ” said Spenser Skates, CEO of Amplitude. “But for the other 99%, it’s a false indicator of how well users are retained over time. Companies need to make sure their retention metrics reflect the way people use their product; otherwise, they’re making decisions with the wrong data. Only our analytics platforms provides custom ‘bracket retention,’ allowing companies to customize retention metrics for their unique situation.”
Pinterest’s John Egan agreed with the importance of custom retention metrics. “If your site or app is truly visited on a daily basis, measuring ‘N Day’ retention makes sense. Because this isn’t the case for most, companies need to choose retention metrics that fit their product,” said Egan, an engineering manager for Growth on the company’s Notifications Team. “For example, at Pinterest, our key retention metric is the Day 1 – 7 bracket. We also care about retention for the Day 28 – 35 bracket, to track what percentage of our users are still returning five weeks later. The time windows for retention that you care about will vary depending on your product.”
Introducing Amplitude 2.0
Amplitude also announced the release of Amplitude 2.0, the next generation of their analytics platform. Amplitude 2.0 represents a significant step in the evolution of data analytics; it enables anyone at a company, regardless of analytics experience, to explore, learn and act on insights. Amplitude completely rebuilt the user experience, focusing on making charts easier to interpret, reducing the time to insight, and adding collaboration features, including a new integration with Slack that facilitates sharing and discussing insights. Users can share Charts, Dashboards and Cohorts in Slack, which automatically transform into an image preview and details about the analysis. Dozens of customers, including MINDBODY, LogMeIn, and Postmates, have been using Amplitude 2.0 during a closed beta period.
Methodology
Amplitude based the results of this study on retention data collected from its platform, which recently surpassed 1 trillion user actions tracked. The study looked at user activity that took place across 500 million mobile devices over a four month period between June-September of this year. The study included apps with monthly active user counts ranging from thousands to tens of millions of users and from a range of verticals like social, gaming, on-demand, e-commerce, business, and financial apps. We compared both methods using time periods commonly used by the industry; ‘N Day’ (Day 0, 1, 3, 7, 14, 30, 60, 90) and ‘Bracket’ (*Day 0, 1-7, 8-14, 15-30, 31-60, 61-90) and both iOS and Android devices were included.