MySwimPro increased experiments by 10X, boosting ARPU by 70%
When MySwimPro transitioned from using Google Analytics to Amplitude Analytics and Experiment, they gained more granular insights and faster experimentation.

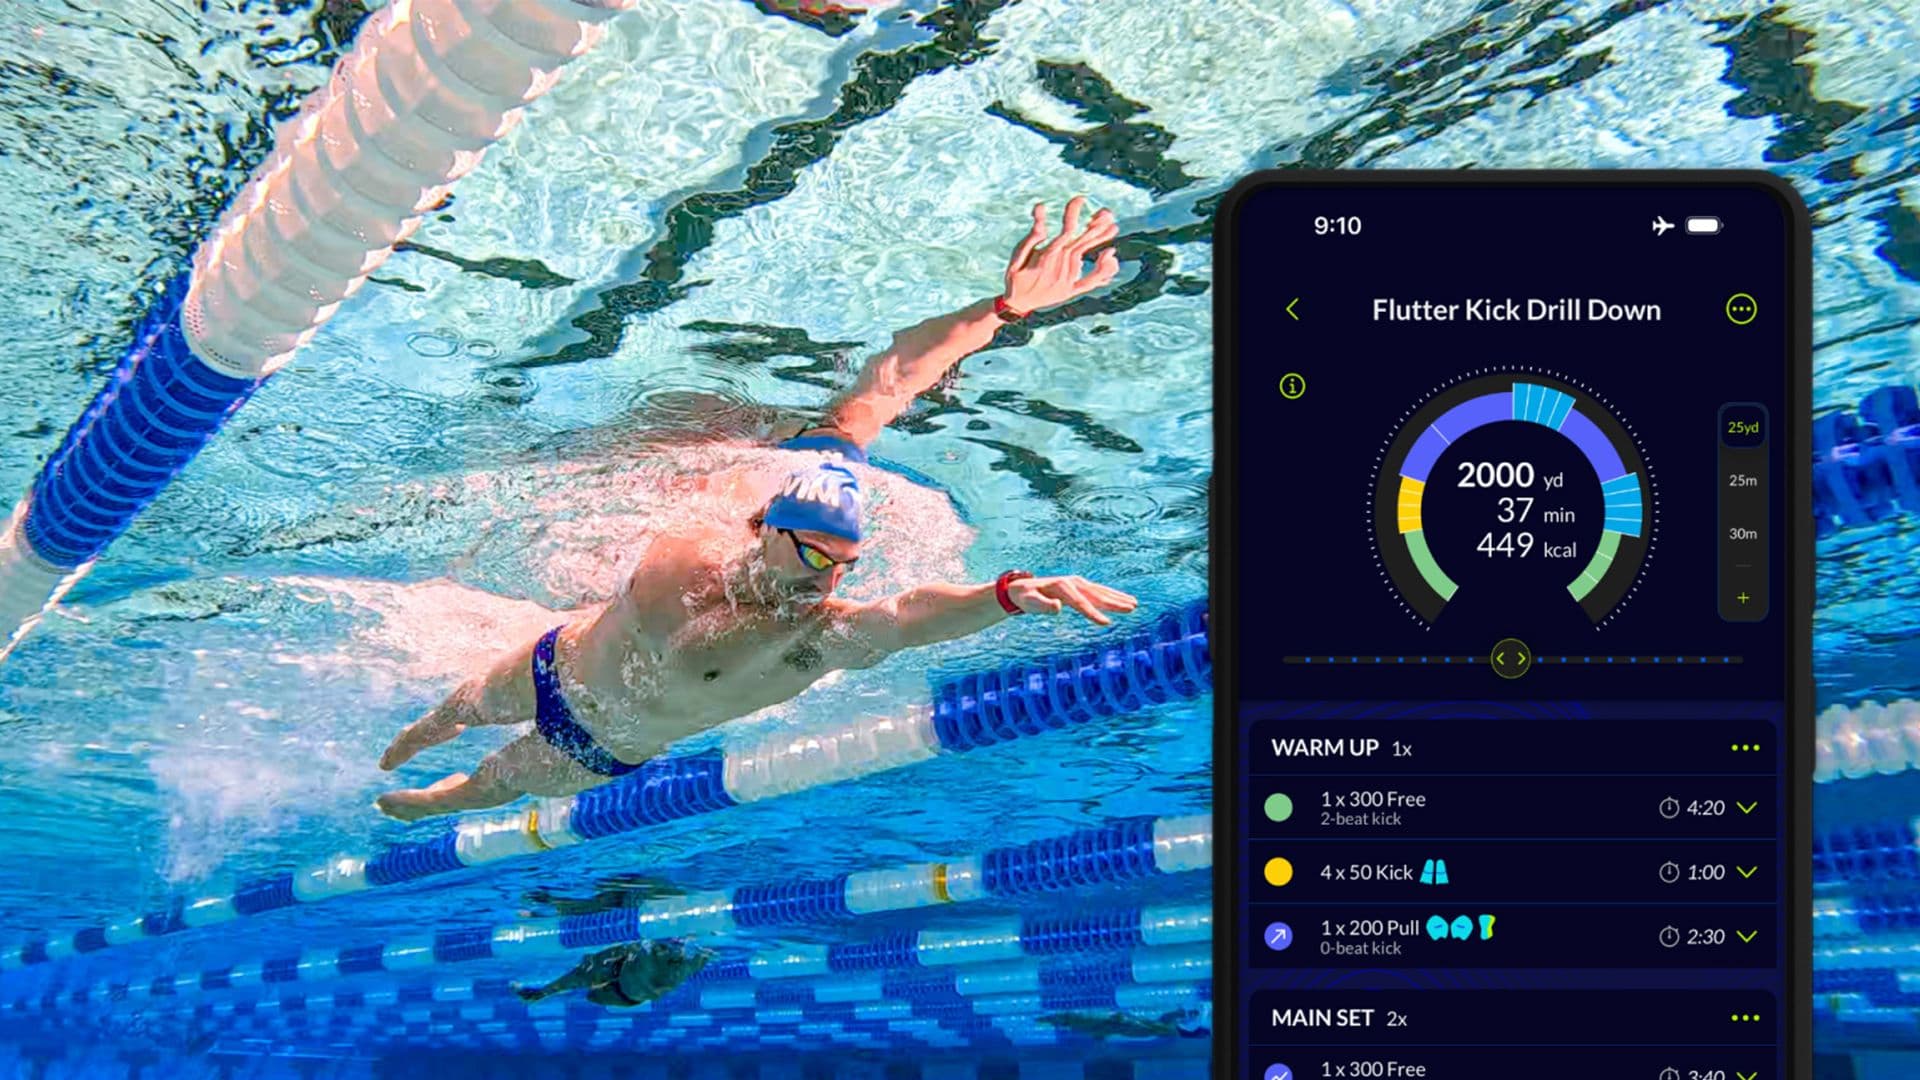
Insight/Action/Outcome: In their first month using Analytics, MySwimPro rebuilt their onboarding funnel and discovered an 80% drop-off after users created an account. They dug deeper and found an error affecting users who signed up through social media logins. The team fixed the error, reducing the drop-off rate from 80% to 20%.
Sometimes, all it takes to spur change is to see something from a fresh perspective. I love to innovate, and after working at a large corporate organization for 17 years, I was ready for something different. I entered the world of tech startups as VP of engineering at MySwimPro, a personalized swim coaching and tracking app that helps swimmers improve on everything from beginner basics to race training.
I’ve climbed 32 of Colorado’s 58 14ers (mountains over 14,000 feet in elevation), but being at altitude is a very different experience than being underwater, where sounds are muted, objects are blurred, and movement meets resistance. I had no serious swimming experience, but I dove into my new surroundings (pun intended).
I lead the engineering, product, and design (EPD) team, bringing some focus, discipline, and processes to help get projects across the finish line. The rest of our company handles marketing and produces some of the best swim content around.
Centralizing experimentation and analytics
The company founders launched MySwimPro in 2015, but by 2021, we had hit a growth ceiling. Experimentation can lead to more growth, but many experiments fail, so if you spend two months on an experiment that doesn’t move the needle, you’re in trouble. At our rate of experimentation, we couldn’t make an impact fast enough to push the number of paying subscribers higher.
We also didn’t have the insights we needed to make meaningful changes. MySwimPro previously used Google Analytics, but the platform didn’t have the capability to drill down to the granularity of individual users. Without the ability to look at an individual’s event stream, we couldn’t fully flesh out user personas. Once the team decided Google Analytics wasn’t offering enough, they built a custom data pipeline using open-source, off-the-shelf tools. It was expensive, and our small team struggled to maintain and manage it.
The main problem we were trying to solve was speed, and by bringing analytics and experiments into a single system, I was confident we could experiment, iterate, and improve faster.
I knew we wouldn’t grow any faster without bringing in a new product. We scoured the market for platforms and landed on the Amplitude product suite. We mainly selected Amplitude because of its built-in experimentation platform, Amplitude Experiment. Experiment offered seamless access to our data in a centralized location, allowing us to experiment faster. In addition, Amplitude Analytics would give MySwimPro the ability to view user behavior on a granular level.
The main problem we were trying to solve was speed, and by bringing analytics and experiments into a single system, I was confident we could experiment, iterate, and improve faster.
Accelerating experimentation to increase ARPU by 70%
The good news is that I was right: Experiment has wildly changed MySwimPro’s experimentation process. In the quarter before adopting Experiment, we ran two A/B tests. The following quarter, we ran five. And the quarter after we adopted Experiment, we ran 19 A/B tests—almost a 10X increase from our previous cadence.
To clarify, we didn’t wait for statistical significance on every one of those 19 tests—we don’t have millions of subscribers, so it could take us a long time to reach that point. But because of our size, we can take some calculated risks. Seeing how results are trending in Experiment and monitoring metrics like the long-term value and average revenue per user help us make educated decisions about product choices and act on them.
Taking more risks and moving faster means we also see more rewards. In two months, we ran three experiments around monetization and pricing that led to 70%, 53%, and 39% increases in average revenue per user (ARPU), respectively. Before using Experiment, I would have said a 70% increase in revenue based on a single experiment was impossible, especially for a company that’s been around for several years. But the numbers speak for themselves.
We’ve had great success with Experiment, but generally, 75% of our tests have failed. It’s like Michael Jordan said, “I’ve failed over and over and over again in my life. And that is why I succeed.” That quote couldn’t be more appropriate for experimentation: You have to go through a ton of failure to find success.
We’ve grown more comfortable trying things and failing, and there’s great value in failing fast. Our team went from failing in two months to failing in two weeks, and we’re trying to get to the point where we fail in two days. We no longer have to waste time going down the wrong path.
The balance of speed and quality
Speed may be a top priority for the company, but as an engineer, quality comes first. Moving fast comes with the risk of reduced quality, and we have to find a balance between the two. We use two metrics to measure quality in engineering: the change failure rate, which measures the frequency of issues following a new deployment, and mean time to restore, which is how long it takes us to fix something when we break it.
Being able to monitor feature releases and changes in Analytics helped decrease our change failure rate from 30% to 6% and reduce our mean time to restore from 30 days to two days. We can now look at specific member reports within minutes, which saves the team a ton of time investigating bugs. I had hoped to see improved quality due to using Analytics, but we’ve been pleasantly surprised at the magnitude of the impact.
Simple charts can reveal big areas for improvement
While Experiment was the driving force behind adopting Amplitude, Analytics surfaces options to improve the member experience. We will eventually use the Pathfinder feature to identify aggregated user flows, but we already achieved some solid results from using the basic funnel and segmentation charts.
One example involves the gaps in our onboarding funnel, which we had rebuilt in Analytics with trackable events every step of the way. We discovered a point in the funnel after where our member numbers dropped through the floor—specifically, an 80% drop off right after a member creates an account.
Our initial assumption was that there was too much friction around creating an account. However, we dug deeper and saw that members who signed up using a social account didn’t go through the onboarding flow at all—they came into the app without direction. We had spent months perfecting this onboarding funnel, and 80% of our members weren’t even going through it! Once we saw what was happening, we fixed the issue, and our drop-off rate improved from 80% to 20%.
After realizing our homegrown solution was too much work to manage, MySwimPro briefly returned to Google Analytics. I knew about Amplitude, but at the time, I was concerned about having too much data and losing focus. In hindsight, I should have gone to Amplitude in the first place. The silver bullet for us was finding our focus. There’s no need to worry about having too much data when you first identify the key KPIs and personas to prioritize.
Improved trust, quality, and communication
Everybody at MySwimPro now has access to Amplitude. The engineering, product, and design (EPD) team spends the most time on it, though our CEO uses it at least weekly, and our CTO uses it daily. I look at A/B test results daily to make growth decisions. We’ve encouraged adoption through activities like Lunch and Learns, where my CTO or our backend engineer will guide everyone through building dashboards or understanding charts. We also have a weekly data deep dive, where we review and discuss an insight from Analytics at our all-hands meeting.
Before, nobody at MySwimPro had complete confidence in our data because it was in multiple places. It wasn’t deep or thorough enough for folks to understand, so even when we did extract a key insight, people didn’t trust it. One of our values is diversity in perspective, and now that more people see the data firsthand, the entire company has gained a new perspective on our product and trust in our process.
Better collaboration and communication
In addition to all the insights gained through Amplitude solutions, we’ve also seen a positive culture change at MySwimPro. Now, we don’t spend time arguing or trying to convince one another which direction to take. We just experiment and follow the data, which has given us a bias toward action. I’ve been in engineering for almost 20 years, and I’ve seen a lot of places and teams where the loudest voice wins. I admit, I have sometimes been that voice! With Amplitude, the data wins the argument.
I’ve seen a lot of places and teams where the loudest voice wins [...] with Amplitude, the data wins the argument.
Adopting Analytics has improved our communication with MySwimPro members, too. We’re a swim-coaching platform; if we can’t communicate well to coach effectively, we lose half our value proposition. Having all the data in one place makes it much easier to use a dataset to personalize communication to members using our communication platform, Braze.
The EPD team has the data to justify changes, and increased trust has changed the relationship dynamics at MySwimPro. Amplitude has allowed us to move fastest to create a better product for more people.

Nick Newell
VP of Engineering, MySwimPro
Nick Newell is the VP of Engineering at MySwimPro. He is a passionate leader and disciplined software engineering executive who loves to innovate and has a fierce resolve to win while also seeking continuous improvement through retrospection and constant self-awareness.
More from NickRecommended Reading

Lessons from consolidating our MCP server
Oct 6, 2026
10 min read

What AI engineers do in the age of agentic code
Oct 1, 2026
14 min read

An analysis of Jev: Faster and cheaper, but watch the accuracy
Sep 28, 2026
13 min read

Your agent isn’t broken. It’s guessing.
Sep 23, 2026
6 min read
Explore Related Content
9 Top Feature Flag Solutions for Modern Product Teams in 2026
Jan 27, 2026
Using behavioral analytics for growth with the Amplitude app on HubSpot
Jun 17, 2024
10 min read
Identity resolution: The secret to a 360-degree customer view
Feb 16, 2024
10 min read
Inside warehouse-native Amplitude: A technical deep dive
Jun 27, 2023
15 min read
5 Proven Strategies to Boost Customer Engagement
Jul 12, 2023
Designing High-Impact Experiments
May 13, 2024
9 direct-to-consumer marketing tactics to accelerate ecommerce growth
Feb 20, 2024
10 min read
Leveraging analytics to achieve product-market fit
Jul 20, 2023
10 min read