AMPLITUDE LABS
2022 App vs. Website Trend Report
What’s growing faster: apps or websites? Data from Amplitude’s Behavioral Graph shows exactly where usage is taking off—and where businesses should invest—across products and industries.


Key Takeaways
Data from Amplitude Labs reveals that:
- App usage grew 36% from January 2020 to December 2021 while website usage grew 57% during that same time period.
- While there are more users on apps overall, the surge of website activity over the past two years has brought the two channels closer to an even split: by December 2021, 54% of users were on apps and 46% of users were on websites.
- This data shows how critical it is for business leaders to prioritize both the app and the website in the holistic customer journey. With the right investments, websites can function like apps—as products that drive growth, engagement, and revenue.
- NOTABLE NUMBERS:
- Food ordering app usage grew 164% since January 2020, faster than any other industry in the analysis.
- By December 2021, 77% of all end users accessing banking products were doing so via mobile apps—the highest percentage of app use among industries.
- The highest percentage of web use is found among B2B SaaS tools: by December 2021, 88% of users accessing B2B SaaS products were doing so via websites.
Methodology
How Amplitude Prepared This Report
In this report, we leverage Amplitude data to showcase trends that are representative of the state of digital products across regions and industries. Data about global trends are based on anonymized, aggregated data sent to Amplitude between January 1, 2020 and December 31, 2021.
In this report, we only include products that were using Amplitude before January 2020. Data about industry trends is based on monthly active users (MAUs): a measure of the total number of unique users active on a product at any point within that month. Any commentary about percentage growth is based on analyses with a minimum threshold of users, products and data points for comparison, so as to ensure that outliers or small sample sets do not skew findings. The same user may be counted in both app and web statistics if they have accessed both within the same month. In our report, website data includes users who accessed websites via desktops or mobile devices. App data is limited to users who accessed apps via mobile devices.
Why Trust Us?
As the #1 product analytics solution, Amplitude has an unparalleled view into the trends shaping digital product adoption, in-product behavior, and how digital products are driving strategies in a digital-first world. Our data spans thousands of digital products and almost 1,600 companies worldwide. Our Behavioral Graph—including 900 billion+ data points tracked every month—provides an expansive view into digital activity and behavioral analytics. Although our dataset does not span every device, user and product around the globe, we believe these insights are indicative of larger movements and moments in our ever-growing digital world.
Introduction
It’s not "app or web." The customer journey surfs both.
Product-led growth is about elevating the digital experience of your product in pursuit of higher customer value, engagement, and retention. Done right, product-led growth (PLG) turns your product experience into a revenue stream.
When your company first embarks on a PLG initiative, the immediate efforts might go to your company’s app. After all: shouldn’t the product that lives in your customer’s pocket be the top candidate for digital optimization?
Not always so.
Exclusive Amplitude data shows that websites are just as important as apps when it comes to the full customer experience. In some industries, the growth of website users even outpaces that of apps.
To be truly product-led, your company needs to understand the holistic customer journey. Is it app-focused? Web-focused? A combination of both? This may depend on your industry—and in the data below, industry-specific breakdowns show exactly how app and web activity reacts to trends and seasonality.
Your customer’s digital experience isn’t segmented to one channel, and your growth strategies shouldn’t be either. Customers want a consistent, unified experience. As our data shows, websites are a valuable part of that experience. Websites function as products that are highly valuable customer touch-points; they’re more than just brochures on a webpage.
Read on for deeper insights into app and web data: it may very well impact how you invest your organization’s resources this year.
All Products
Apps Do the Shuffle, Web Does the Hustle
Our data looks at the behaviors of millions of users accessing apps and websites from January 2020 to December 2021. In January 2020, 58% of monthly active users were app users. But by December 2021, website usage had grown much faster than apps. App MAUs grew 36% over the two-year period, while MAUs on websites grew a whopping 57%.
The growth in MAUs on web reduced much of the gap between app and web, and by December 2021, the number of MAUs on apps made up 54% of all end users, getting closer to an even split.
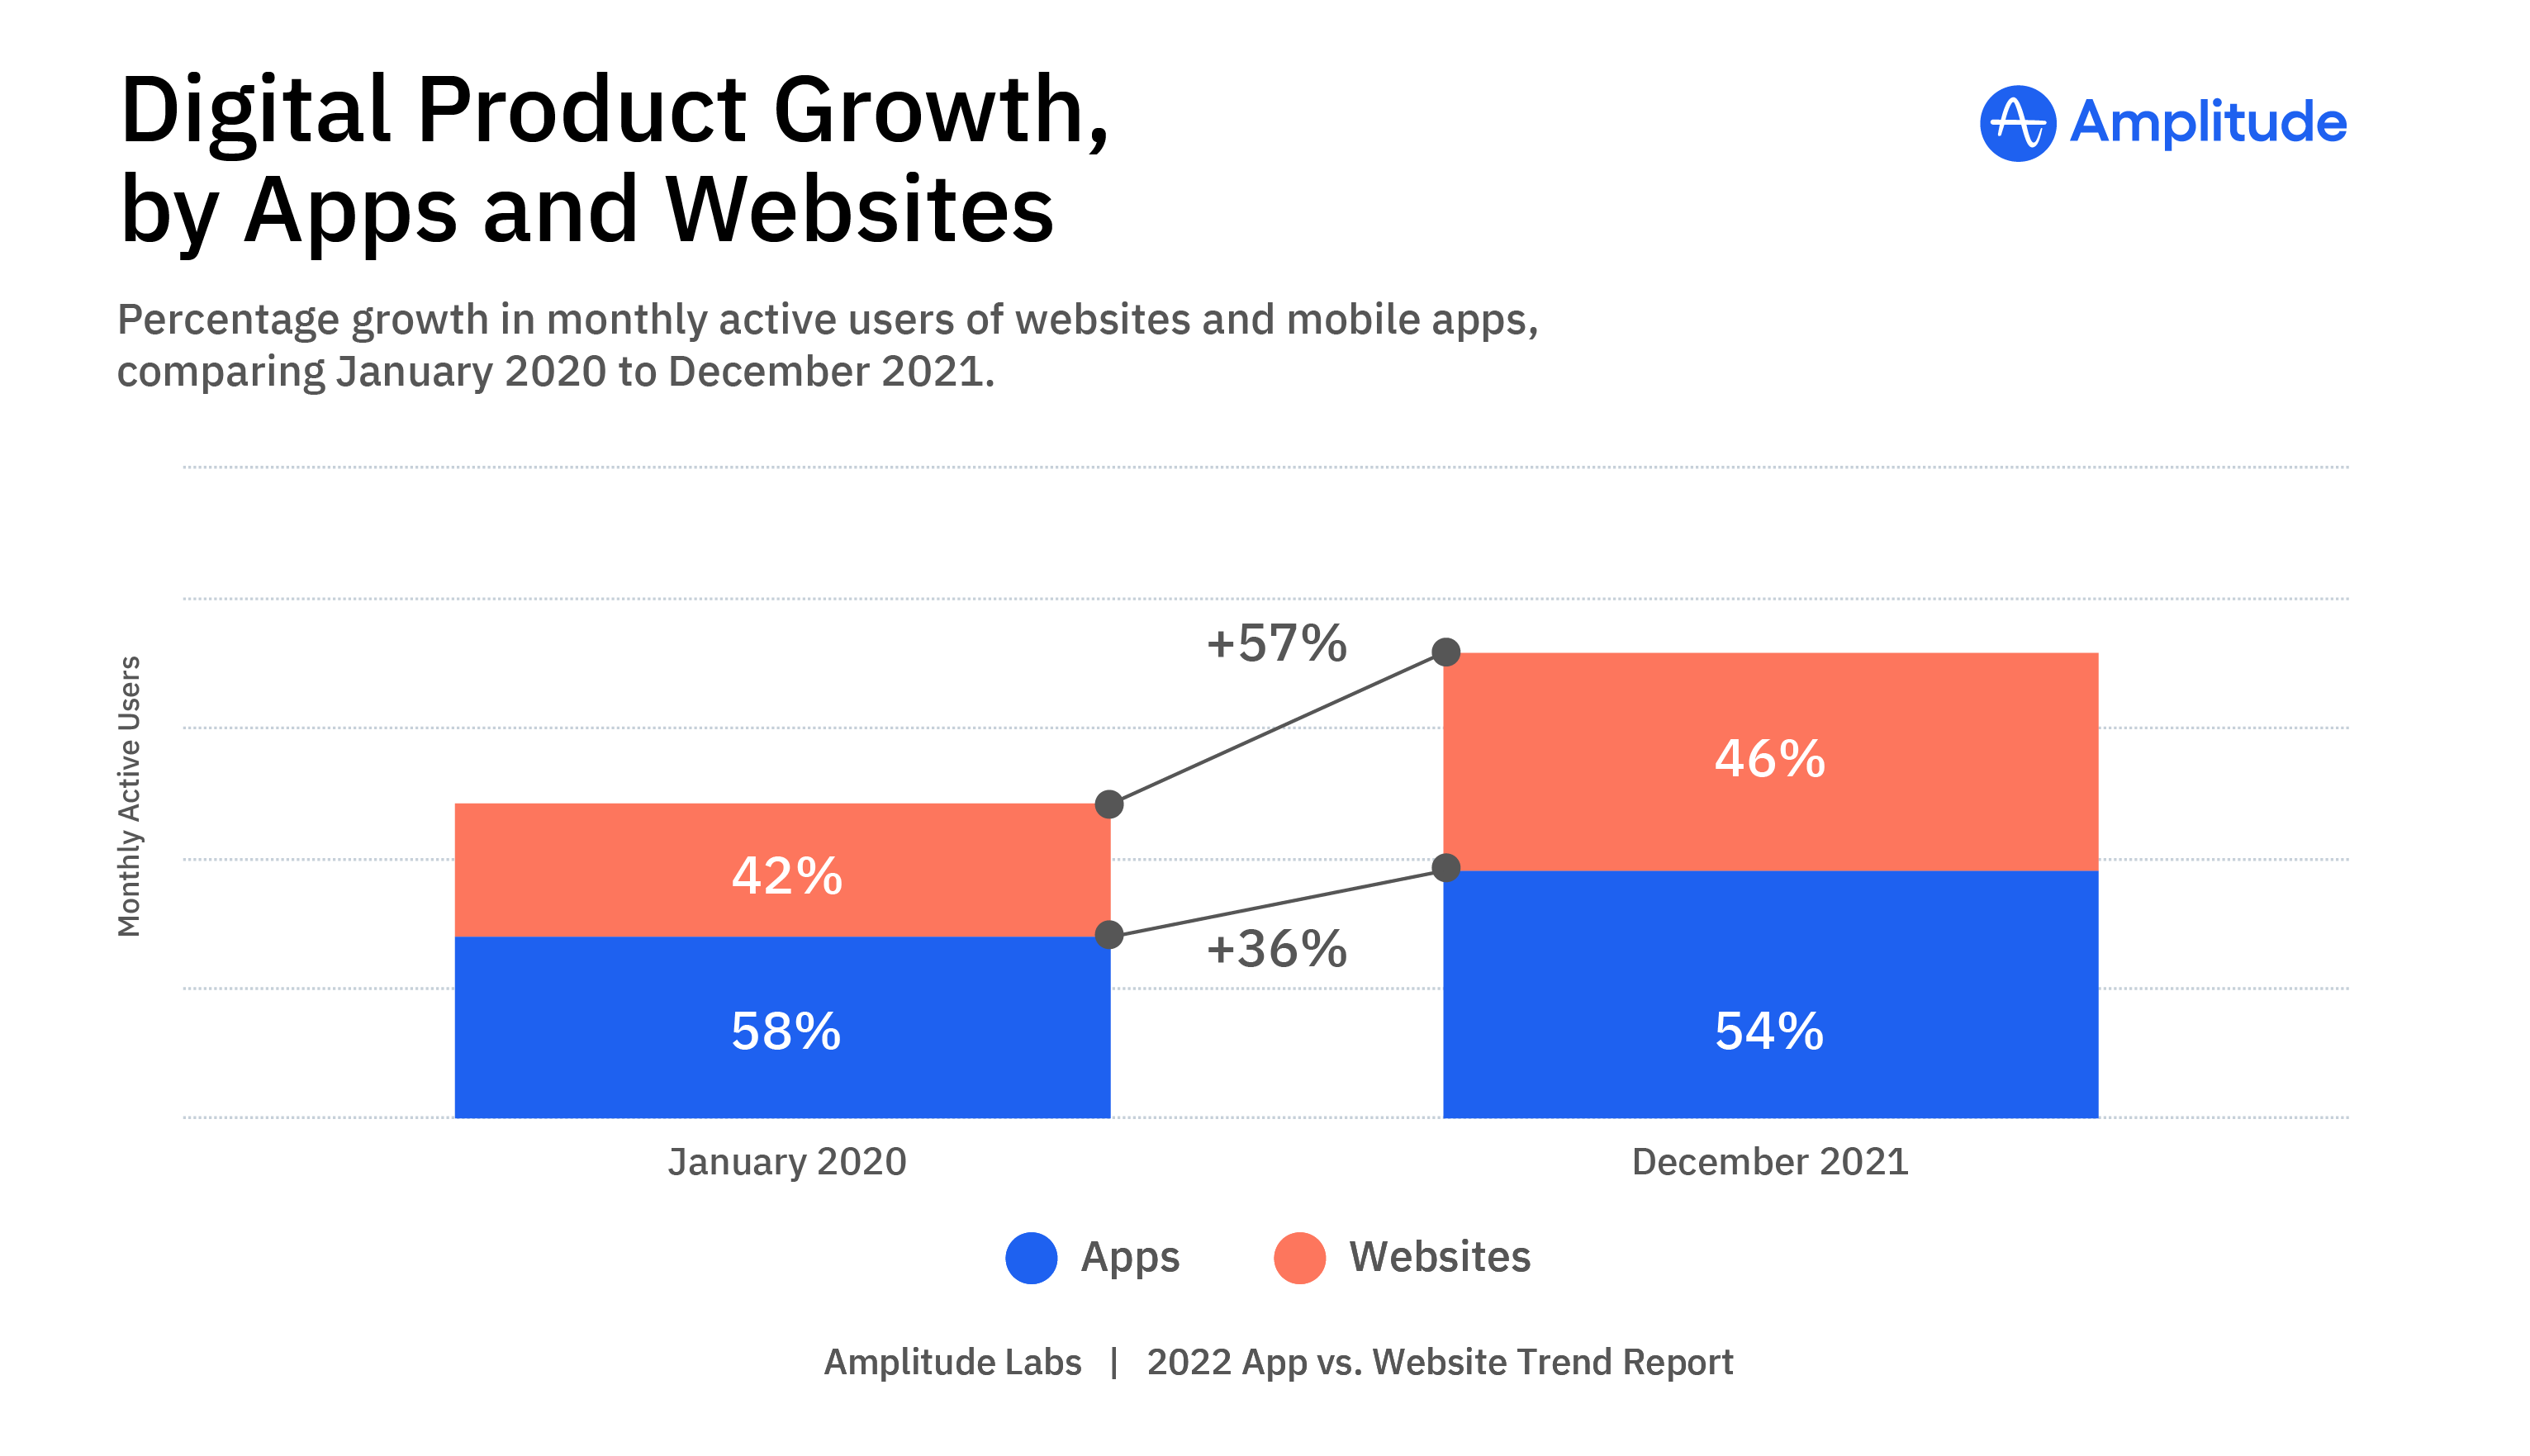
App vs Website Growth, Jan 2020 vs Dec 2021
While we see more growth among MAUs on websites, this web activity has more fluctuations and seasonal patterns compared to app usage.
The spring of 2020 generated a flurry of web activity: after a -2% drop in February (likely impacted by the fact that February has fewer days in the month, and therefore fewer MAUs to compare), 29% more MAUs turned to web products in March than in January 2020. This change of 31 percentage points was the largest one-month change during the data period when looking across all users.
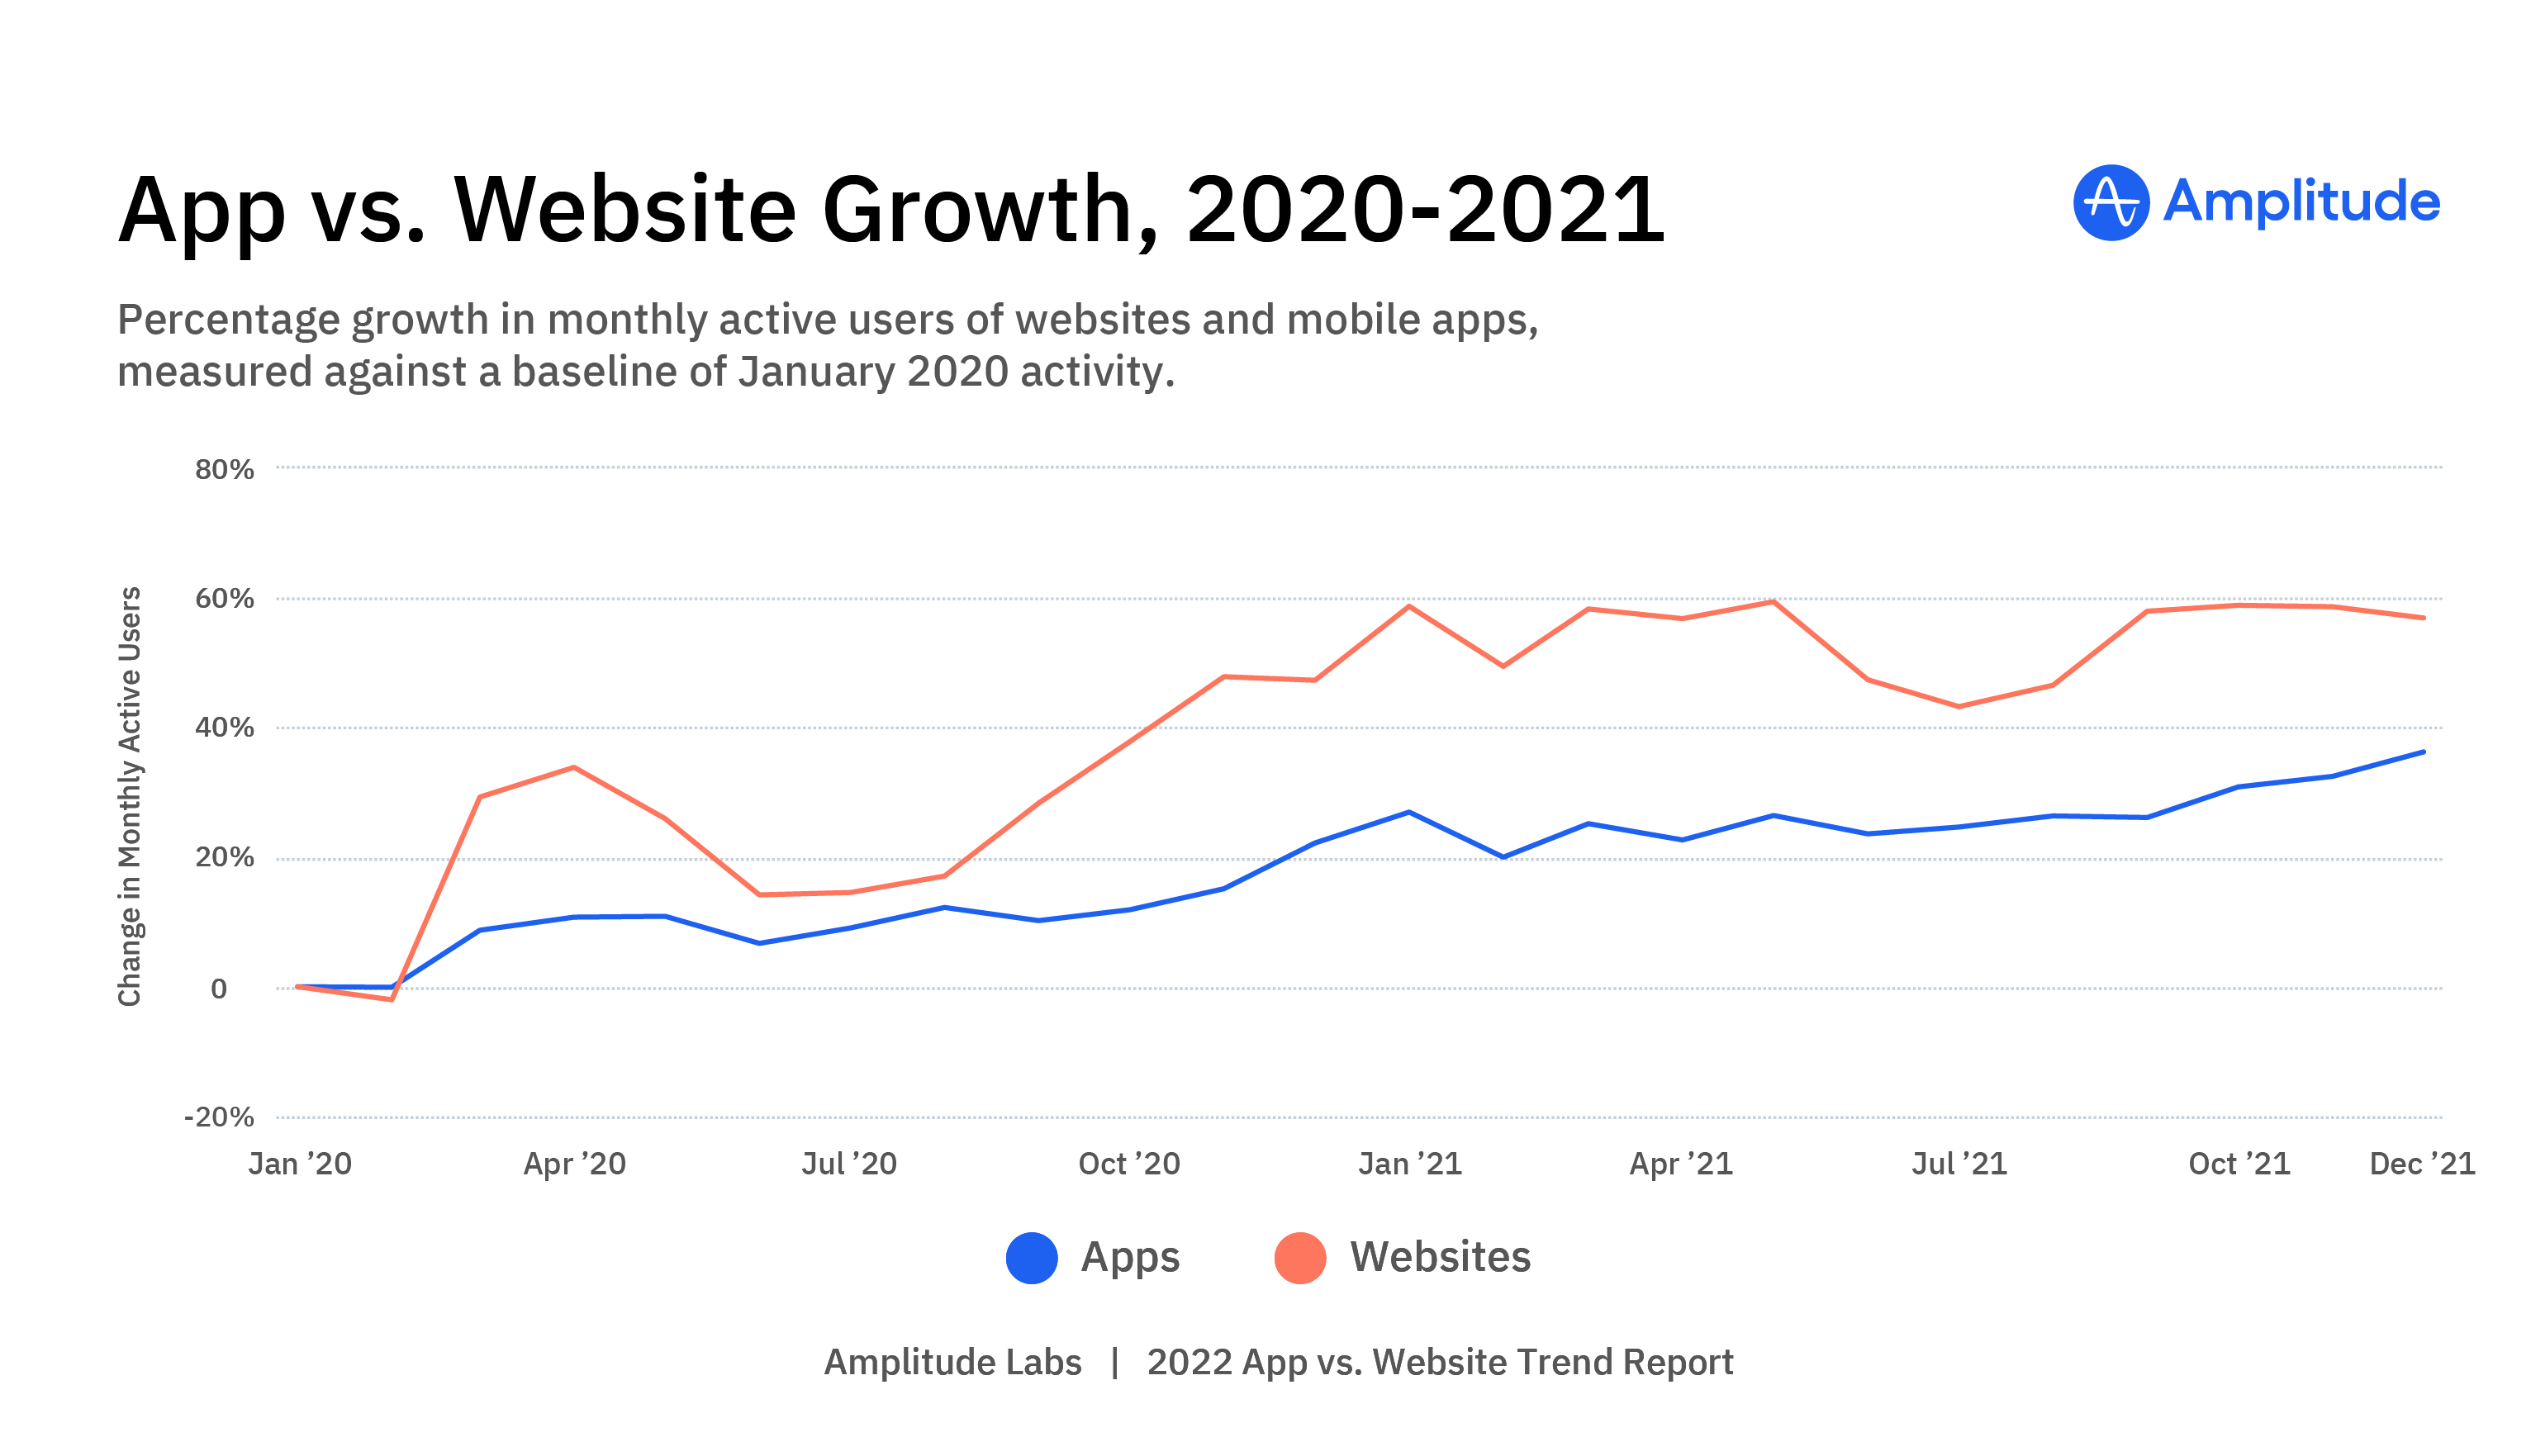
App vs Website Growth, 2020-2021
The growth of users on websites against January 2020 numbers hit a lull in the summer months of June, July, and August in both 2020 and 2021. Summer growth rates were 11 to 12 percentage points lower than the corresponding months of May and September for those years. However, these lulls never dipped into negative territory; the summer still saw 14-17% growth among monthly active web users in 2020 and 43-47% growth among those users in 2021 against January 2020.
The growth of MAUs on apps took a slower and steadier course across the data period, with only single-digit change from month to month. The biggest jump in monthly active app users is nine percentage points between February and March of 2020. The largest dip we see in the growth rate of monthly active app users is seven percentage points between January and February 2021. (Again, the shorter month of February exacerbates changes.)
Now, let’s look at how this data varies among industries.
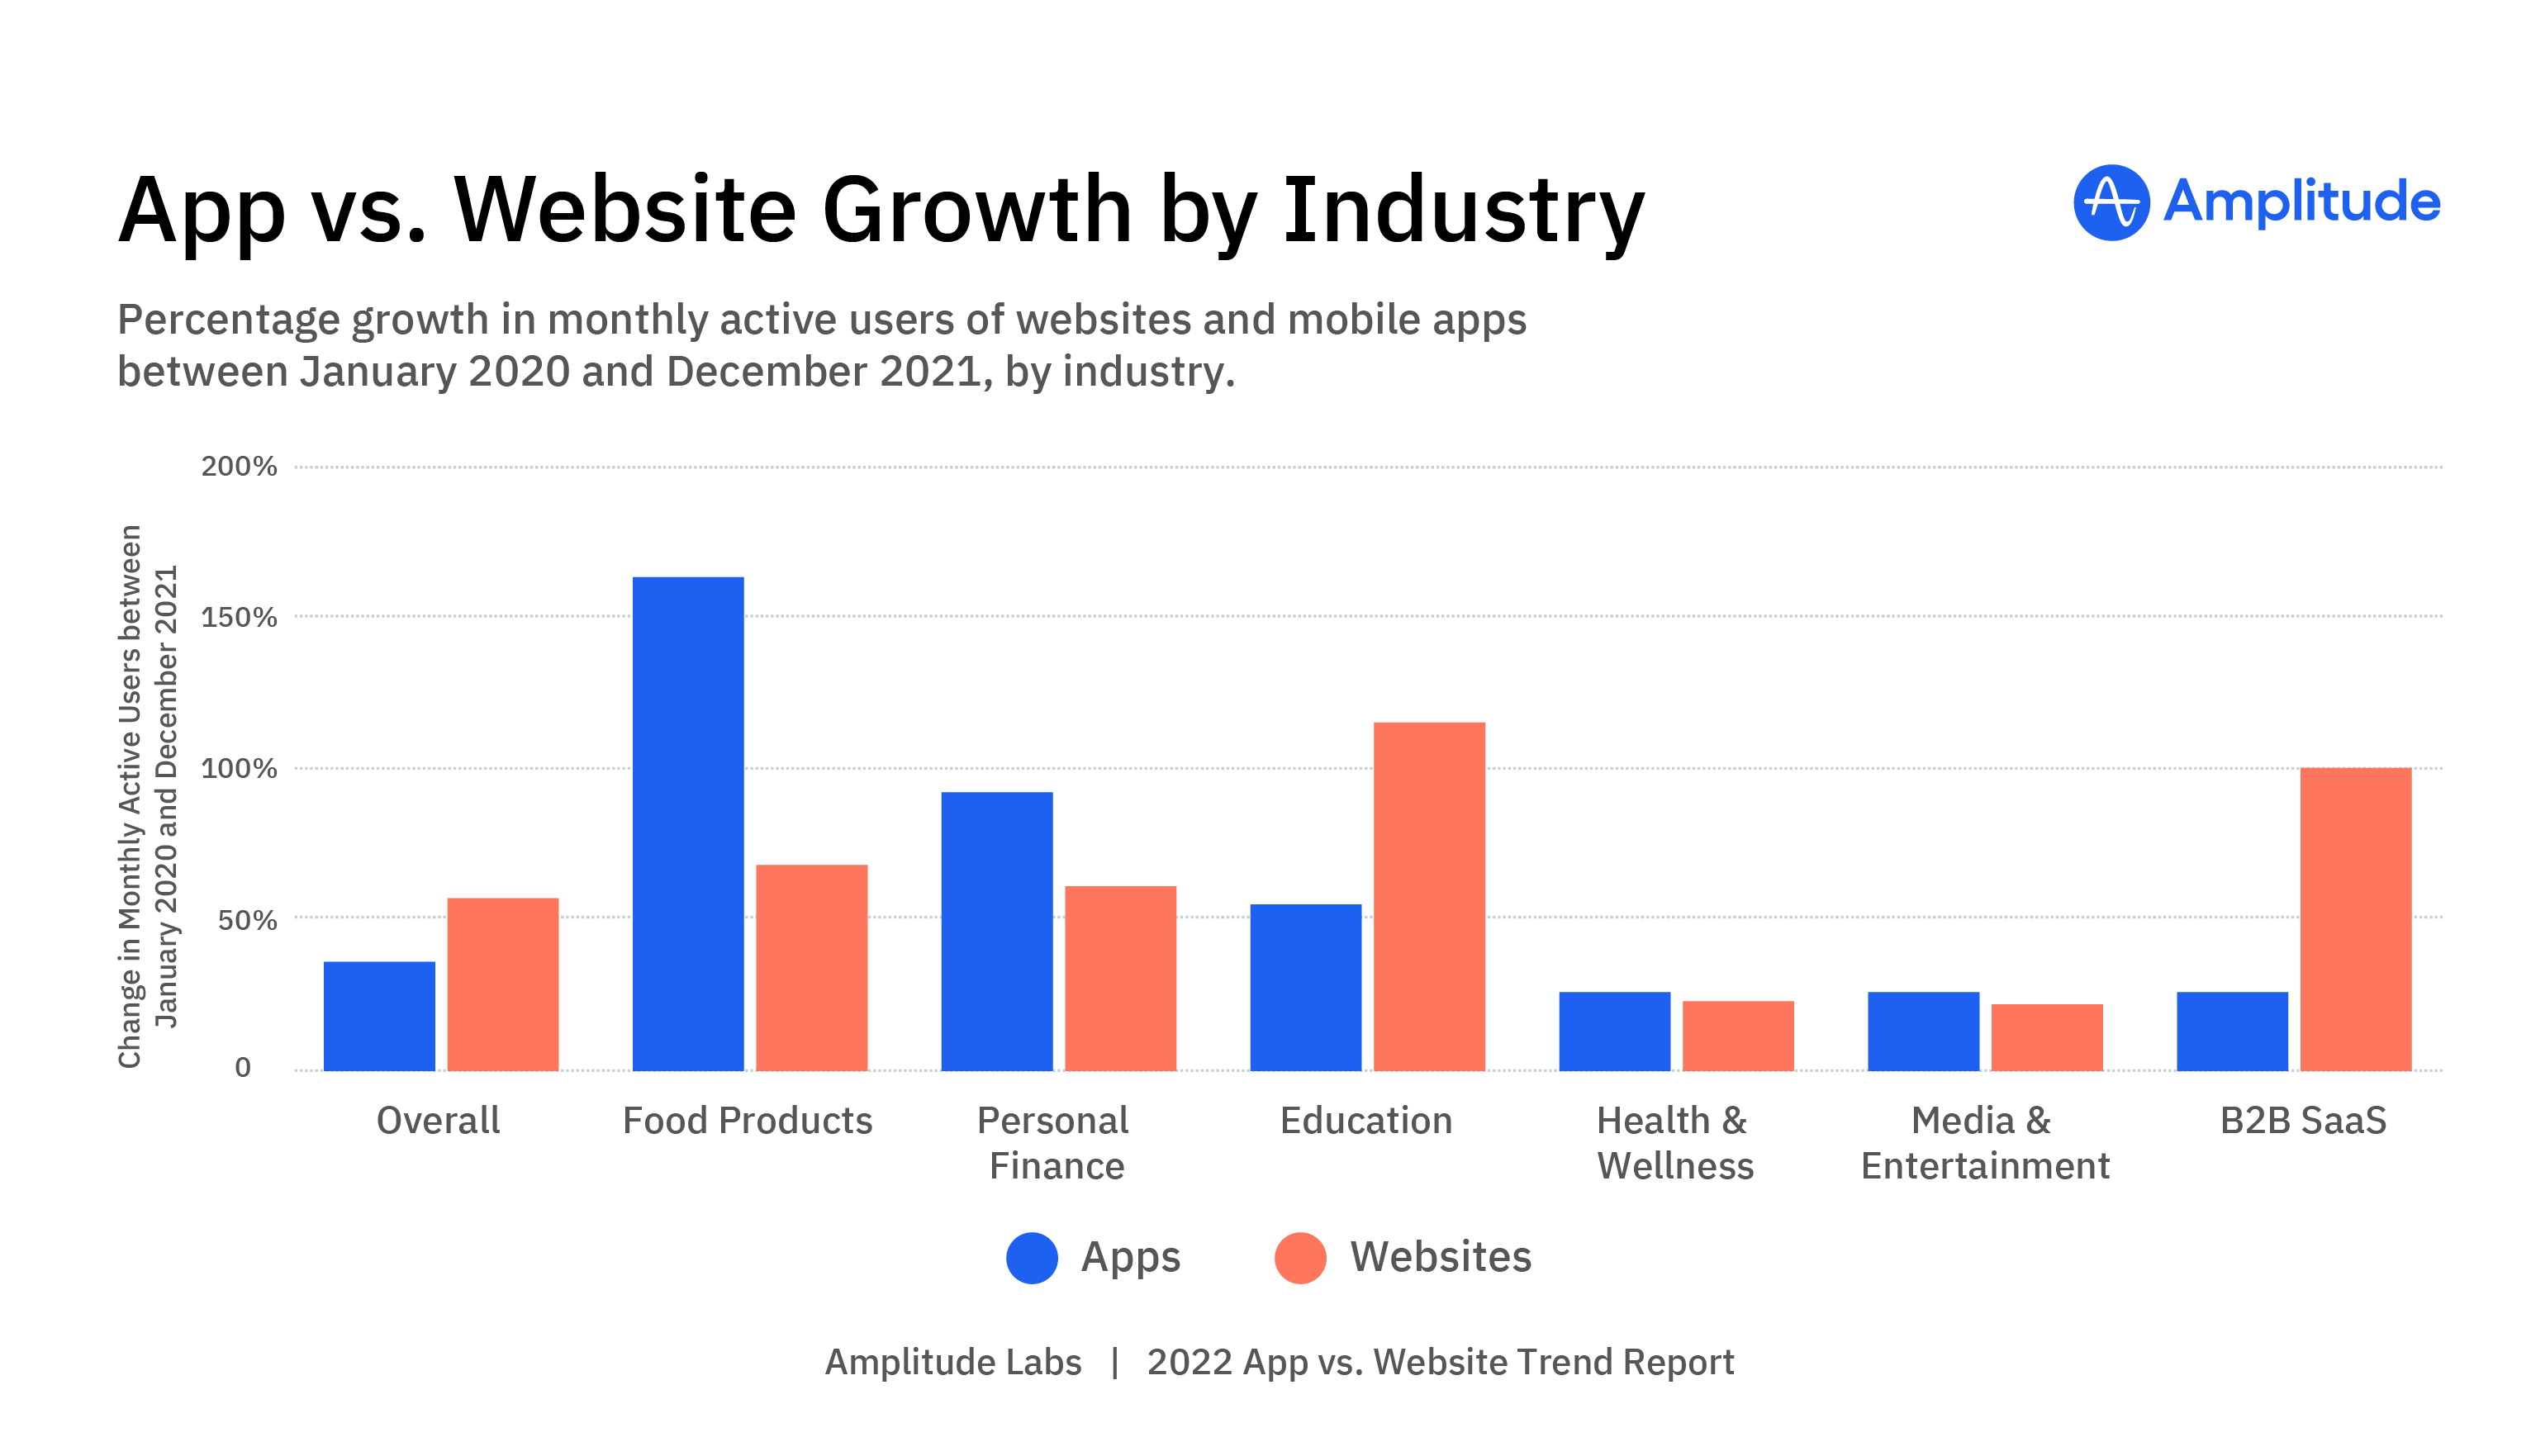
App vs. Website Growth by Industry
By December 2021, B2B SaaS tools, food products, and personal finance hold the top three spots in terms of amount of total growth in monthly active users against January 2020. The top three ranked spots among app users are food products, personal finance, and education tools. Among website users, the top three ranked spots are education tools, B2B SaaS, and food products.
Food
Hot Apps, with a Side of Web
Note: This category includes apps and websites to order fast food and restaurant-prepared food, plus food delivery services, grocery retailers, and pre-prepared meal kits.
Online food orders have become big business. McKinsey reported in September 2021 that "food delivery has become a global market worth more than $150 billion, having more than tripled since 2017." Let’s dig in.
In January 2020, 80% of all MAUs accessing food products did so via websites, compared to only 20% on apps. However, food-ordering habits changed greatly over the following two years, and consumers increasingly reached for apps when shopping for food. By December 2021, the number of MAUs shopping for food on apps had grown 162% since January 2020, compared to "only" 68% growth for web. The gap between the raw number of web versus app users shrank in this time, and by December 2021, 72% of all MAUs accessing food-related products did so via websites, compared to 28% on apps.
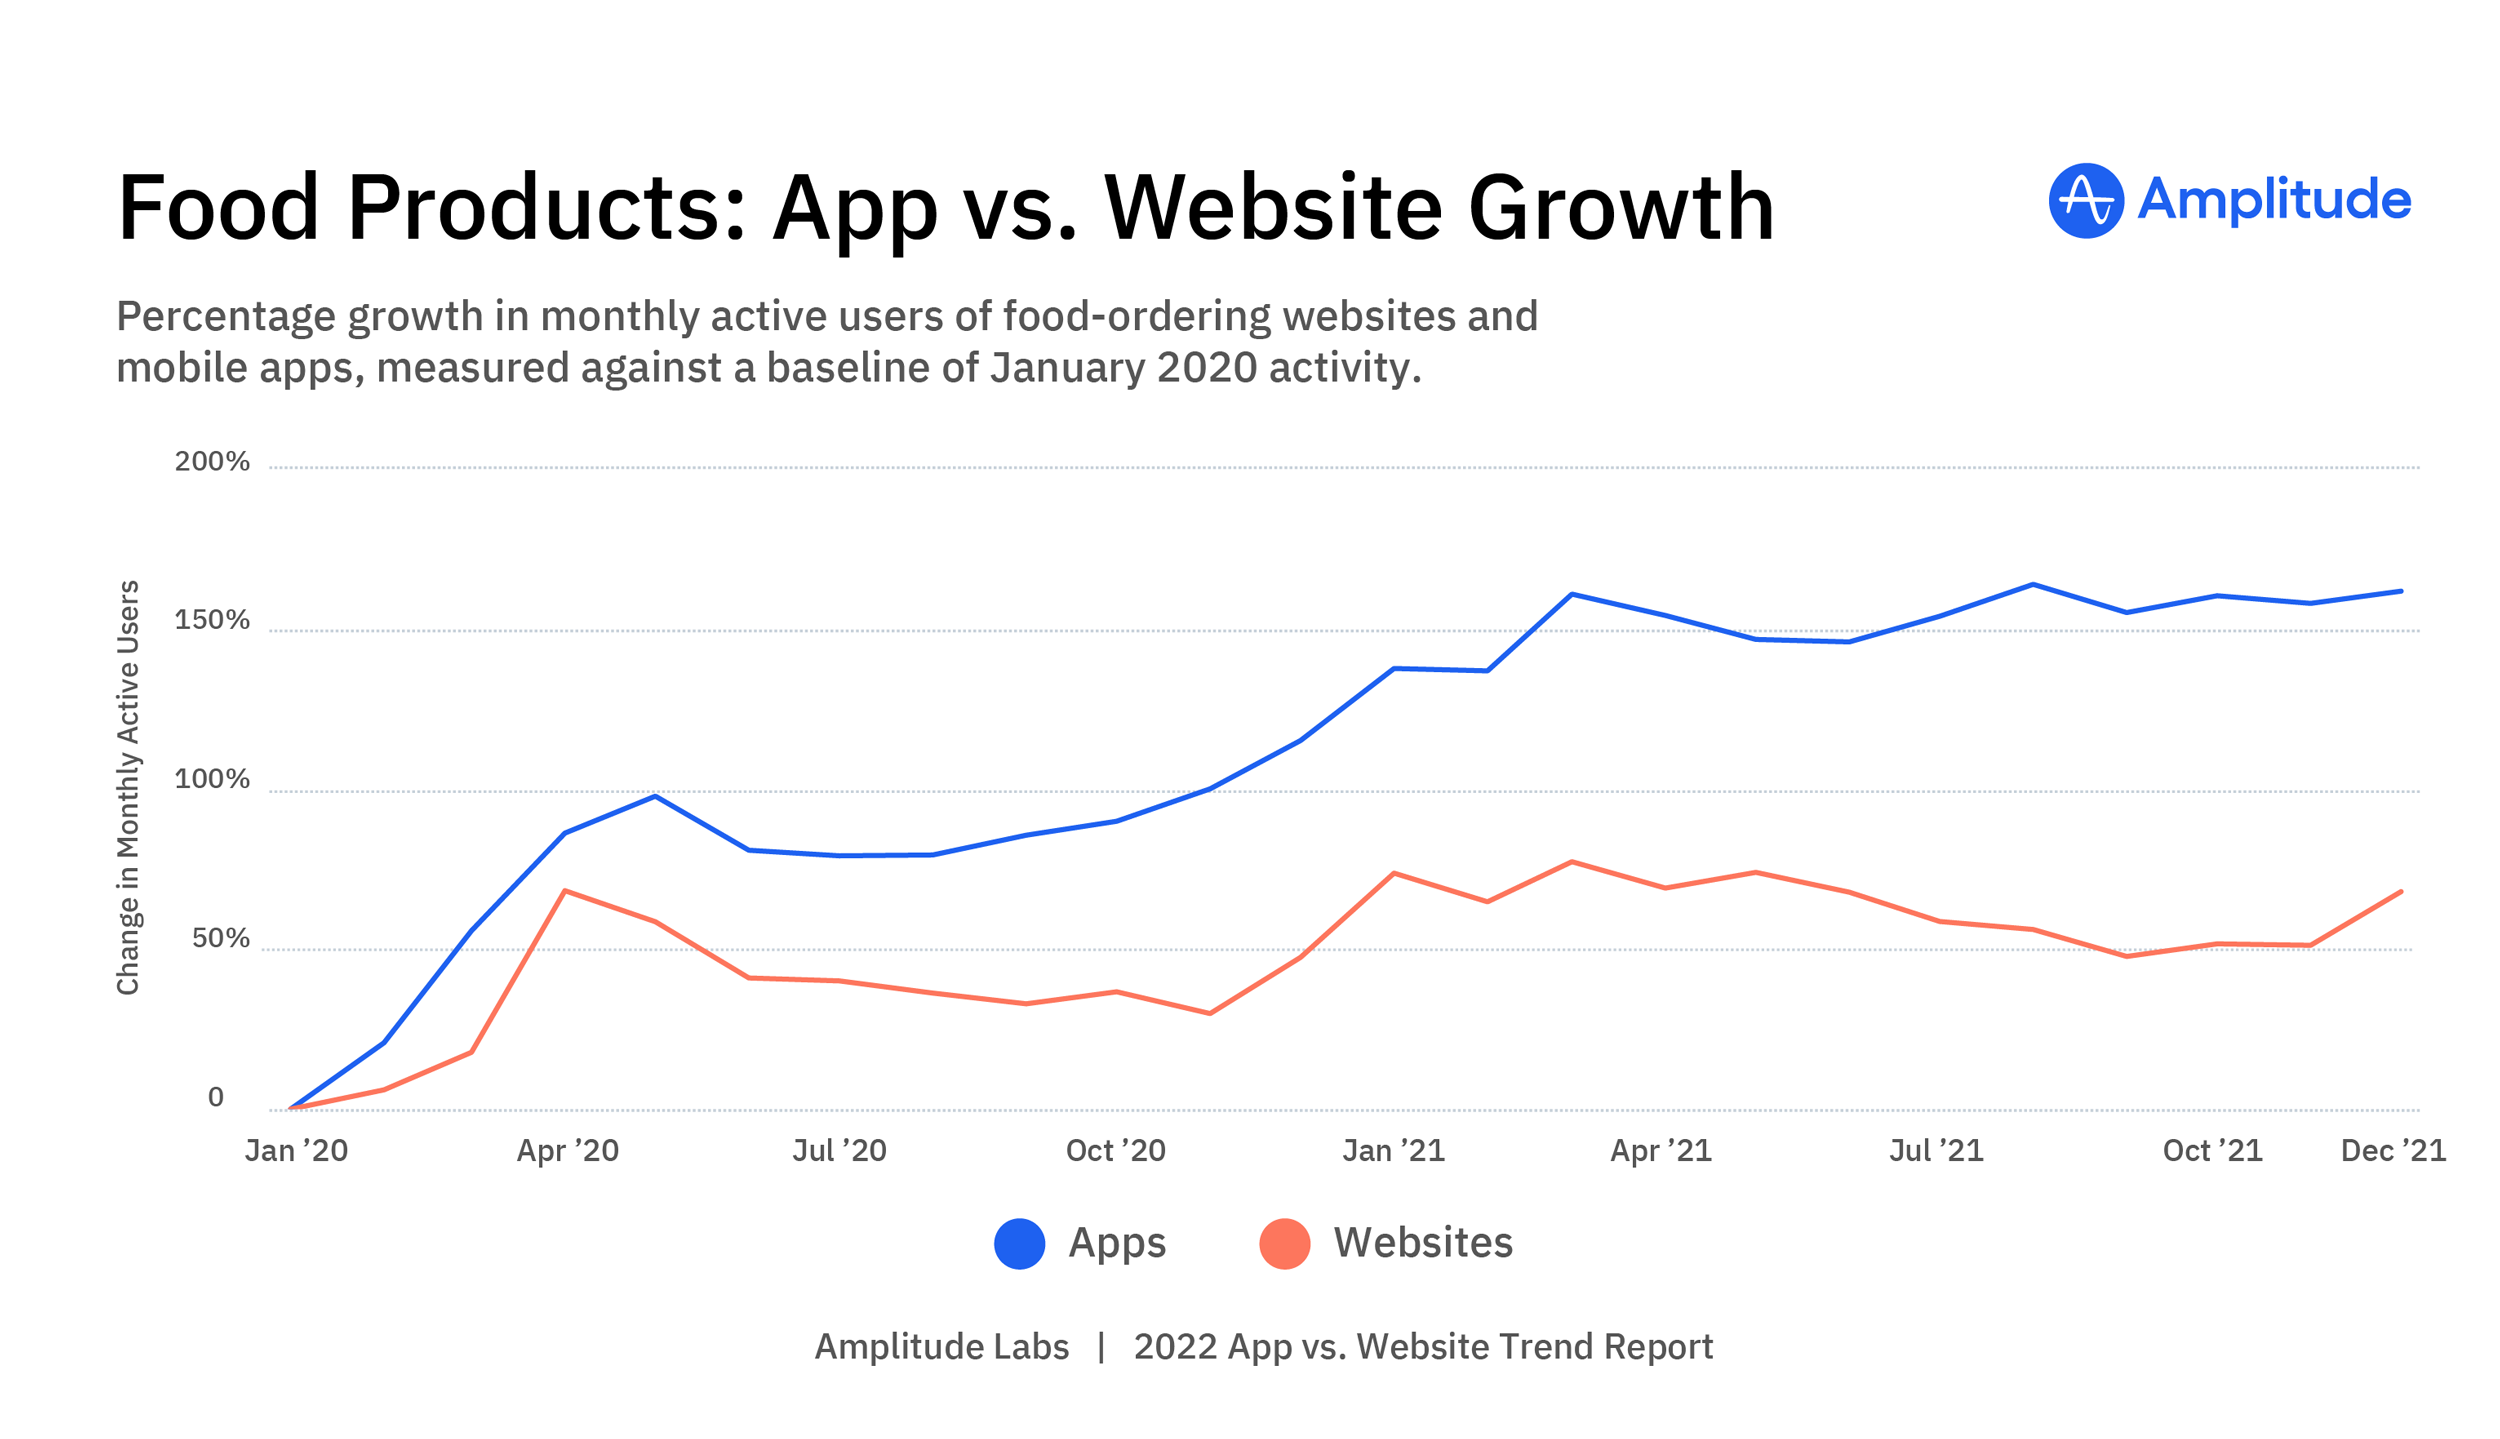
Food: App vs. Website Growth
While many sectors experienced a surge of digital user growth in the spring of 2020 in response to the pandemic, the growth of food-related shopping takes the cake. The largest month-over-month jump we see across our six industry analyses comes from the burst of food-related web use in April 2020. At this time, the growth of MAUs turning to websites to order food jumped 50 percentage points in just one month, from 18% growth in March to 68% growth in April, compared to the baseline of January 2020 usage. The growth of MAUs on apps also showed impressive counts, jumping 30 percentage points—56% to 86%—against January 2020 in the same time period.
Over the past two years online food orders were hot and kept up momentum as restaurants opened their doors again. Even the slowest growth period among the food sector far outpaced the overall growth across other industries tracked. Between June and August of 2020, growth of all MAUs (regardless of industry and observed as a whole) on web hovered in the teens, and app growth barely squeaked into double digits. Meanwhile, in the food sector, growth on apps checked in between 79-81%, and growth on web between 36-41%.
While the growth of MAUs on web dipped in the fall of 2020, the growth of MAUs on both apps and web heated up again in 2021, ranging from 48-77% growth against January 2020 for web and 138-164% for apps.
Personal Finance
Interest in Online Banking Compounds Steadily
Note: This category includes personal banking and credit, budgeting assistance, and micro-saving products.
Monthly active users in our data set consistently favor apps over websites when accessing their personal finance tools. In January 2020, 74% of all MAUs accessed these tools on apps, versus 26% on web. Users have been eagerly adopting personal finance tools on both platforms, but apps have grown more: over our two-year data period, the number of MAUs choosing apps to access their personal financial products grew 92% against January 2020, while the number on websites grew 61%. This figure is even more impressive considering that app users represented about three times as many users as web, and therefore would presumably have more difficulty sustaining such growth rates. By December 2021, 77% of MAUs accessing banking products were doing so via apps, while those on web dropped to 23%—the highest percentage of app users and lowest percentage of web users among all industries included in this report.
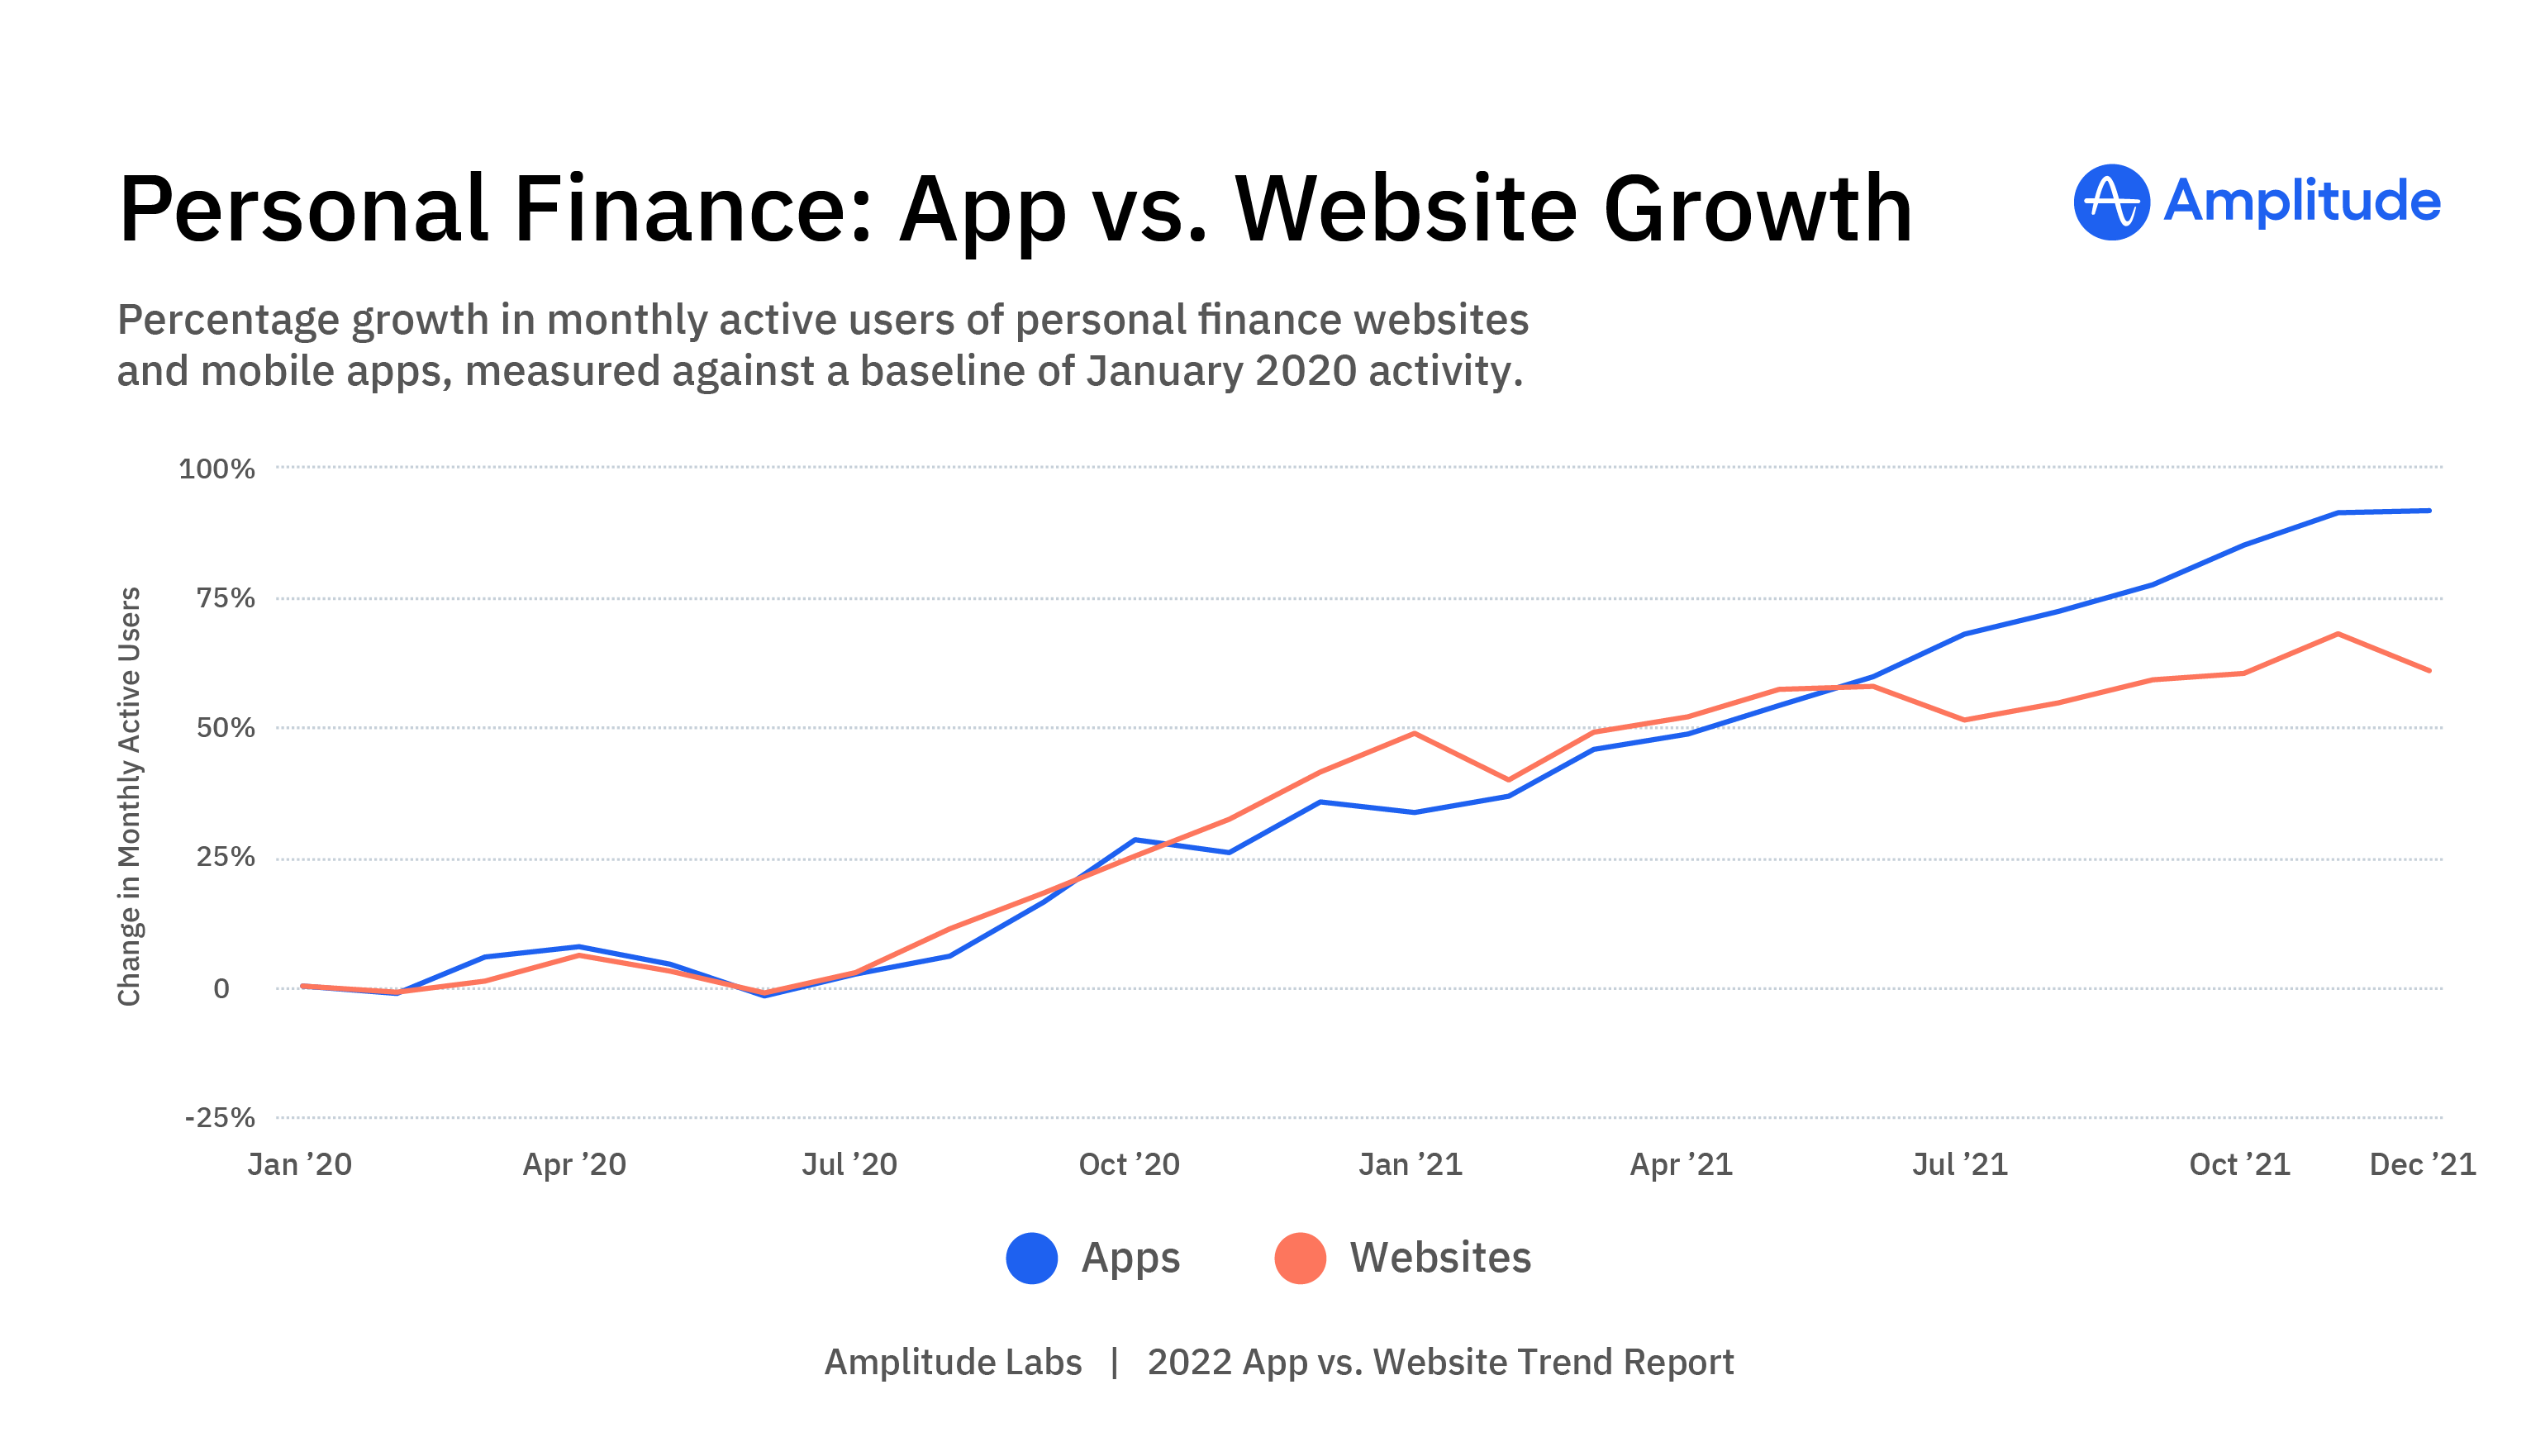
Personal Finance: App vs. Website Growth
When we look at products used for personal banking, credit, and budgeting, our data shows an overall steady increase in the growth of MAUs on websites and apps for banking-related activities against January 2020.
Beginning in July 2020, MAUs began increasing use of personal finance tools at a rather steady pace. By December 2020, the number of MAUs on apps measured 36% higher than in January 2020, and the number of MAUs on web measured 41% higher.
In 2021, the growth of MAUs on apps climbed steadily, growing from 34% higher in January 2021 than January 2020, to 92% higher in December 2021. On the other hand, MAUs on websites took a more meandering climb upward, growing from 49% higher in January 2021 against January 2020, to 61% higher in December 2021.
Most month-over-month fluctuations were limited to single-digit changes in percentage points. The biggest jumps came in the form of a 12-percentage-point increase in the number of monthly active app users between September and October 2020, and a 9-percentage-point increase in the number of monthly active web users between February and March 2021.
Education
Websites Score High Marks at School
Note: This category includes all products related to education, including online courses, learning management systems, language lessons, study resources, continuing education and adult learning lessons, upskilling services and virtual skill coaching.
For some sectors, websites are predominantly the go-to tool. Students appear to rely heavily on websites for education-related software. While cellphones are often frowned upon in class, laptops are increasingly distributed as tools for learning.
In January 2020, 83% of all MAUs accessing educational tools did so via websites, compared to 17% on apps. The popularity of the web only continued to grow among the education sector. By December 2021, 87% of MAUs accessing educational tools were doing so via websites, vs 13% via apps.
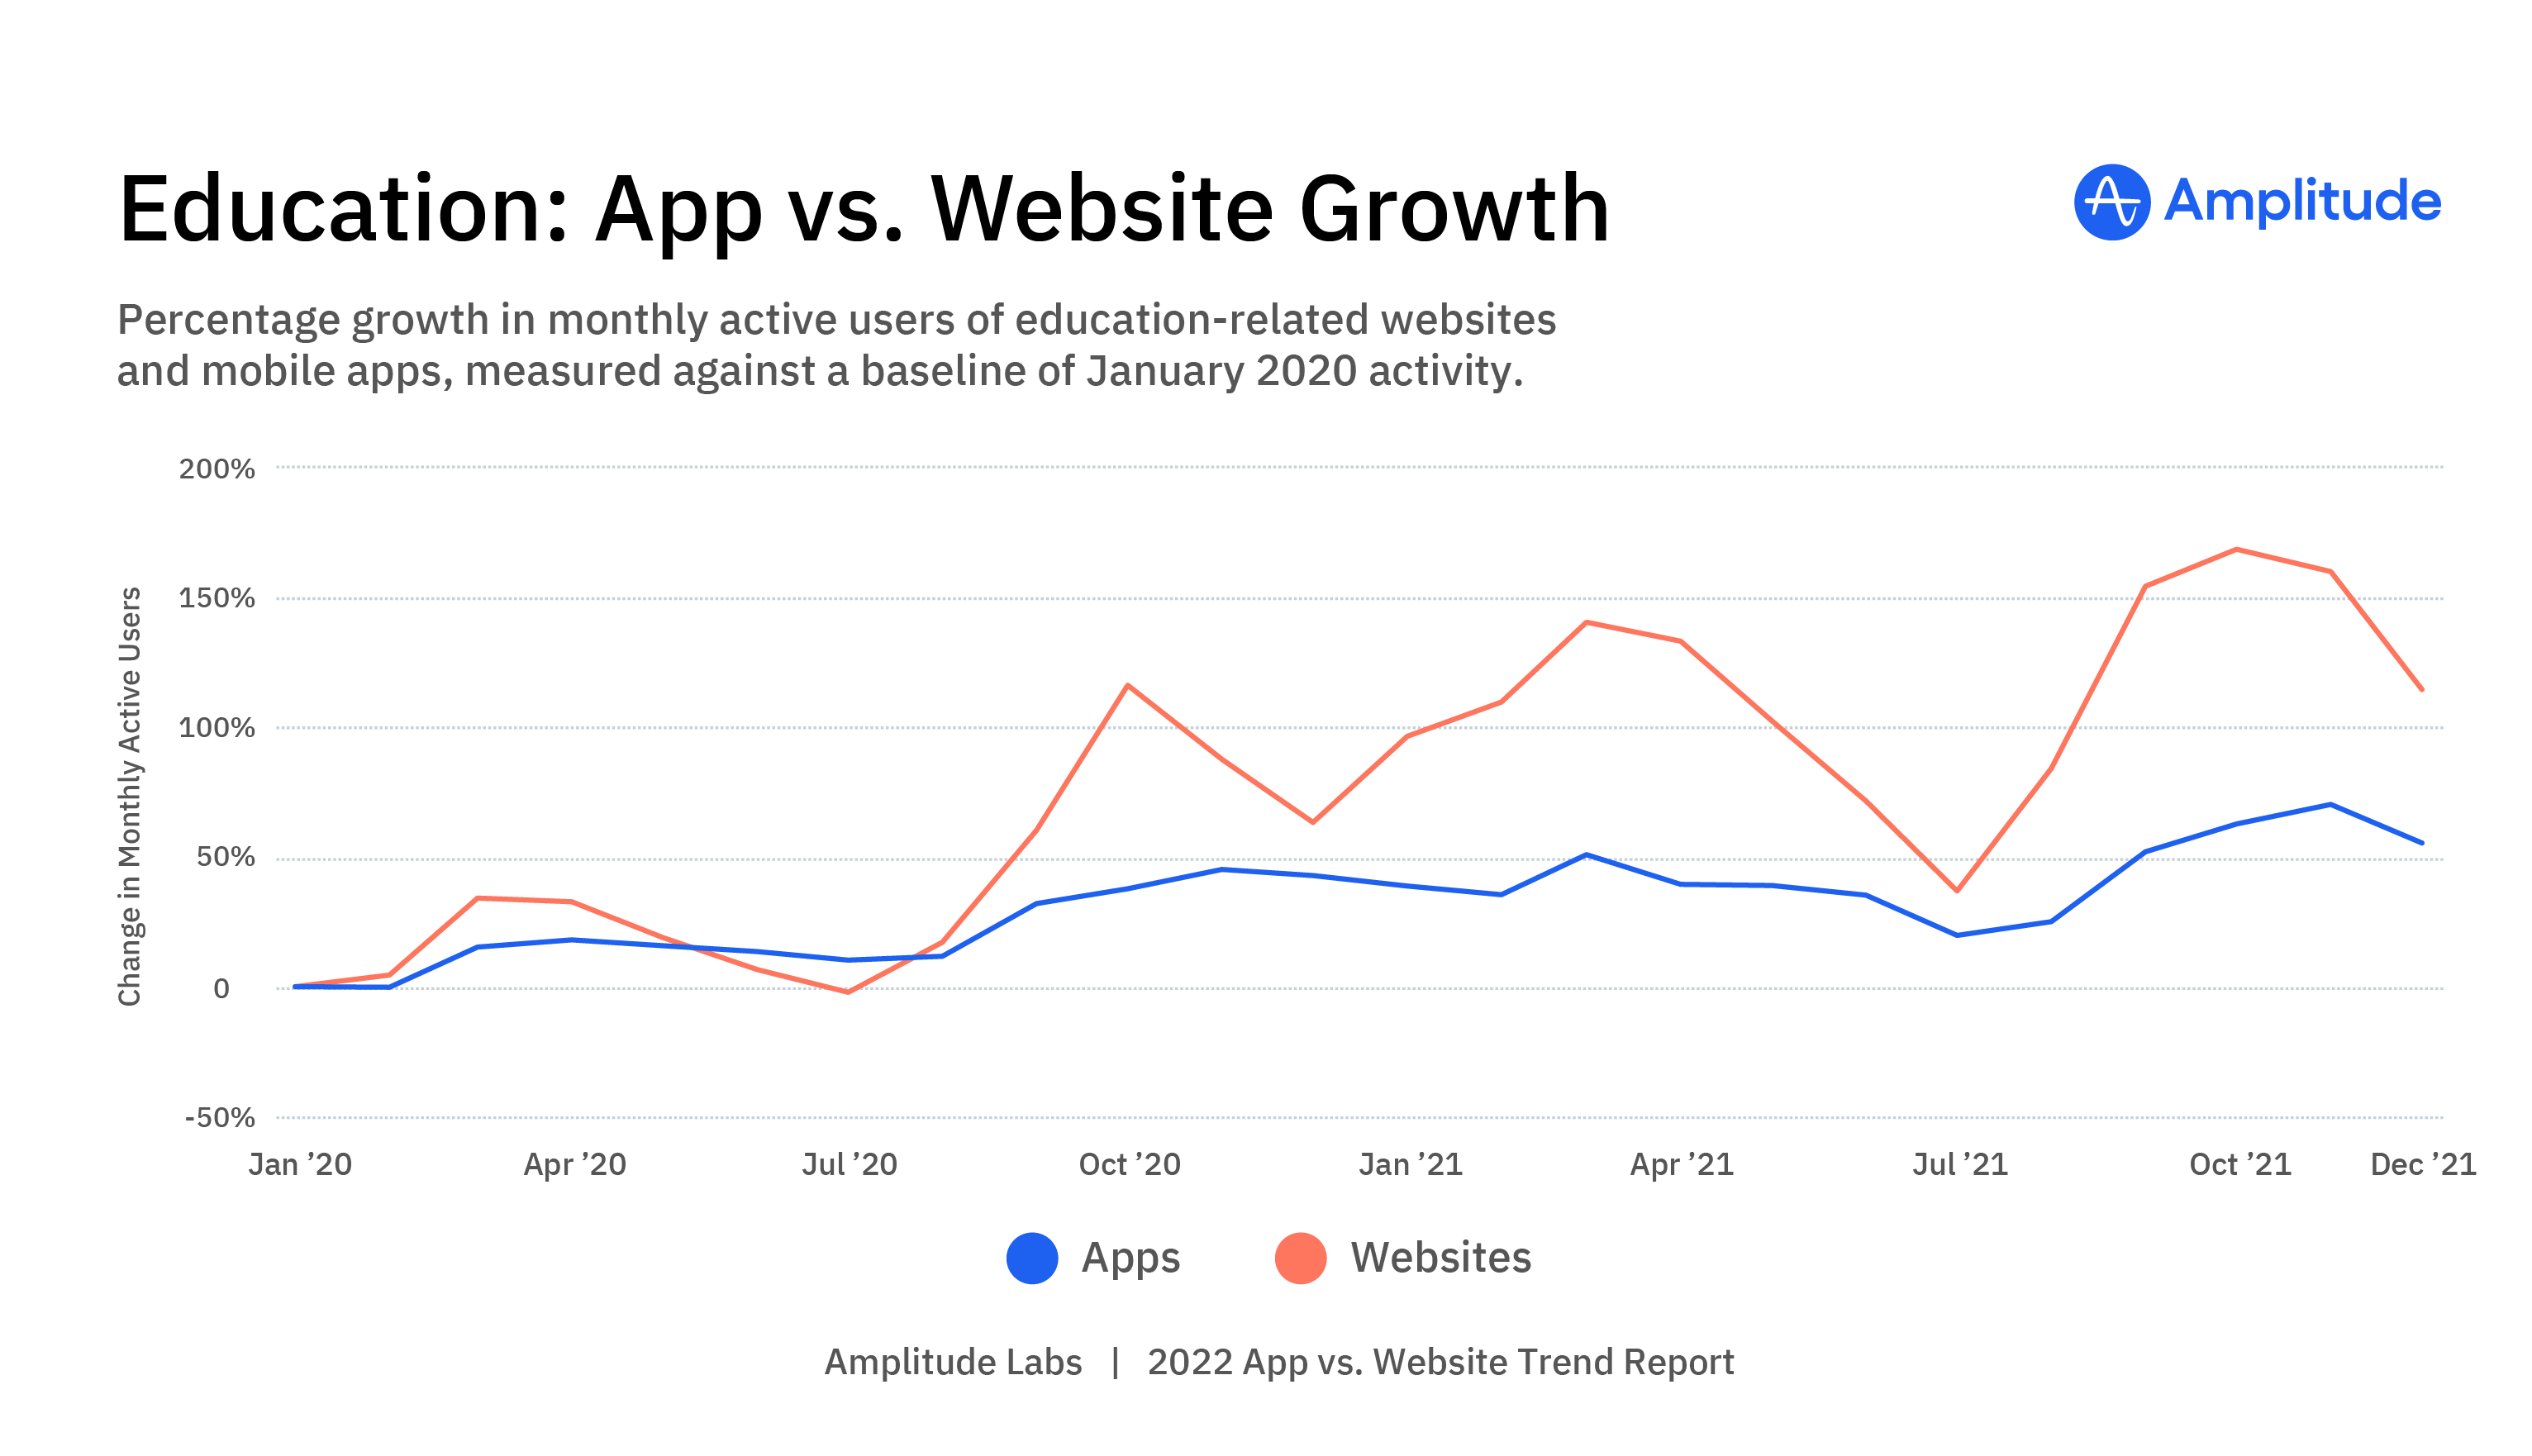
Education: App vs. Website Growth
The spring of 2020 brought a burst of users to web-based educational tools, but the bump was not as extreme as in other sectors, such as online food shopping and B2B SaaS products. The growth of MAUs on web rose to 34% in March and 33% in April before dropping back down to 7% growth in June against January 2020. Meanwhile, apps kept a more stable growth spurt, hitting 15% growth of MAUs in March, 18% April, then dropping to 14% in June 2020 against January of that year.
Seasonal trends are well established in the educational sector, and our data shows lulls in summer months and over winter holidays. The two deepest dips in website growth occur in July: in July 2020, MAUs on web dropped to -2%, and a year later (July 2021) the summer dip translated to 37% growth against the January 2020 benchmark. Apps also experienced relative lows in July: growth of MAUs on apps dropped to 10% in July 2020 and 20% in July 2021.
In December 2020, the number of MAUs on web dropped to 63% growth against January 2020, flanked by peaks of 116% in October 2020 and 141% in March 2021. By December 2021, website usage on educational products had grown substantially; the winter holiday dip dropped to a still-strong 115% growth against January 2020. The dip in the growth of MAUs on apps was most evident at the end of 2021, where growth dropped from 70% in November to 55% in December, against January 2020.
Our data shows two interesting takeaways: first, the school year beginning in 2021 shows more growth than the prior school year, and second, the growth of MAUs on web peaks in March and October twice in a row. The March 2020 peak of web growth may be related to the pandemic, but it’s not a one-hit wonder. Between August 2020 and July 2021, the number of MAUs on web tracked 116% higher in October 2020, and 141% higher in March 2021 against January 2020. In the fall of 2021, we see our highest peak in the education sector, at 169% growth in MAUs on web in October against January 2020 numbers.
App use has a similar pattern as that of web use, with peaks in March and November, but with less volatility. Looking at the growth of MAUs on apps between August 2020 and July 2021, we see a bump up to 45% in November 2020 and a peak of 51% in March 2021. The fall of 2021 brings us the peak of 70% growth in November 2021 against January 2020.
Health and Wellness
An App a Day Keeps the Doctor Away
Note: This category includes all software related to overall health and wellness, including products designed to manage physical activity and fitness, track food and diet, and promote mental health.
We see a much larger number of MAUs reaching for health and wellness apps than websites. In January 2020, 72% of all MAUs accessing health and wellness products did so via apps, compared to only 28% on websites. The gap between apps and websites continued to grow, and by December 2021, 74% of all MAUs accessing health and wellness products did so via apps, compared to 26% on web.
In December 2021, Deloitte Global estimated that global consumers spent $1.6 billion on health and wellness apps in 2021, an especially impressive total considering how many of these apps are free or low cost. Our data shows that despite seasonal dips, their overall popularity continues to trend higher.
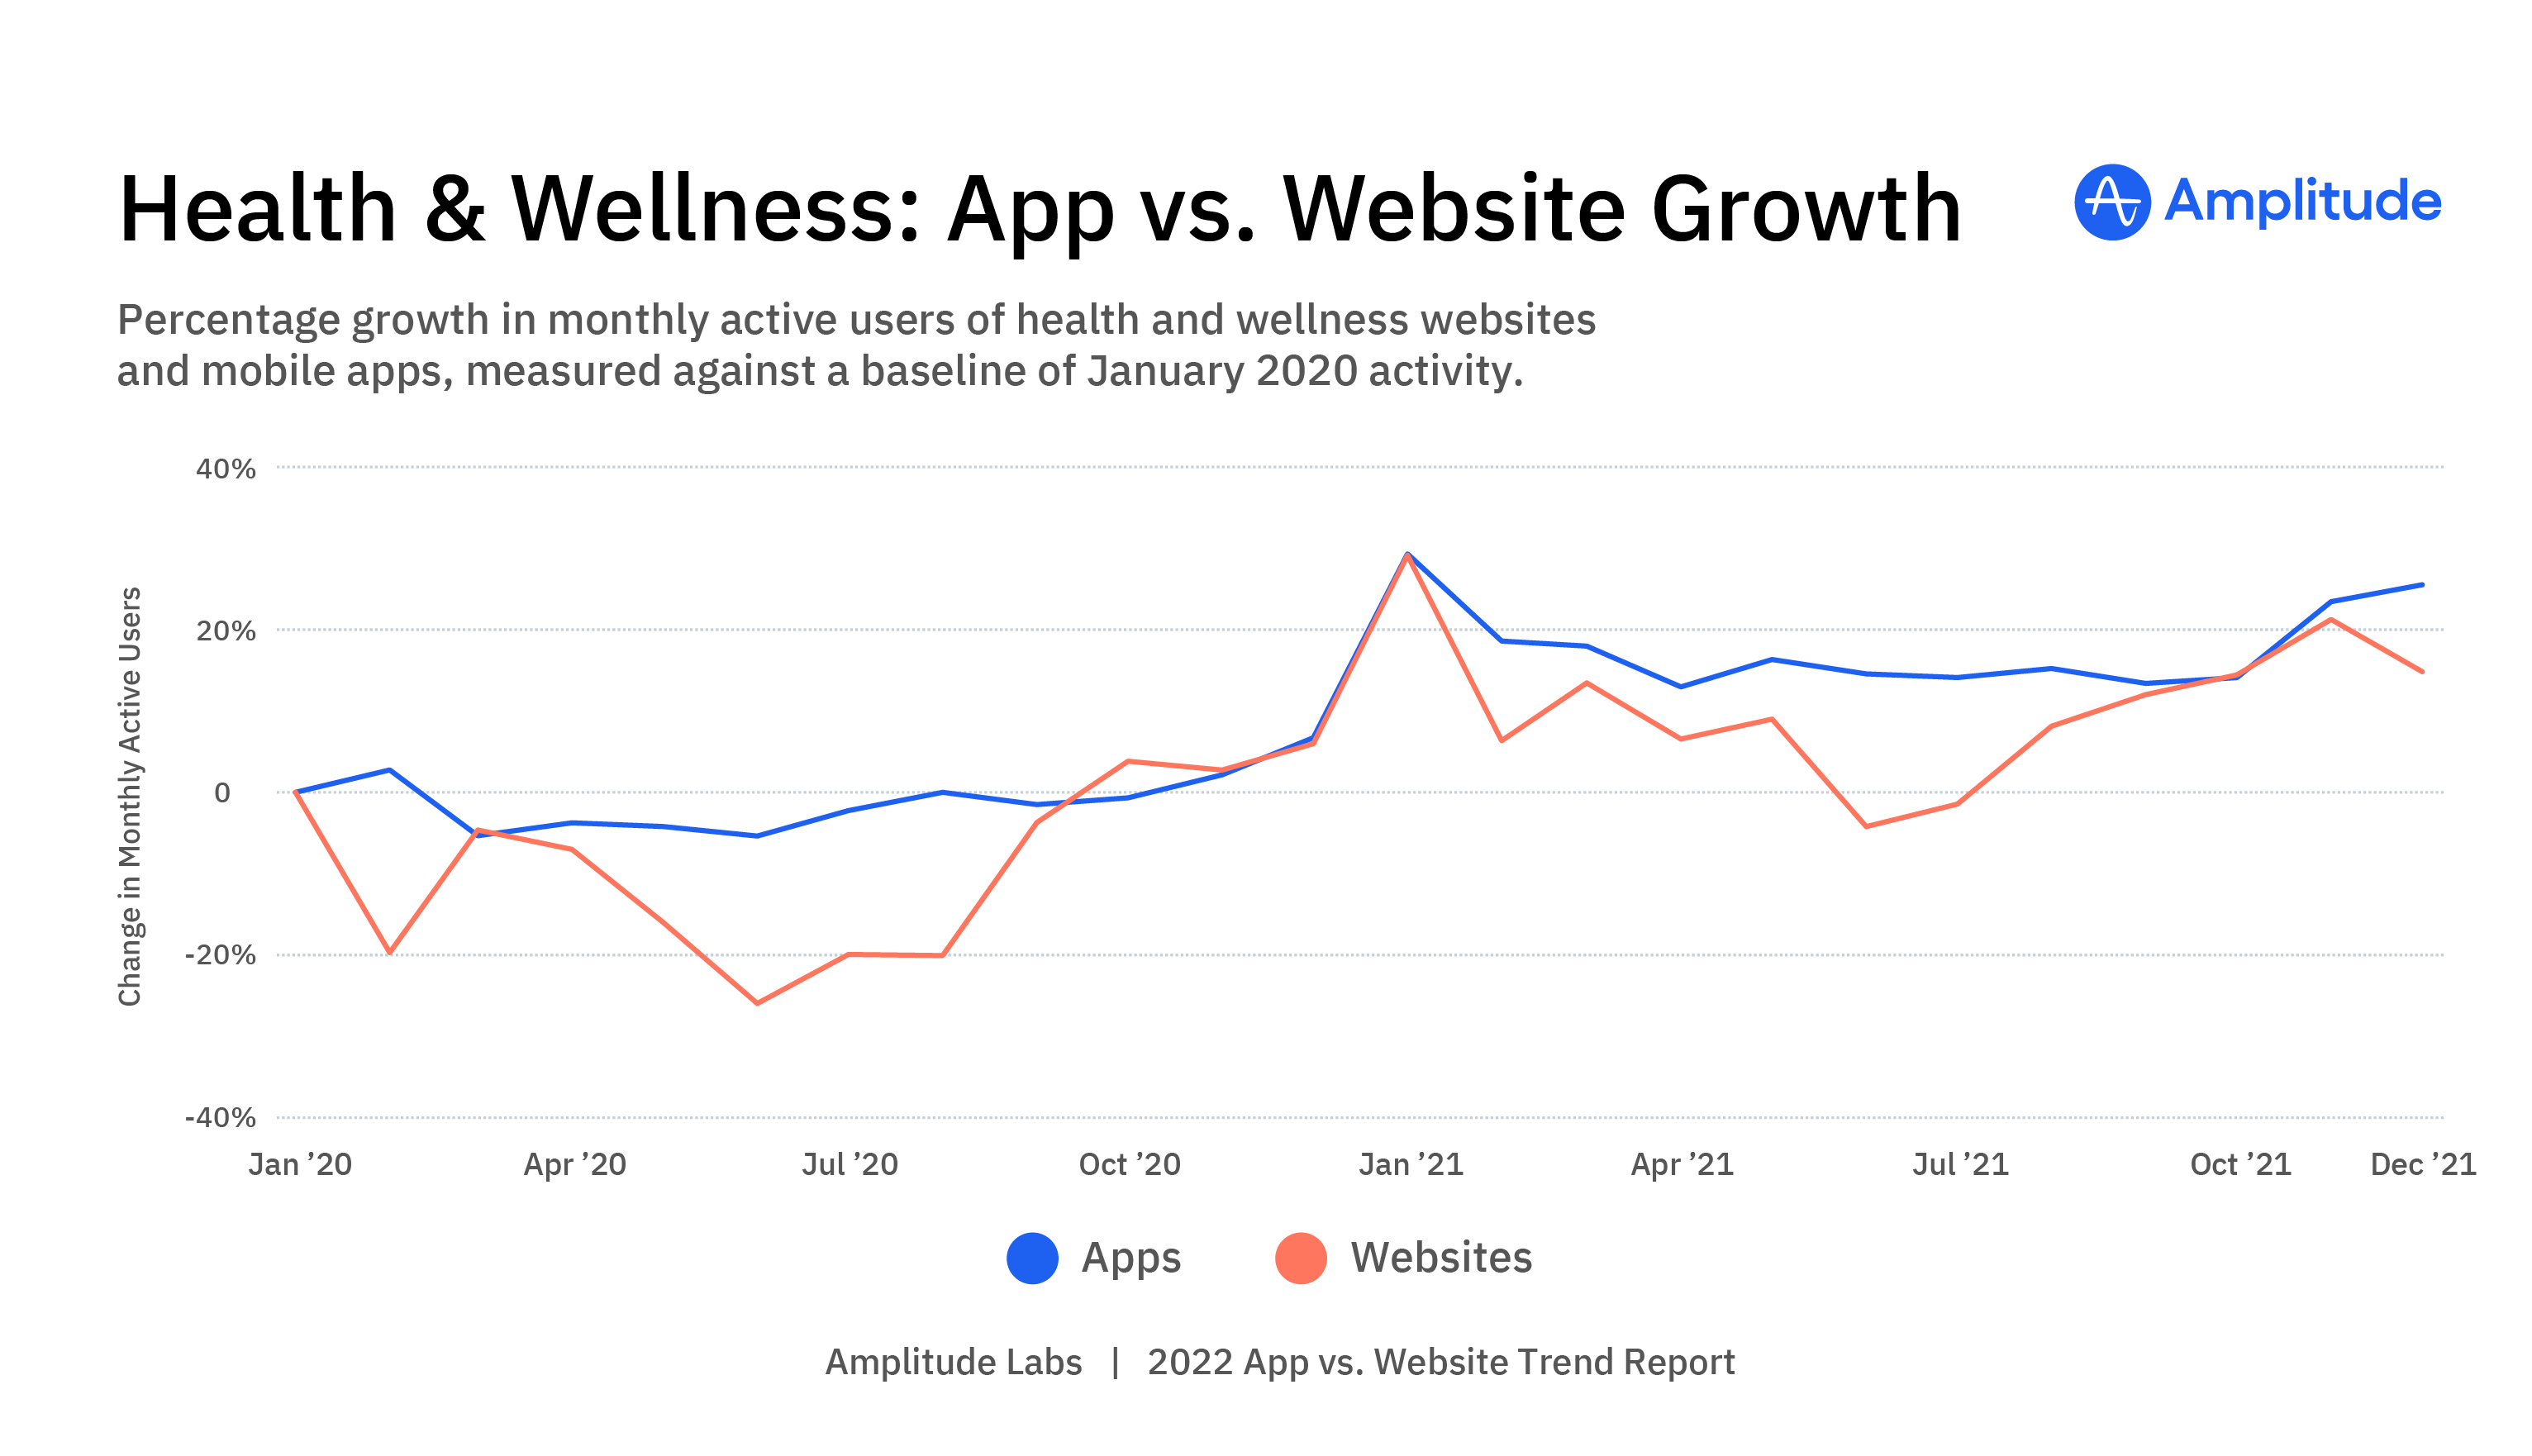
Health and Wellness: App vs. Website Growth
Ever met someone who made a New Year’s resolution to take better care of their health, then started full steam in January before tapering off and eventually giving up by spring? Yeah, we thought so. And our data shows they’re not alone. The growth of MAUs using health and wellness products on both apps and web peaked in January 2021, reaching a matching 29% growth against January 2020.
With "New Year’s Resolution Syndrome" in mind, we speculate that our January 2020 marker was likely a spike as well, which explains the subsequent below-zero dips for the next few months as resolutions fell by the wayside.
The growth rates of MAUs on apps surpassed those on web for all but four months of our two-year period; there was only one month (October 2020) in which web growth ranked more than one percentage point higher than app growth, at 4% higher.
As we’ve seen multiple times in our data, the growth of MAUs on web fluctuated much more wildly than did growth on apps. The growth of monthly active users accessing health and wellness tools on websites dipped seasonally, dropping in February against January, and again in the summer with a low point in June 2020 (-26% against January 2020) and again in June 2021 (-4% against January 2020). The growth of MAUs on apps did not match this summer dip, but rather dipped more mildly throughout the year against the most recent January. The January 2021 spike was the only time app and web growth rates lined up. This growth cooled back to 18% in February among app users and 6% among web users, and then rates in the 13-16% range against January 2020 until October 2021. Meanwhile, web growth stayed below 15% until October 2021.
By December 2021, the growth of MAUs on apps had grown 26% against January 2020, and those on web had grown 15% against January 2020.
Media and Entertainment
Small Screens Grow
Note: This category includes video and livestreaming, broadcast companies that provide entertainment programming, music labels, music streaming services, and other video and audio content for entertainment purposes.
Media and entertainment habits certainly evolved over the past two years. According to our data, monthly active users are more likely to choose websites over apps when kicking back with digital entertainment. In January 2020, 61% of all MAUs accessing video and audio content did so via websites, versus 39% on apps. We see strong growth in the popularity of both apps and websites, but app use for entertainment is growing more quickly: over our two-year data period, the number of MAUs using websites to access entertainment grew 22% against January 2020, while the number on apps grew 26%. By December 2021, 40% of all MAUs accessing entertainment did so via apps, versus 60% via websites.
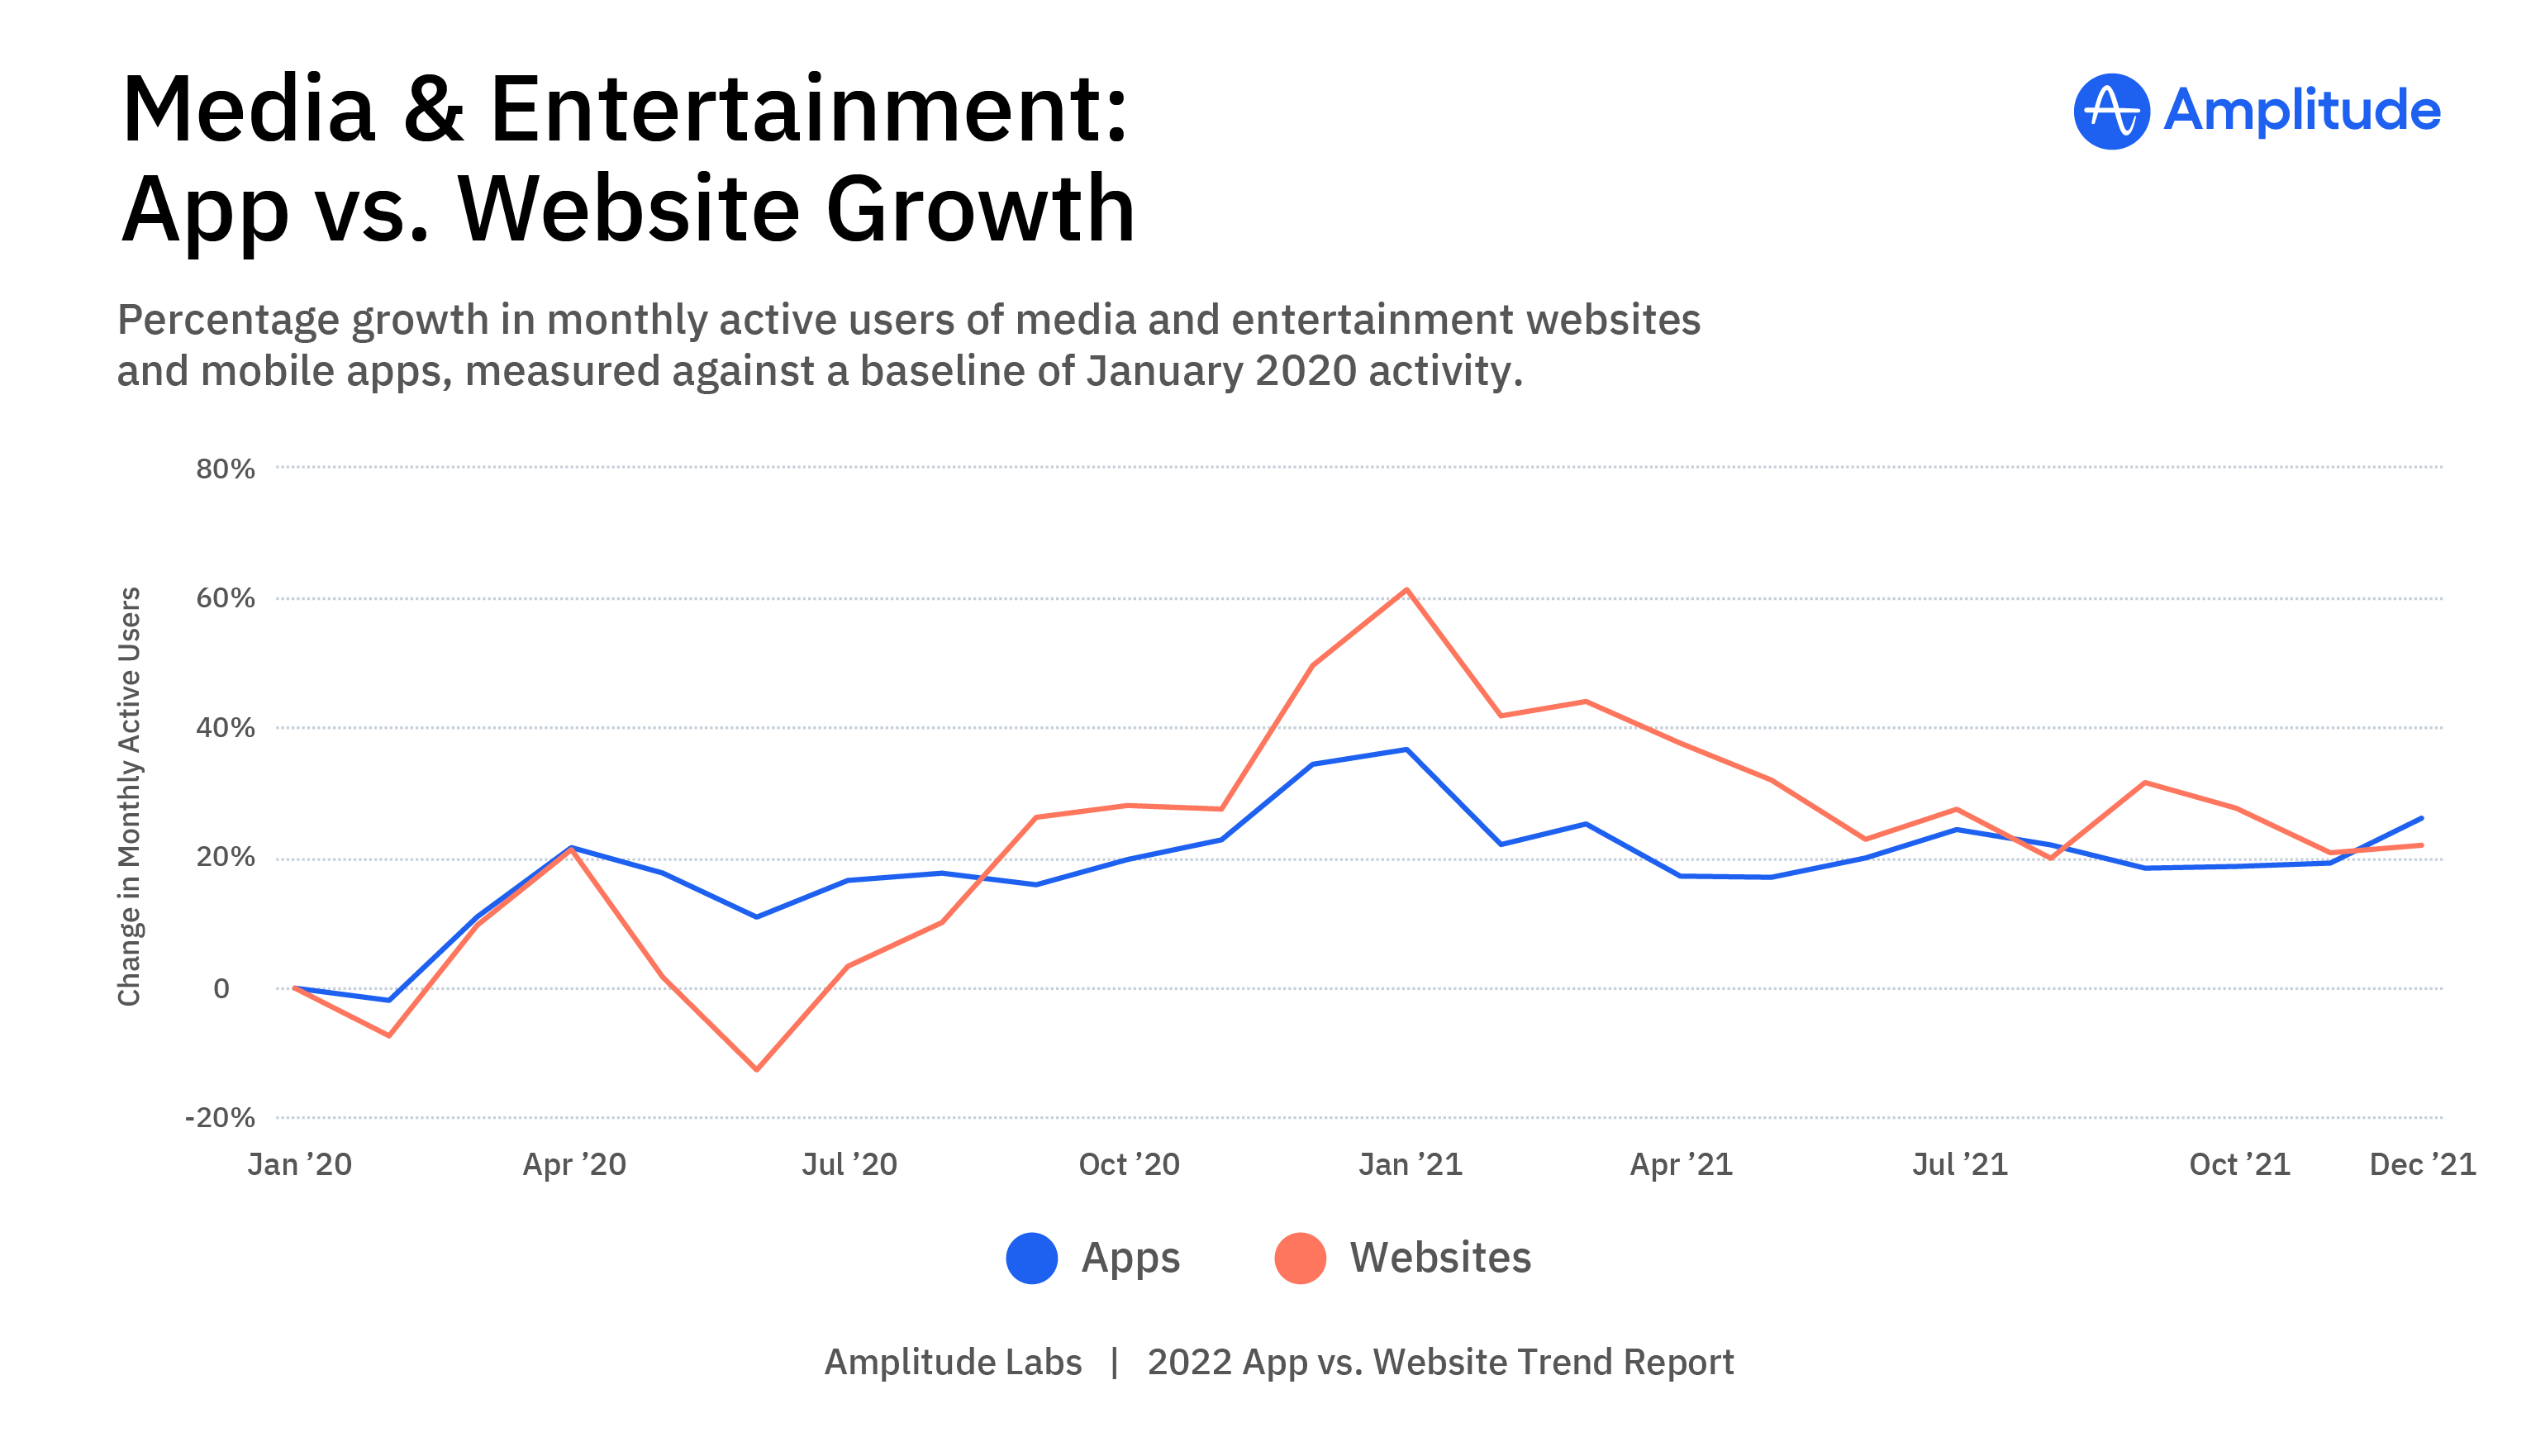
Media and Entertainment: App vs. Website Growth
In April of 2020, both app and web use for entertainment spiked, with a 21% increase in MAUs on web and 22% on app against January 2020. The growth in MAUs on apps remained in the double digits for the rest of the year, peaking over the winter holidays with 35% growth in December 2020 and 37% growth in January 2021 against January 2020. Throughout the rest of 2021, the percentage growth of MAUs on app held relatively steady from 17% to 26%.
Once again, we see more fluctuation among websites than on apps. After the spring 2020 spike, the growth in MAUs on web slowed significantly over the summer of 2020, with a low point of -13% in June 2020 against January 2020. However, demand then rebounded and growth climbed steadily to a high of 62% in January 2021 against January 2020. The growth of MAUs on web then cooled and aligned more closely with those on apps, ending the data period only slightly below app growth, at 23%.
B2B SaaS
Taking Care of Business
Note: This category includes a wide range of business-to-business software-as-a-service (B2B SaaS) products, including products used for communication, collaboration, project management, customer relationship management (CRM), customer communications management (CCM), data and analytics, design, SMB management, and workforce management.
MAUs consistently favor websites over apps when accessing B2B SaaS tools. In January 2020, 83% of all MAUs accessing B2B SaaS did so on web, versus 17% on apps. Growth on web outpaced growth on app by 4x: over our two-year data period, the number of MAUs choosing apps to access their B2B SaaS products grew 25% against January 2020, while the number on websites grew 100%. By December 2021, 88% of MAUs accessing B2B SaaS products were doing so via web, while those on apps dropped to 12%—the highest percentage of web use and lowest percentage of app use among all industries included in this report.
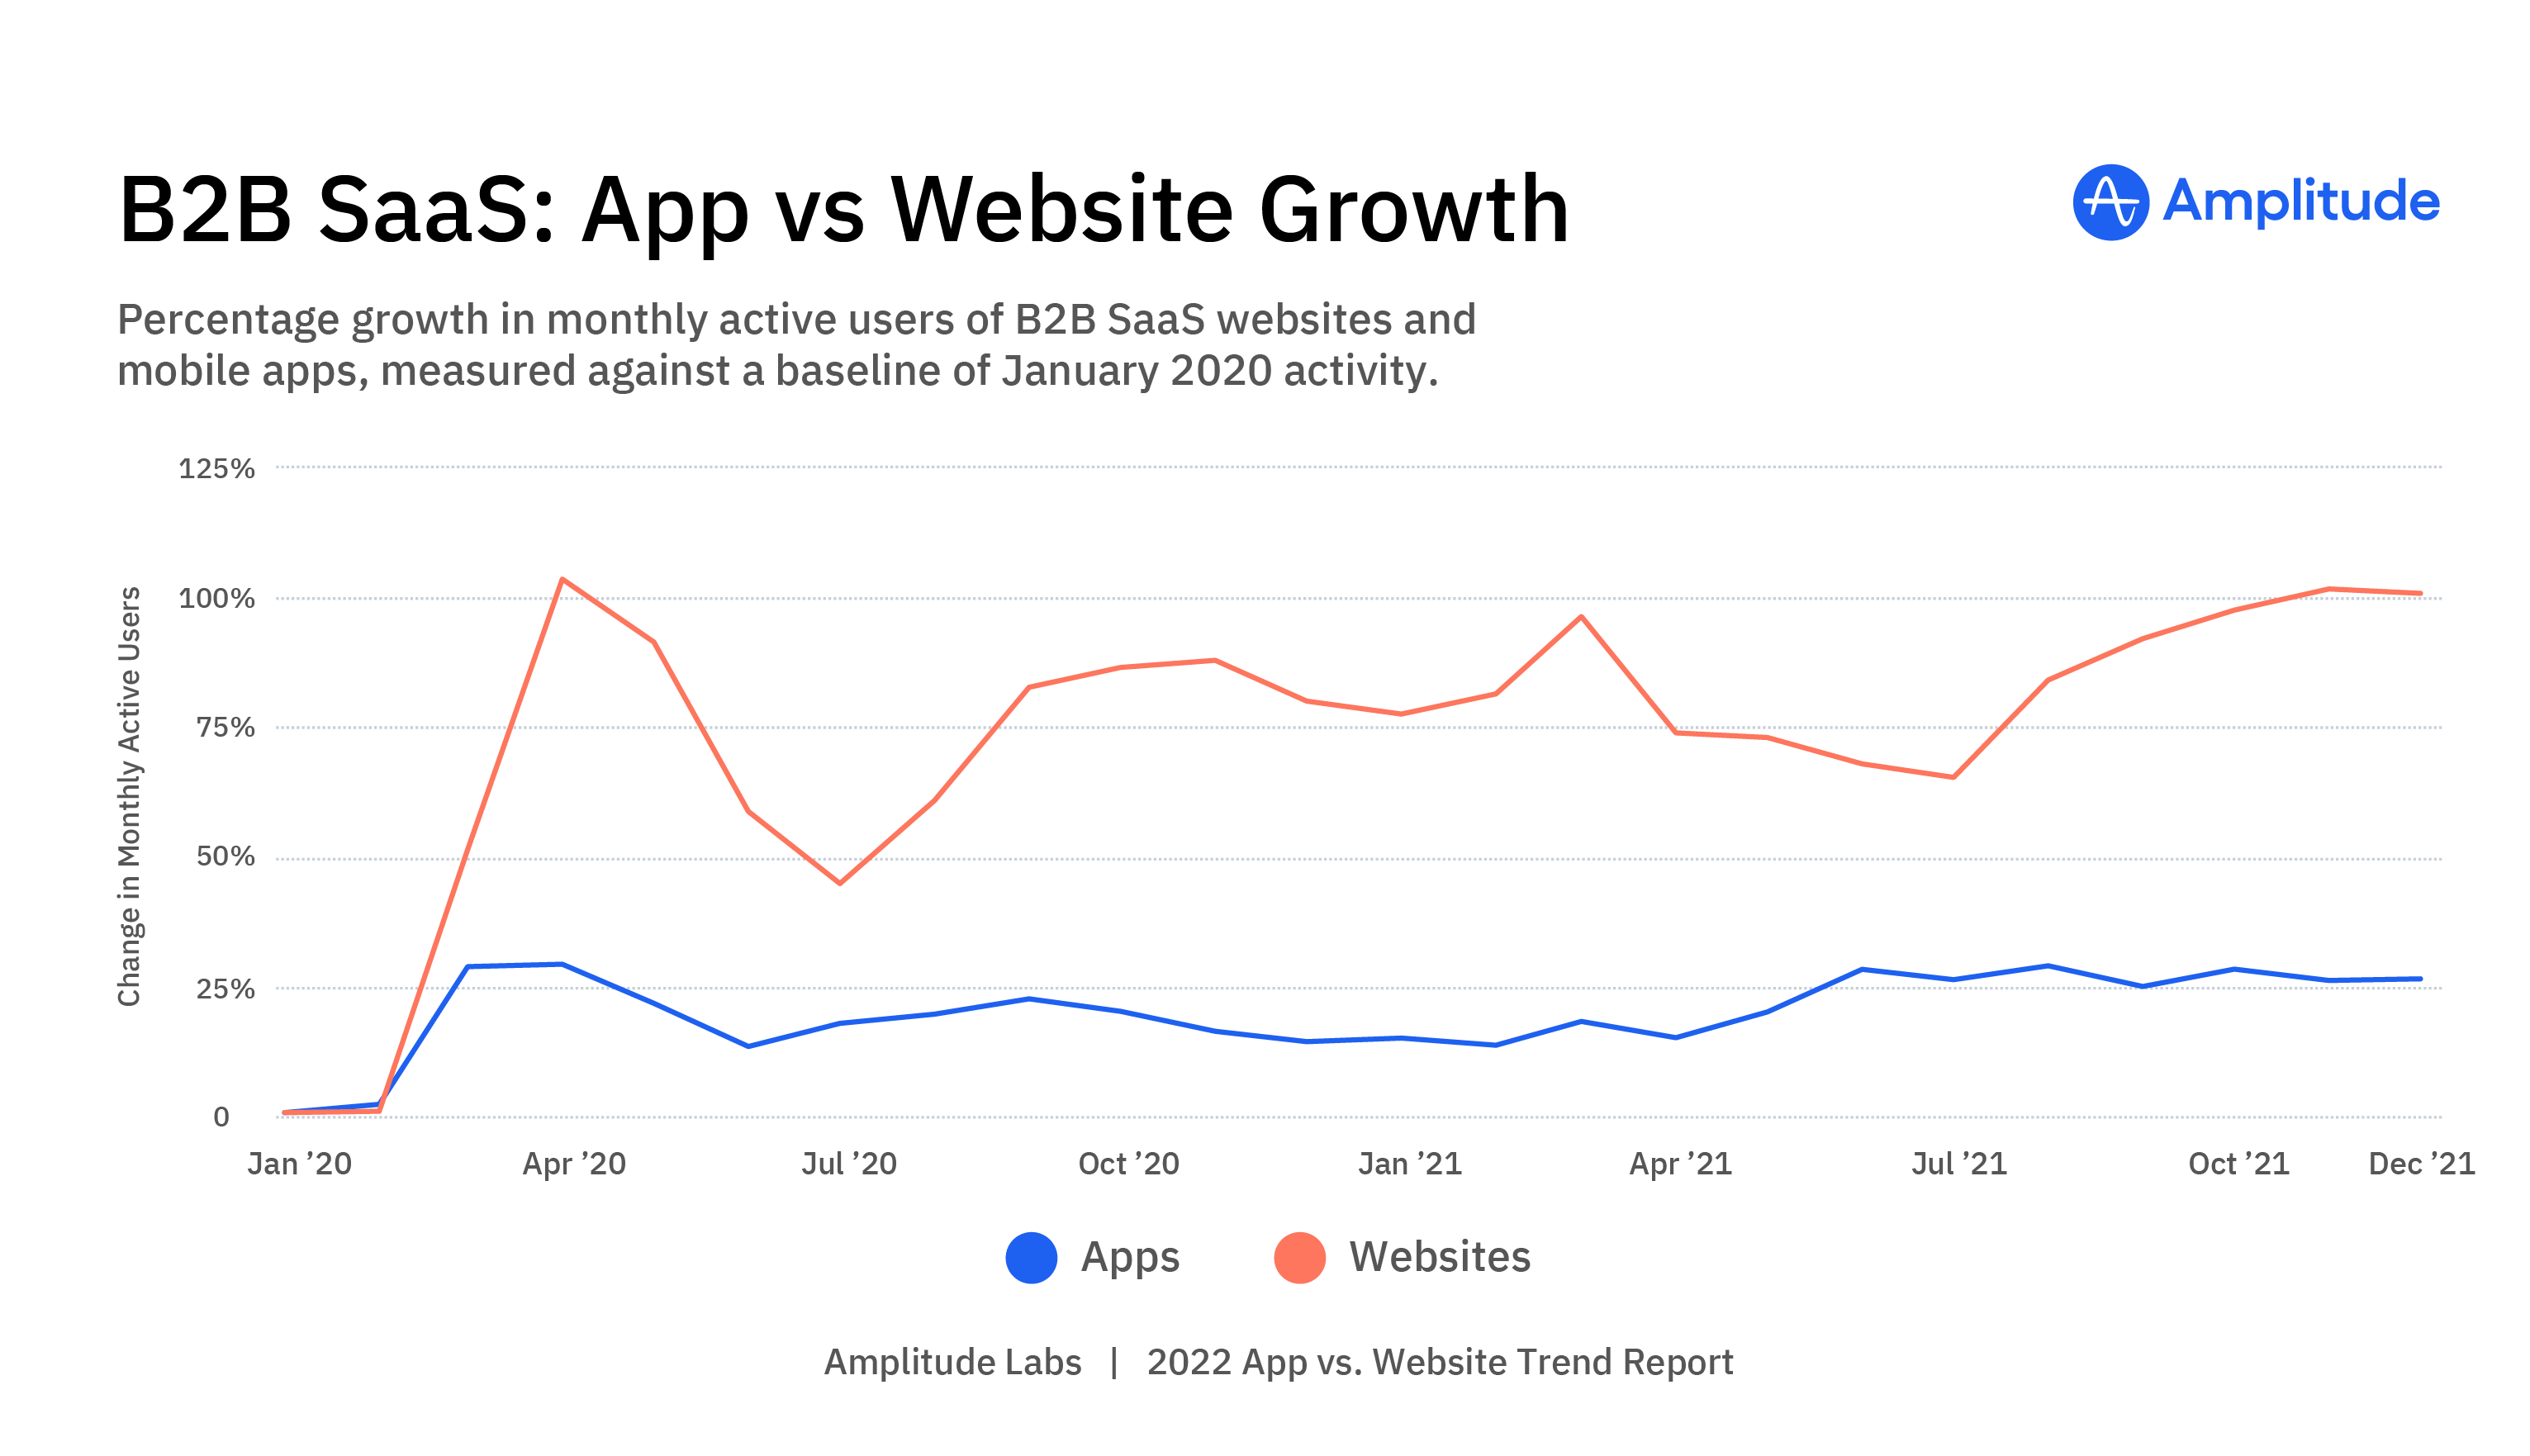
B2B SaaS: App vs. Website Growth
The growth of MAUs accessing B2B SaaS tools via apps shot up from 2% in February 2020 to 28% in March, and 29% in April against January 2020 data. The impressive one-month leap of 26 percentage points for app use pales in comparison to the bounds made by web use in that same timeframe: in March 2020, the growth of MAUs accessing B2B SaaS tools jumped 51 percentage points over zero growth in February 2020, followed by another 52 percentage points the following month. The result: by April 2020, the number of MAUs accessing B2B SaaS tools via web reached a dizzying height of 103% increase in growth in just two months.
Within a few months, the growth rate cooled for both app and web usage, but still remained in positive territory: in June, the growth of MAUs on apps hit a low of 13% against January 2020, and in July, the growth of MAUs on web hit a low of 44%. For the rest of the two-year data period, the growth of MAUs on apps meandered between 13% to 28% against January 2020, holding steady above 24% in the second half of 2021. Meanwhile, growth of web users was much more erratic, between 60% in August 2020 to 101% in November 2021. The only discernible pattern in web fluctuation is a general drop in the summer months, and steady growth in the fall.
App Growth by Country
App Growth Surges in 2021 across Regions
When we dig into our data broken out by five countries—United States, United Kingdom, France, Japan, and Singapore—we see similarities in the overall trend lines. All five countries underwent a pandemic bump of app users in the spring of 2020, with rates of growth of app MAUs increasing in March 2020. The U.K., France, and Singapore all had peaks in April 2020, hitting 36%, 19%, and 17% growth of MAUs on apps against January 2020, respectively. Growth cooled for all five countries in June 2020; for most countries it then climbed slowly again, but for the U.K. the cooldown lasted into September 2020. For all five countries, the rate of growth of MAUs on apps increased from September 2020 until January 2021. For most countries this January 2021 peak was followed by a dip, except for Singapore which continued to pick up speed, peaking at 47% at March and May of 2021.
In France, the 57% growth rate of MAUs on apps in January 2021 was the highest rate of growth against January 2020 during our data period. The U.K. hit a similar peak of 52% in January 2021. For the other three countries, the rate of growth among MAUs on apps eventually hit other peaks: Singapore peaked at 47% in March and May of 2021, while the growth among MAUs on apps peaked in the U.S. and Japan in December 2021, at 53% and 40% respectively.
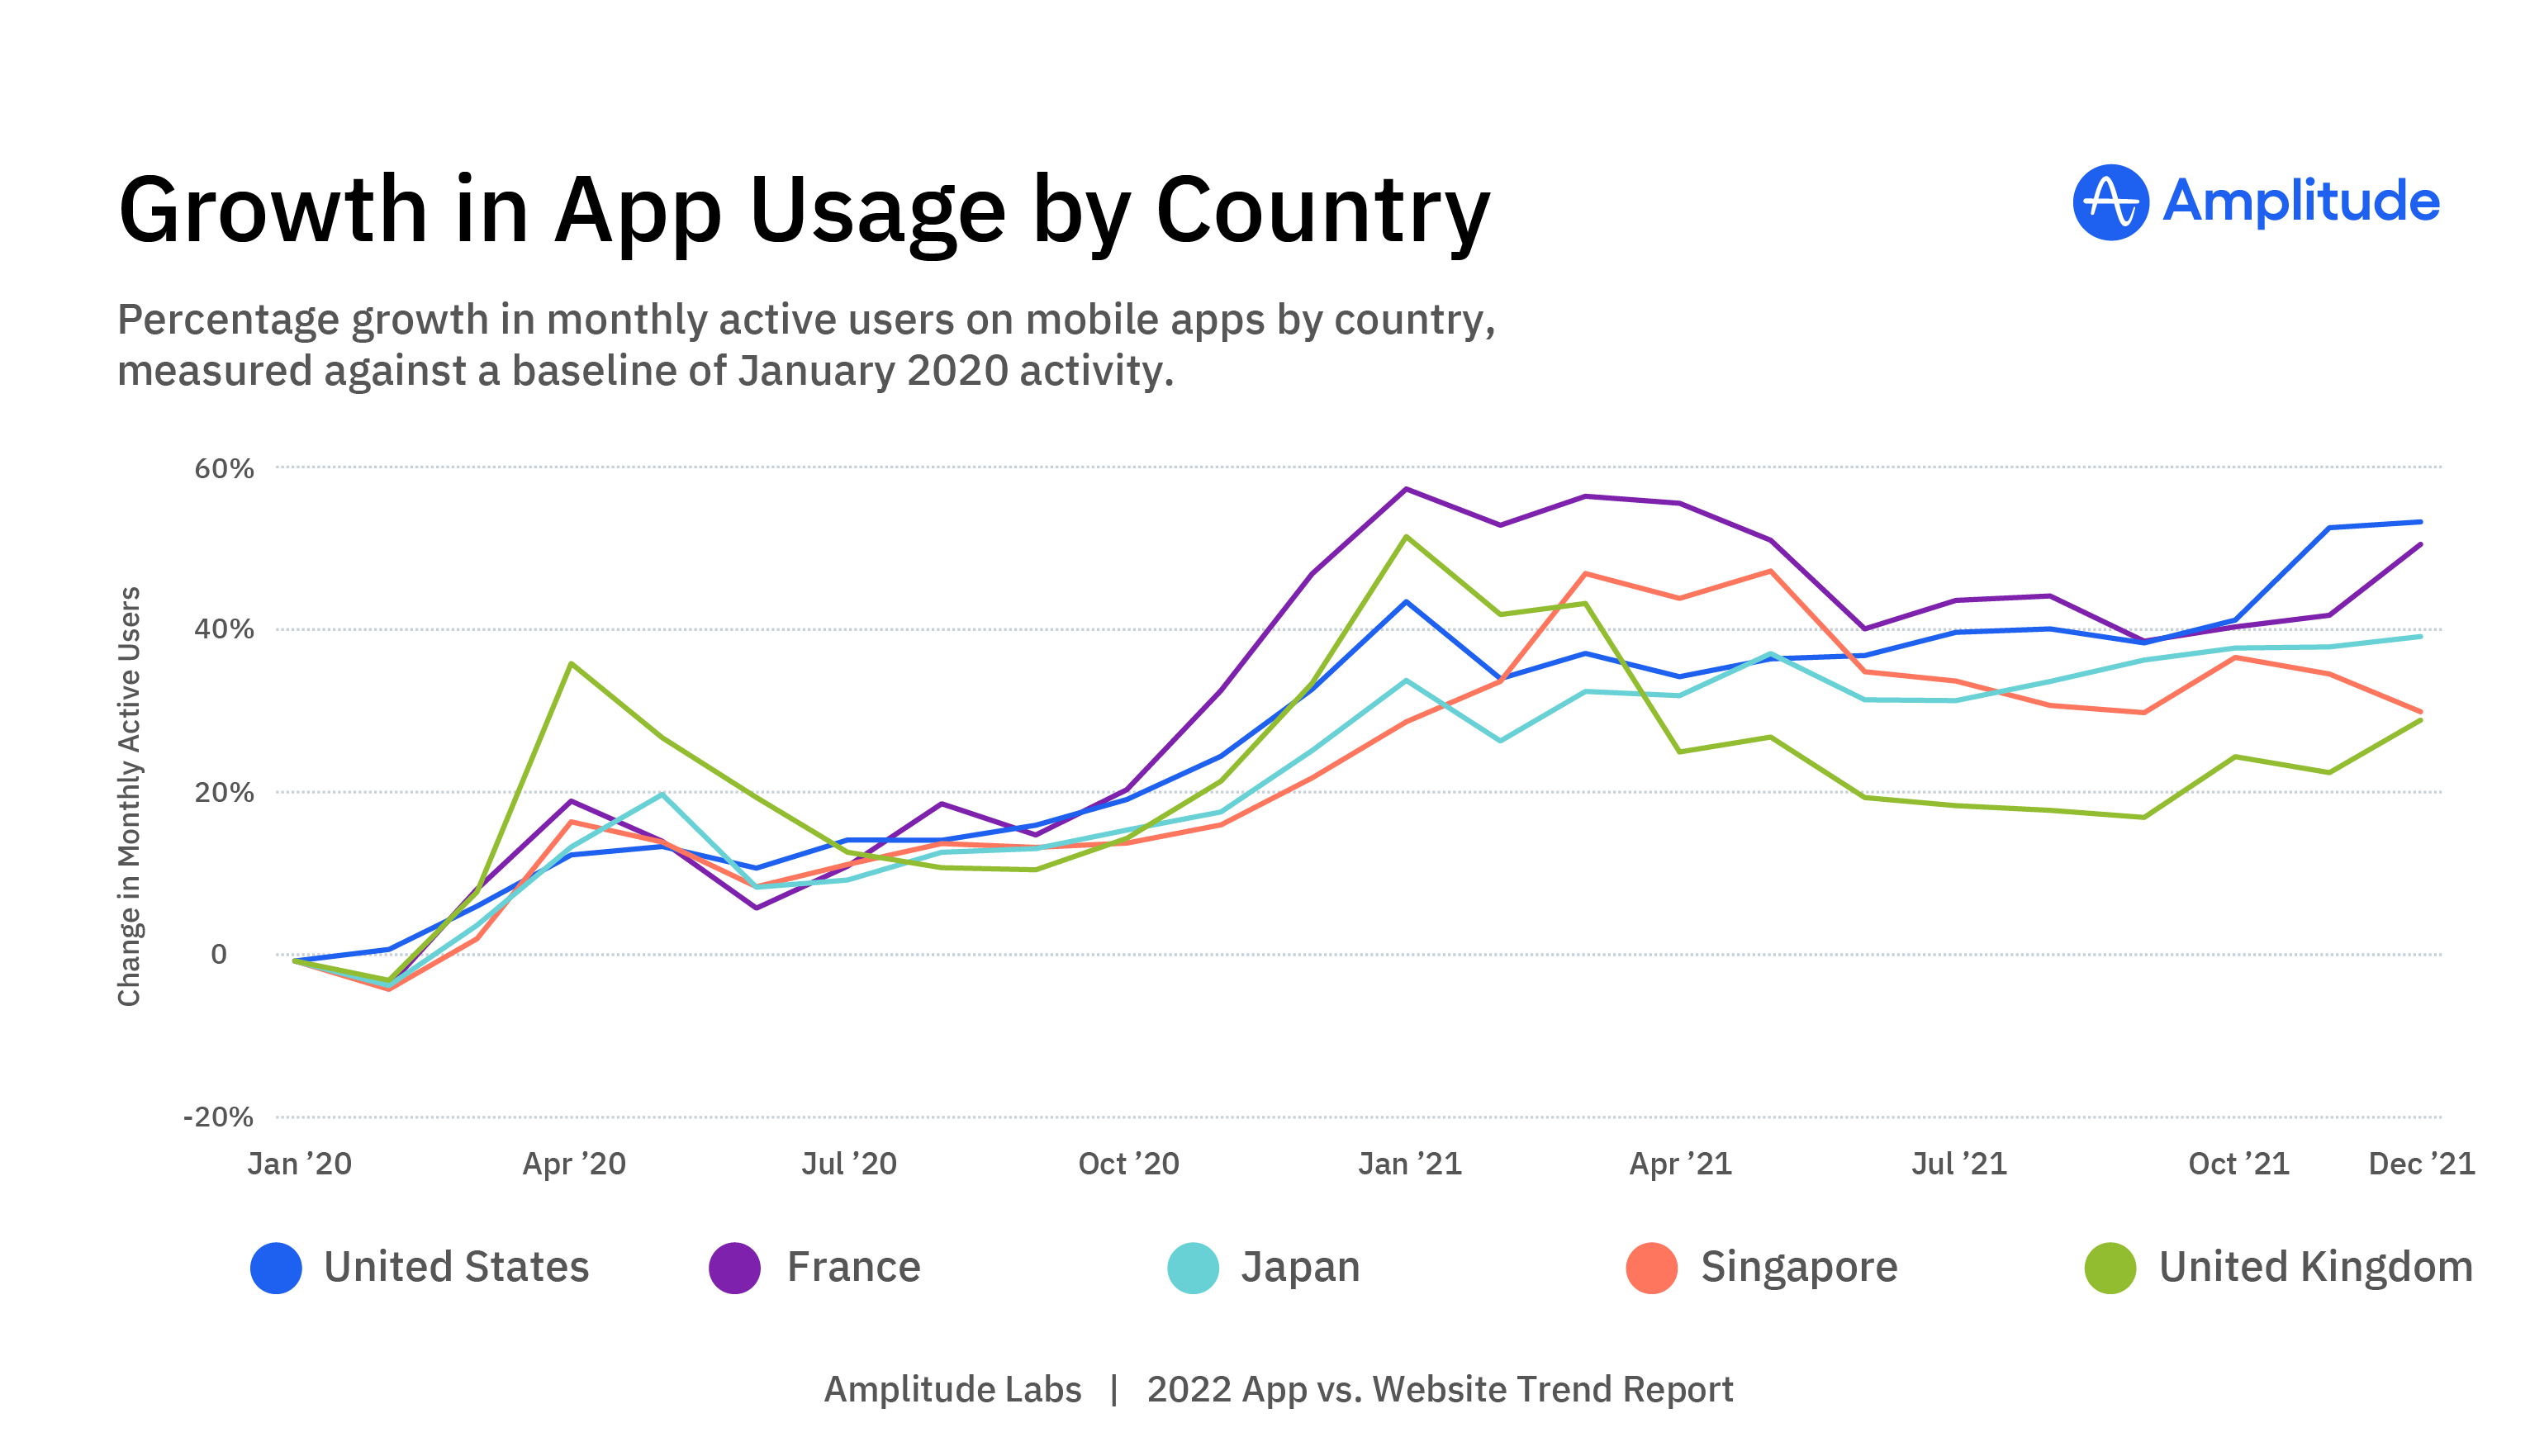
App Growth by Country
Web Growth by Country
Website Growth Is Highest in U.S., Japan, and Singapore
Looking at the growth of MAUs on web broken out by country, we see a more distributed pandemic bump in the spring of 2020. In March 2020, Singapore saw the greatest increase in growth of MAUs on web—20% against January 2020. This increased to 33% in May 2020 and hovered between 28% to 33% through October 2020; by December, growth reached 46%. The U.S. also experienced a pandemic surge that continued to grow. After hitting a mild 8% growth in March 2020, by May 2020 the U.S. hit 27% growth in MAUs on web against January 2020, finally hitting a 2020 peak of 60% growth in December.
In contrast to Singapore and the U.S.—both which roughly maintained their growth through the summer of 2020—France, the U.K., and Japan’s pandemic growth cooled down over the summer. In France, growth of MAUs on web peaked at 27% in April 2020 against January 2020, then cooled until August and September 2020 when it dropped to 2%. In the U.K., spring 2020 peaked at 21% growth in May 2020 before dropping to 8% in August; growth then rebounded as high as 46% in November 2020. In Japan, early pandemic growth peaked a bit later, at 20% in June 2020, before cooling down; growth continued to generally slide, eventually hitting a low of 4% in November 2020 against January 2020.
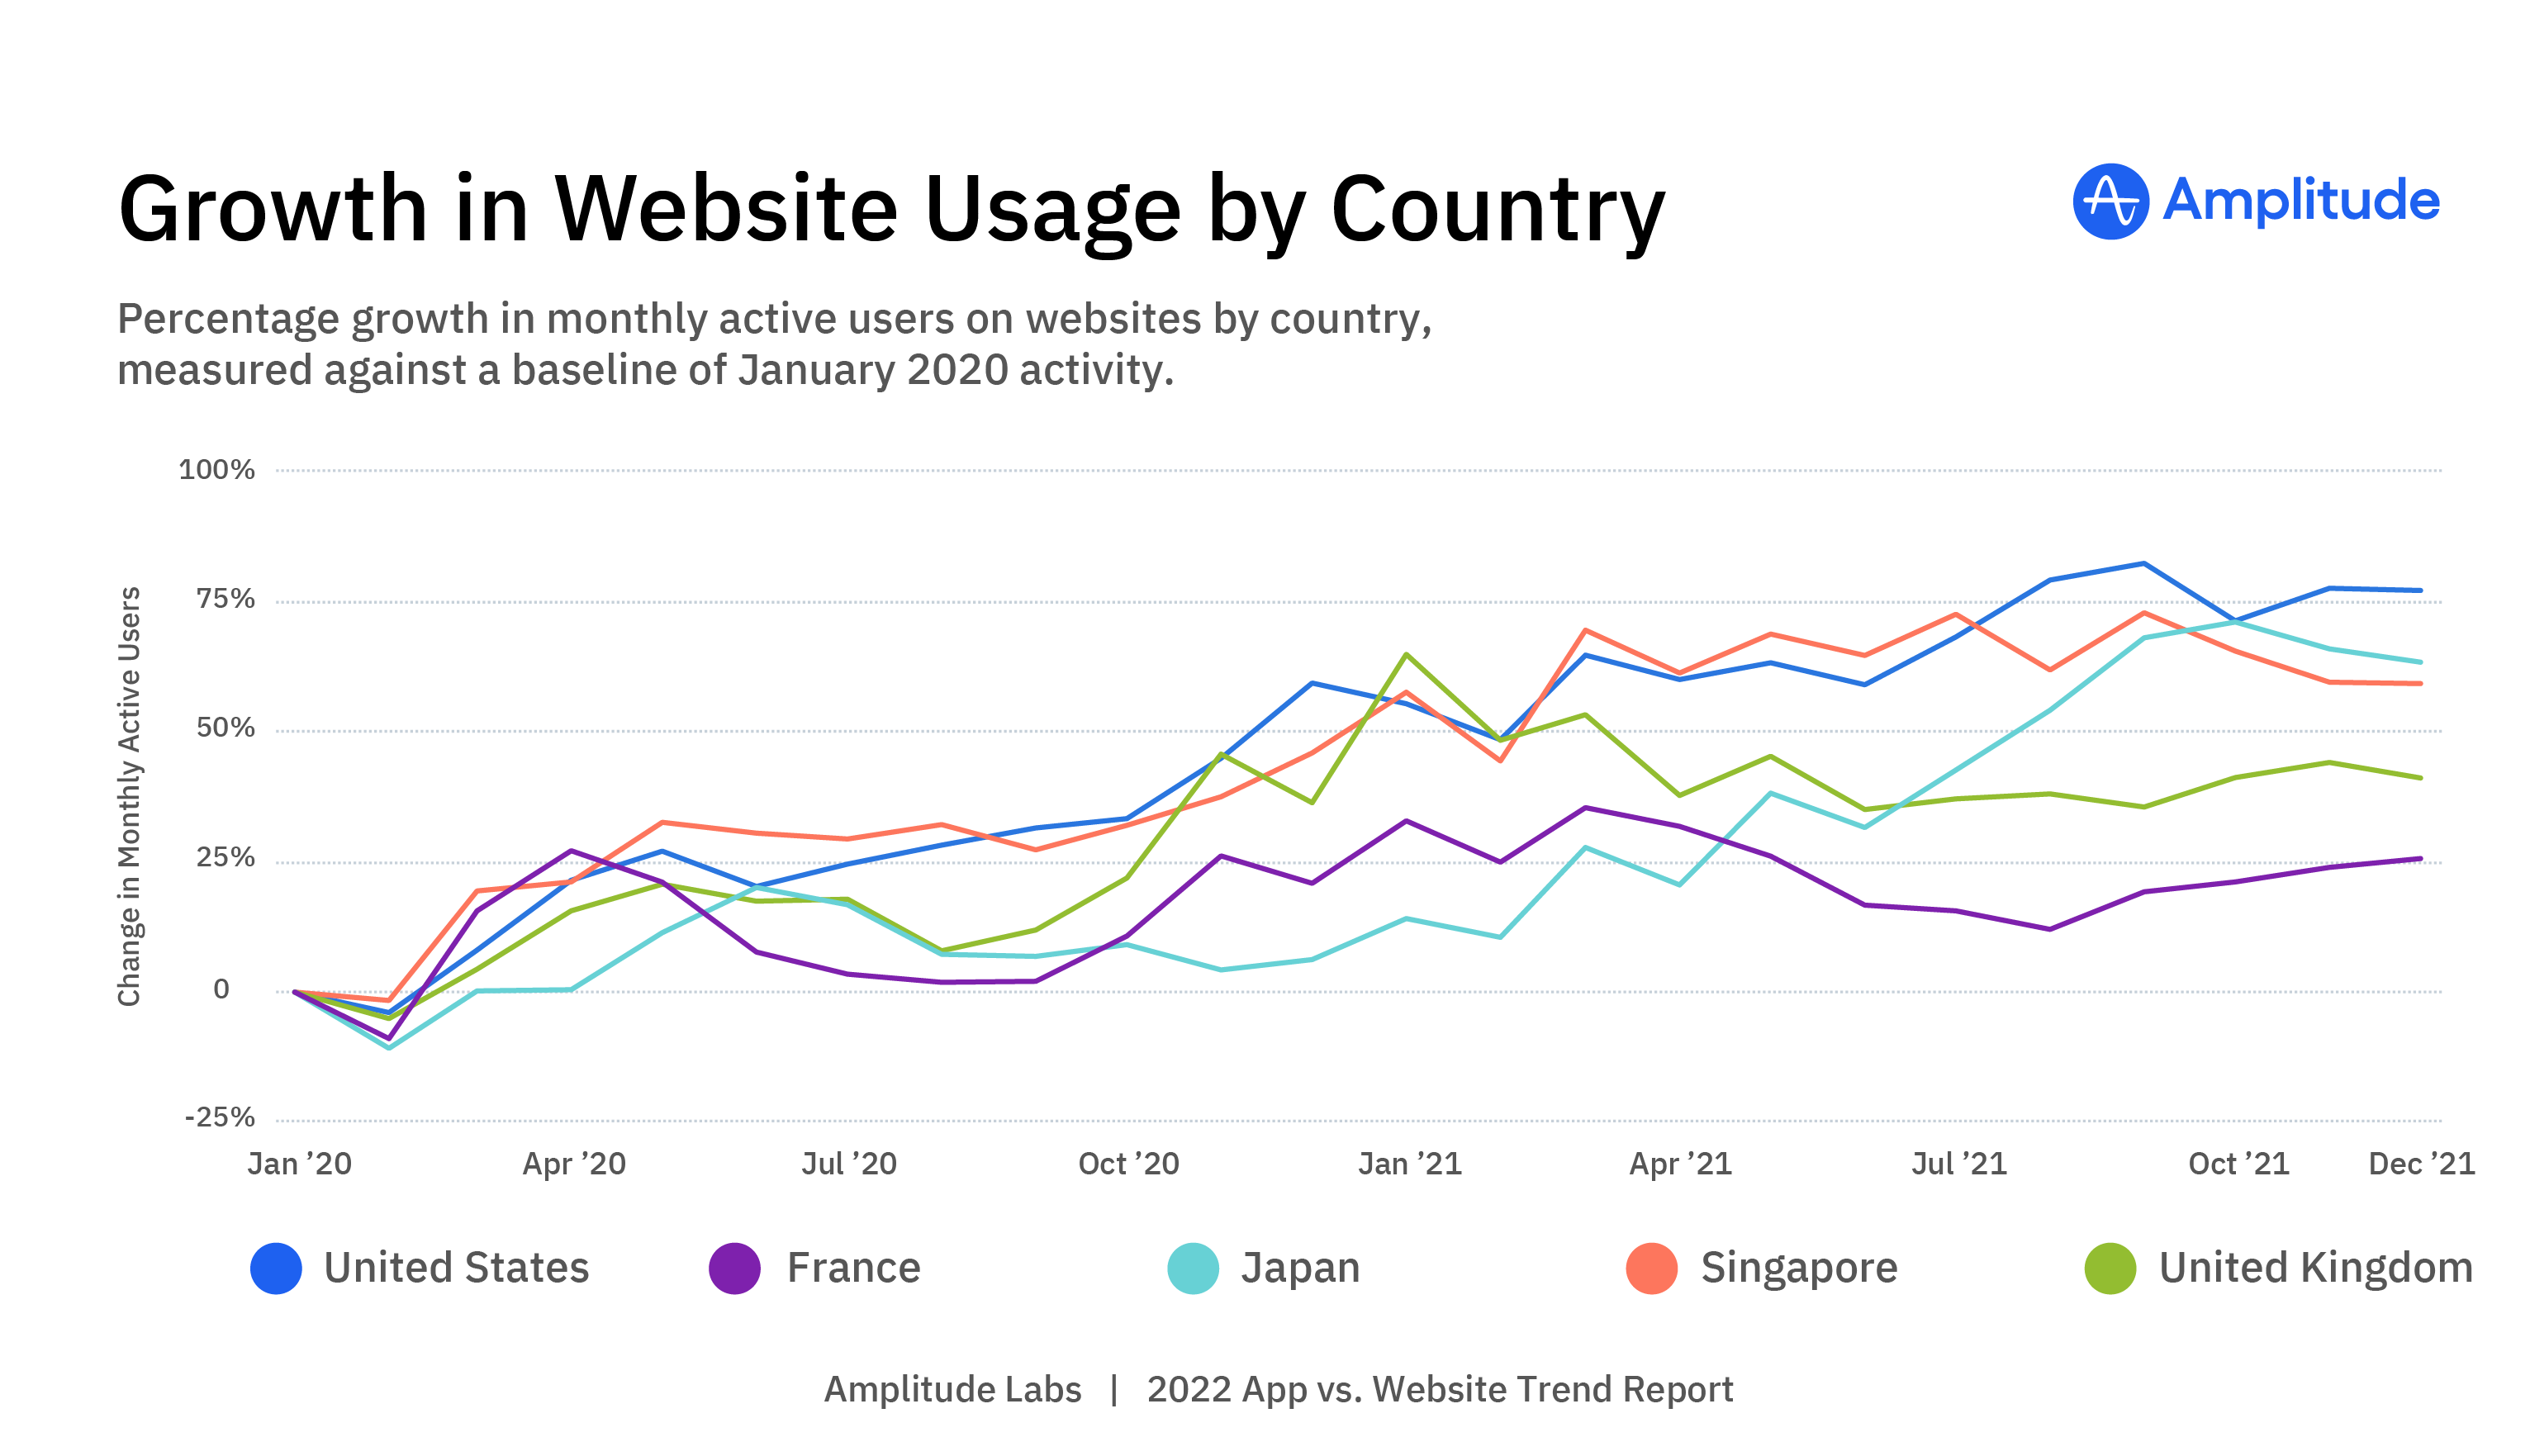
Website Growth by Country
In sharp contrast to the distinct peak of app growth for these five countries in January 2021, web growth in January 2021 was not too distinct from the other winter months preceding and following. In our second data year, Japan experienced the biggest change in growth of MAUs on web against January 2020; starting at 14% in January 2021, growth of MAUs on web got as high as 71% in October (57 percentage points higher) before landing at 64% in December 2021.
The U.S. ended the two-year data period with the highest rate of growth: the rate of growth among MAUs on web in the U.S. peaked at 83% in September 2021, ending the year at 78%. Singapore peaked at 73% growth in MAUs on web in both July and September 2021 before ending the data period at 60% growth against January 2020. Japan peaked at 71% in September and October 2021 before landing at 64% that same December. The U.K. ended the data period with 41% growth in MAUs on web against January 2020, and for France, that number was 26%.
Conclusion
You may have heard that apps are taking over, but the data shows that websites are growing fast—and in some cases at higher rates than apps. When it comes to the question, "What should we invest in, the app or the website?" the answer is a resounding "both." Web’s not dead, by any stretch of the imagination.
On top of that, the growth in digital activity over the last two years means that companies with digital products have even more touch-points with the customer and more first-party data available to them. Leveraging this information to build a seamless digital experience is mission-critical for any forward-thinking company. After all, every touchpoint with the customer is an opportunity to drive engagement, retention, and growth. When it comes to strategy and investments, you can’t ignore one of your most utilized products: the website.
To truly embrace product-led growth, your company needs to see the customer journey as a unified experience. It’s app and web, not just one or the other.
To continue your learning about product-led growth, attend an Amplitude workshop or read a related guide: