
If you’re in the mobile app business, you’ve probably heard this statistic—that 80% of mobile app users churn after just 3 days, and that the average app loses all of their new users within a month.
Today, we’re announcing that these retention findings may, in fact, be inaccurate for the vast majority of apps in the industry. Amplitude has now tracked over 1 trillion user actions across 500 million devices. After analyzing our customer data, we’ve discovered the standard industry method of calculating retention grossly underestimates retention numbers, suggesting that the future of apps isn’t as grim as it was made out to be. Now, we want to share these insights with you.
‘N day’ retention underestimates metric by 3.5x
The most familiar method of measuring retention, and the current industry standard for most apps, is ‘N day retention.’ N day retention measures how many users come back to your product on a specific day.
Earlier this year, Quettra’s study of 125M Android devices used this specific retention metric to show that in just 3 months, the average app loses 95% of their daily active users; that is, by D90, only 5% of users are retained.
In contrast, we’ve found that N day retention actually underestimates the percentage of users who return to apps over time by a factor of 3.5x.
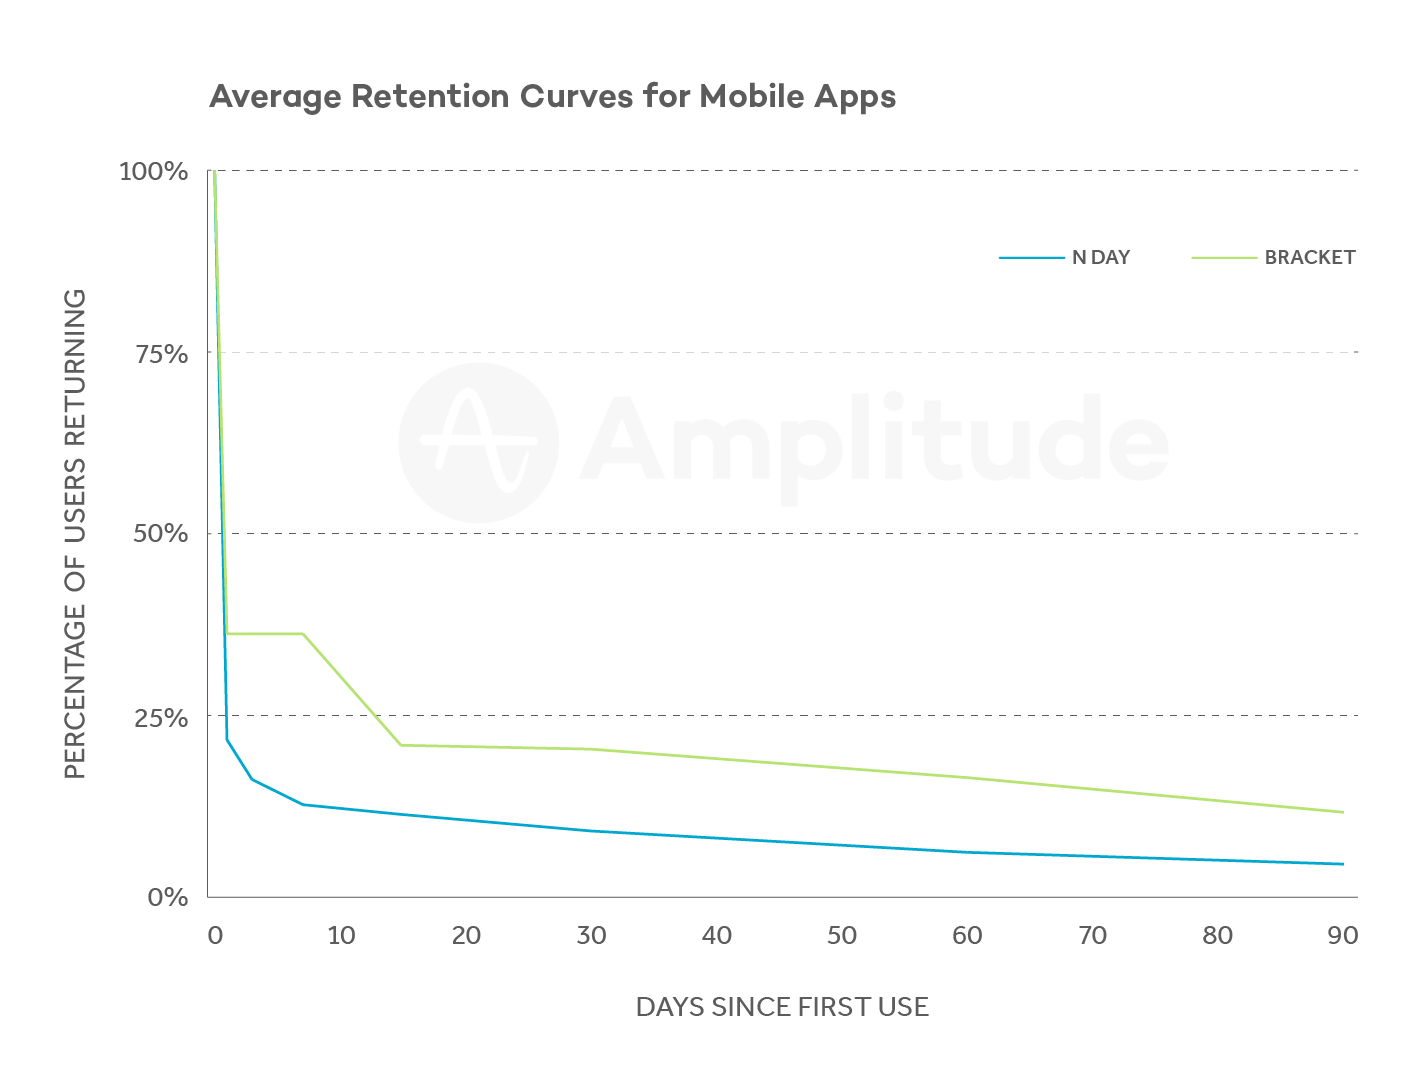
The problem with N day retention is that it only measures the percentage of users that return on that single, arbitrary day. Our study of retention data from 500 million mobile devices shows that user retention numbers are much higher if companies investigate the proportion of users who return within a **certain bracket of time. **As the graph shows:
- Retention rates were 1.5 to 3.5X higher than industry averages reported using ‘N day’ retention.
- 23% of mobile app users return between days 15-30 after first use and 20% returned between days 31-60. When looking at the same data set using ‘N Day’ retention, we found that only 8% of users returned on Day 30 and only about 6% on Day 60.
Bracket retention is a better method of measuring user engagement
N day retention only makes sense if an extremely large proportion of your users come back every single day–think apps like Snapchat or Facebook or any successful casual gaming app. However, for products that aren’t necessarily intended for daily usage, N day retention is a misleading indicator of product usage and health.
Instead, companies should set custom retention metrics based on the way people naturally use their product. Says Pinterest’s engineering manager for growth John Egan, “If your site or app is truly visited on a daily basis, measuring ‘N Day’ retention makes sense. Because this isn’t the case for most, companies need to choose retention metrics that fit their product.”
Instead of N Day retention, Pinterest looks at what we’re calling bracket retention: the proportion of users that return to your product within a certain period of time. Pinterest looks at the proportion of users who come back between Day 1 and Day 7, as well as the proportion of users who come back between Day 28 and Day 35.
“The time windows for retention that you care about will vary depending on your product,” explains Egan. On-demand delivery or e-commerce apps most likely see their users coming back on a weekly, biweekly, or even monthly basis, for example. Meditation app Calm found their users typically came back to their app on a week-to-week cadence.
If these apps look only at retention on some arbitrary day N, they exclude the proportion users who come back on any other day and thus underestimate their overall product usage. Every company’s retention metrics need to reflect the way people use their product; otherwise, product and marketing teams end up making misinformed decisions with the wrong data. Amplitude’s ‘bracket retention’ feature allows companies to customize retention metrics for their unique situation.
Introducing Amplitude 2.0: product analytics for your whole company
We’ve said this a lot at Amplitude: businesses cannot sustain growth without user retention, and retention only comes when your product continuously delights users. User retention is one solid way of quantifying the relationship between your product and your users. That’s why our customers send us event data–as a means to understand their users and, as a result, build an even better product.
The most successful companies win by building products shaped by user behavior–from companies like Facebook to established enterprises like Intuit. However, too many companies still rely on intuition and conjecture, not data, to inform their product development. Why aren’t all companies building products informed by user behavior? Because when product managers, engineers, and designers have product questions they want answered, they simply don’t have access to insights that will help them understand users’ needs.
That’s why we’ve completely rebuilt Amplitude from the ground up. Today, we’re announcing the release of Amplitude 2.0. Over the past several months, we’ve completely rebuilt our user experience, with a focus on making it easy for anyone to access the data they need, discover insights, and share across teams.
We wanted to make data easy to interpret and explore for people who are analytics beginners, but also provide new depth for analytics experts by:
- Making charts and dashboards easy to interpret and share
- Reducing time to insight
- Integrating with Slack to facilitate better collaboration and discussion
In this post, I share my thoughts abut why the way we define (and ultimately build) products is changing, including the full story behind why we decided to build Amplitude 2.0, so stay on the lookout for that. I’ll also be sharing lessons I’ve learned in this journey to 1 trillion events at our webinar, so be sure to join me there.
We’re grateful to the dozens of beta customers who have been trying out Amplitude 2.0 throughout the development process, providing us invaluable feedback and direction.
Amplitude 2.0 is currently available to our Enterprise customers. General access will roll out to the rest of our customer base in December.