Practical frameworks and strategies for teams building better products and experiences.
How we rebuilt our software pipeline with AI, 3x’d our PRs with the same team, and cut PR cycle time to under an hour.
Learn the secrets behind how the world’s best products grow—and how your product compares. Get proven growth and retention strategies for breakout success.
Discover the six most critical AI trends reshaping how executives build, market, and scale digital products. Cut through the AI noise and take action today.
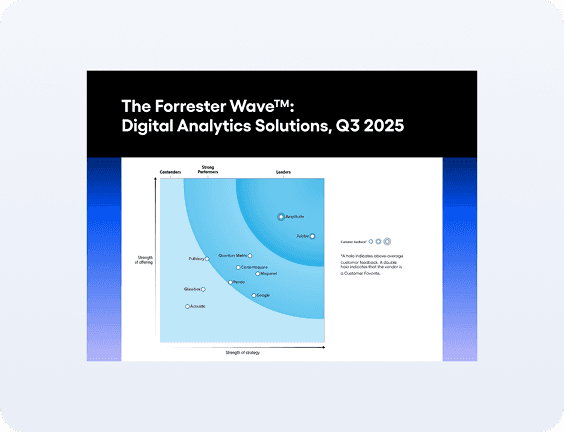
Learn what to look for in an analytics platform to win in the AI era. Get specific use cases and questions to guide your evaluation.
Explore the purpose and value of the North Star Framework. Get expert tips to define and integrate your North Star Metric into your organization.
Amplitude gives teams self-service visibility into the entire customer journey. Explore Amplitude today to go from data to insight to action.
Measure what matters in the AI era. Discover 14 product metrics to track across the customer journey and how to calculate them.
Get our interactive workbook with worksheets, videos, and real-life examples on how to foster product engagement and keep users coming back again and again.
If you care about growth, then you should care about user retention. Learn how to develop and implement a user retention strategy to reduce customer churn and boost lifetime value.
Get PLG fundamentals from industry experts. Learn about the product-led customer journey, what environment and team is needed, and how to adopt PLG.
Get expert insights into PLG tactics and metrics. Learn how to drive and track product-led acquisition, retention, and monetization.
Get an overview of how Amplitude’s AI analytics platform helps product teams 10x their productivity and build better products.
Discover a framework for measuring what matters across the customer journey. Get 20+ metrics that meet the needs of modern marketers.
Learn how to use AI to personalize customer experiences at scale. Get six AI-first strategies to meet customer expectations and drive growth.
Learn how to calculate and improve LTV with a framework for building lasting customer relationships. Get the step-by-step handbook.
Get three worksheets to improve your AI-powered marketing strategy. Discover hands-on templates for experimentation, personalization, and growth.
Get an overview of how Amplitude’s AI analytics platform helps marketers go from leads to long-term value and customer loyalty.