Avoiding the Analytics Freak Out
Knowing where to start with analytics can be overwhelming. To help you on your journey, we’ve created the guide to help you focus on what really matters.
The Freakouts


“I’ll need every question matrixed across every dimension…so, like 24,980,230.”

“We need a thousand-line, fifty-column event spreadsheet…stat. Oh wait. Not that. Do it again.”

“I’ve sent an invite to twenty people to build consensus on these KPIs…by next year.”
“I spoke with an analyst and all she could talk about was questions, questions, questions.”


#1 Question Quandary
Instead: Treat questions as a tool to figure out what to track. Not as a spec exercise.
The Freak Out
Someone has told you that you need to document every question you want to answer in a spreadsheet—row after row of questions. There is no end in sight. You're worrying about how much time this will take. You're worrying about how thorough you'll need to be. You're freaking out.
In Reality
Considering the questions you want to answer with an analytics product is helpful. It's worth spending some time thinking about questions.
But not for the reason people think.
People think the goal is to document all the questions you want to answer. Instead, the goal is to generate enough questions to help identify what events and event properties to track. You are using questions to
surface the nouns, verbs, adjectives, and adverbs that matter.
Example
Here's a team brainstorming questions.
Person A
"I want to see how many bookings happened yesterday!"
Person B
"Yeah, that would be cool. What if I could see the grouped by country?"
Person C
"And then maybe divide them up by the $ value of the booking, in buckets?"
Person D
"Right, I'd be curious if our higher membership tiers make higher dollar bookings!"
This conversation seems de-focused, but it is precisely the type of conversation we want to be having. Why? You could spend endless hours detailing every question and never scratch the surface of "all" of your questions. Instead, this team is rapidly exploring key actions and properties. The crucial part in this example is that we need to track bookings, the customer's country, the booking's dollar value, and the membership tier at the time of the booking. That's what is important!
Do this tomorrow
- Set up a relaxed session with your team and riff on a couple of scenarios like the one above. It can help to have your product right in front of you.
- Generate questions or areas of curiosity. Time-box it. Take careful notes but don't use a spreadsheet.
- Extract out the nouns, verbs, adjectives, and adverbs that really matter.

“Tell me all the events you need, aaaaaall the events. Like we're talking thousands.”


#2 Endless Events
Instead: Start with your core events. More is rarely better.
The Freak Out
Someone has told you to document all the events and event properties you need to track—all of them. You're looking at your product and can imagine an endless list of events. You are worried that If you don't get them documented, engineering will not even touch the project. You're overwhelmed and don't know where to start—torn between painstakingly documenting thousands of events or just giving up."
In Reality
Not all events and properties are created equal. Some events deserve a lot of scrutiny and care. If you stress about them, people will love you and thank you for your hard work. If you don't, people will distrust the data and throw their hands up in utter dismay.
These core events and properties will last years or decades—even if your product gets fully redesigned. They are why your product exists—playing the song, ordering the food, and setting up their account. They are why people pay (and probably include when they pay you). The reality is that even complex products have a minimal number of these events.
Next, you have key workflows and interactions—things more connected with the current interface. If you did a redesign, they would change. You are currently optimizing these product areas but will probably move on in a few quarters. You'll have more of these events; if you have thirty core events, you might have a couple hundred of these workflow events.
And then you have what I call curiosity events. When instrumenting these events, you cast a big net because you may not ever use these. There's no need to stress. You may instrument them when you release a feature and remove that code later.
Example
You manage a learning product. Some core events might be starting a course, finishing a class, getting a grade or score, advancing through a course, interacting with course materials, viewing a course, subscribing, and changing your plan.
At the next level, we might have essential onboarding flows and interactions specific to certain types of content, like video plays, quiz interactions, and optional settings.
And finally, add some catch-all events like page views, dialogue box interactions, and form interactions.
Do this tomorrow
- Start with your core events. Think about your product and imagine it had no interface.
- List a series of commands as though you were talking to Alexa. What would you ask Alexa to do?
- Limit yourself to thirty of these.
“What do you mean I gotta find my North Star? I’m freaking out!”


#3 Kitchen Sink KPIs
Instead: Take a quick temperature check of your business, track standard metrics, track key actions, and go.
The Freak Out
Someone has told you to identify your KPIs, North Star Metric, team goals, OKRs, product strategy, and product vision—basically, everything associated with your business—before using Amplitude. And then they've told you to get buy-in on everything. And then the end of the year rolls around, and your whole strategy changes. The cycle repeats itself.
In Reality
For every business type, business category, or product "motion" there are standard metrics. Many of these metrics are related to the business—like churn, expansion revenue, ARR, cost of acquisition, etc.—and some are generically applicable to products in that category (like cart size, video minutes watched, etc.)
So yes, you need to spend some time figuring out your business and some of those default metrics. There typically are only so many metrics in this category, and the events are easy to track (with very little instrumentation).
But note that none of that has to do with strategy, goals, OKRs, or the perfect North Star Metric. Here's the reality: measurement is an ongoing and iterative process. You will continuously be refining the metrics you use. You're doing yourself a disservice by waiting for perfect clarity.
Example
You are going to want to track a retention metric. That's a given—no debates there. Retention is how many people stick around and continue using your product (ideally in a way that is congruent with your product strategy).
Without historical data, you may not know the right retention metric or stickiness metric. Do "good" users visit daily, weekly, or monthly? Is their interaction with the product meaningful if they do the valuable thing ten times or eight times? Should you use unbounded retention (how many people used the product on or after a particular day) or what's known as "N-day retention" (# of people that returned on that specific day relative to their first visit)?
You could stress for months about that. Instead, ensure that those core events are instrumented and experiment to find the right metrics.
Do this tomorrow
- Research the "standard" metrics for your business. Make those happen.
- Identify key value exchanges in your product. You might not know, so clarify your hypothesis for where these key value exchanges occur.
- Instrument these events and use a product like Amplitude to explore the insights made possible with those events.
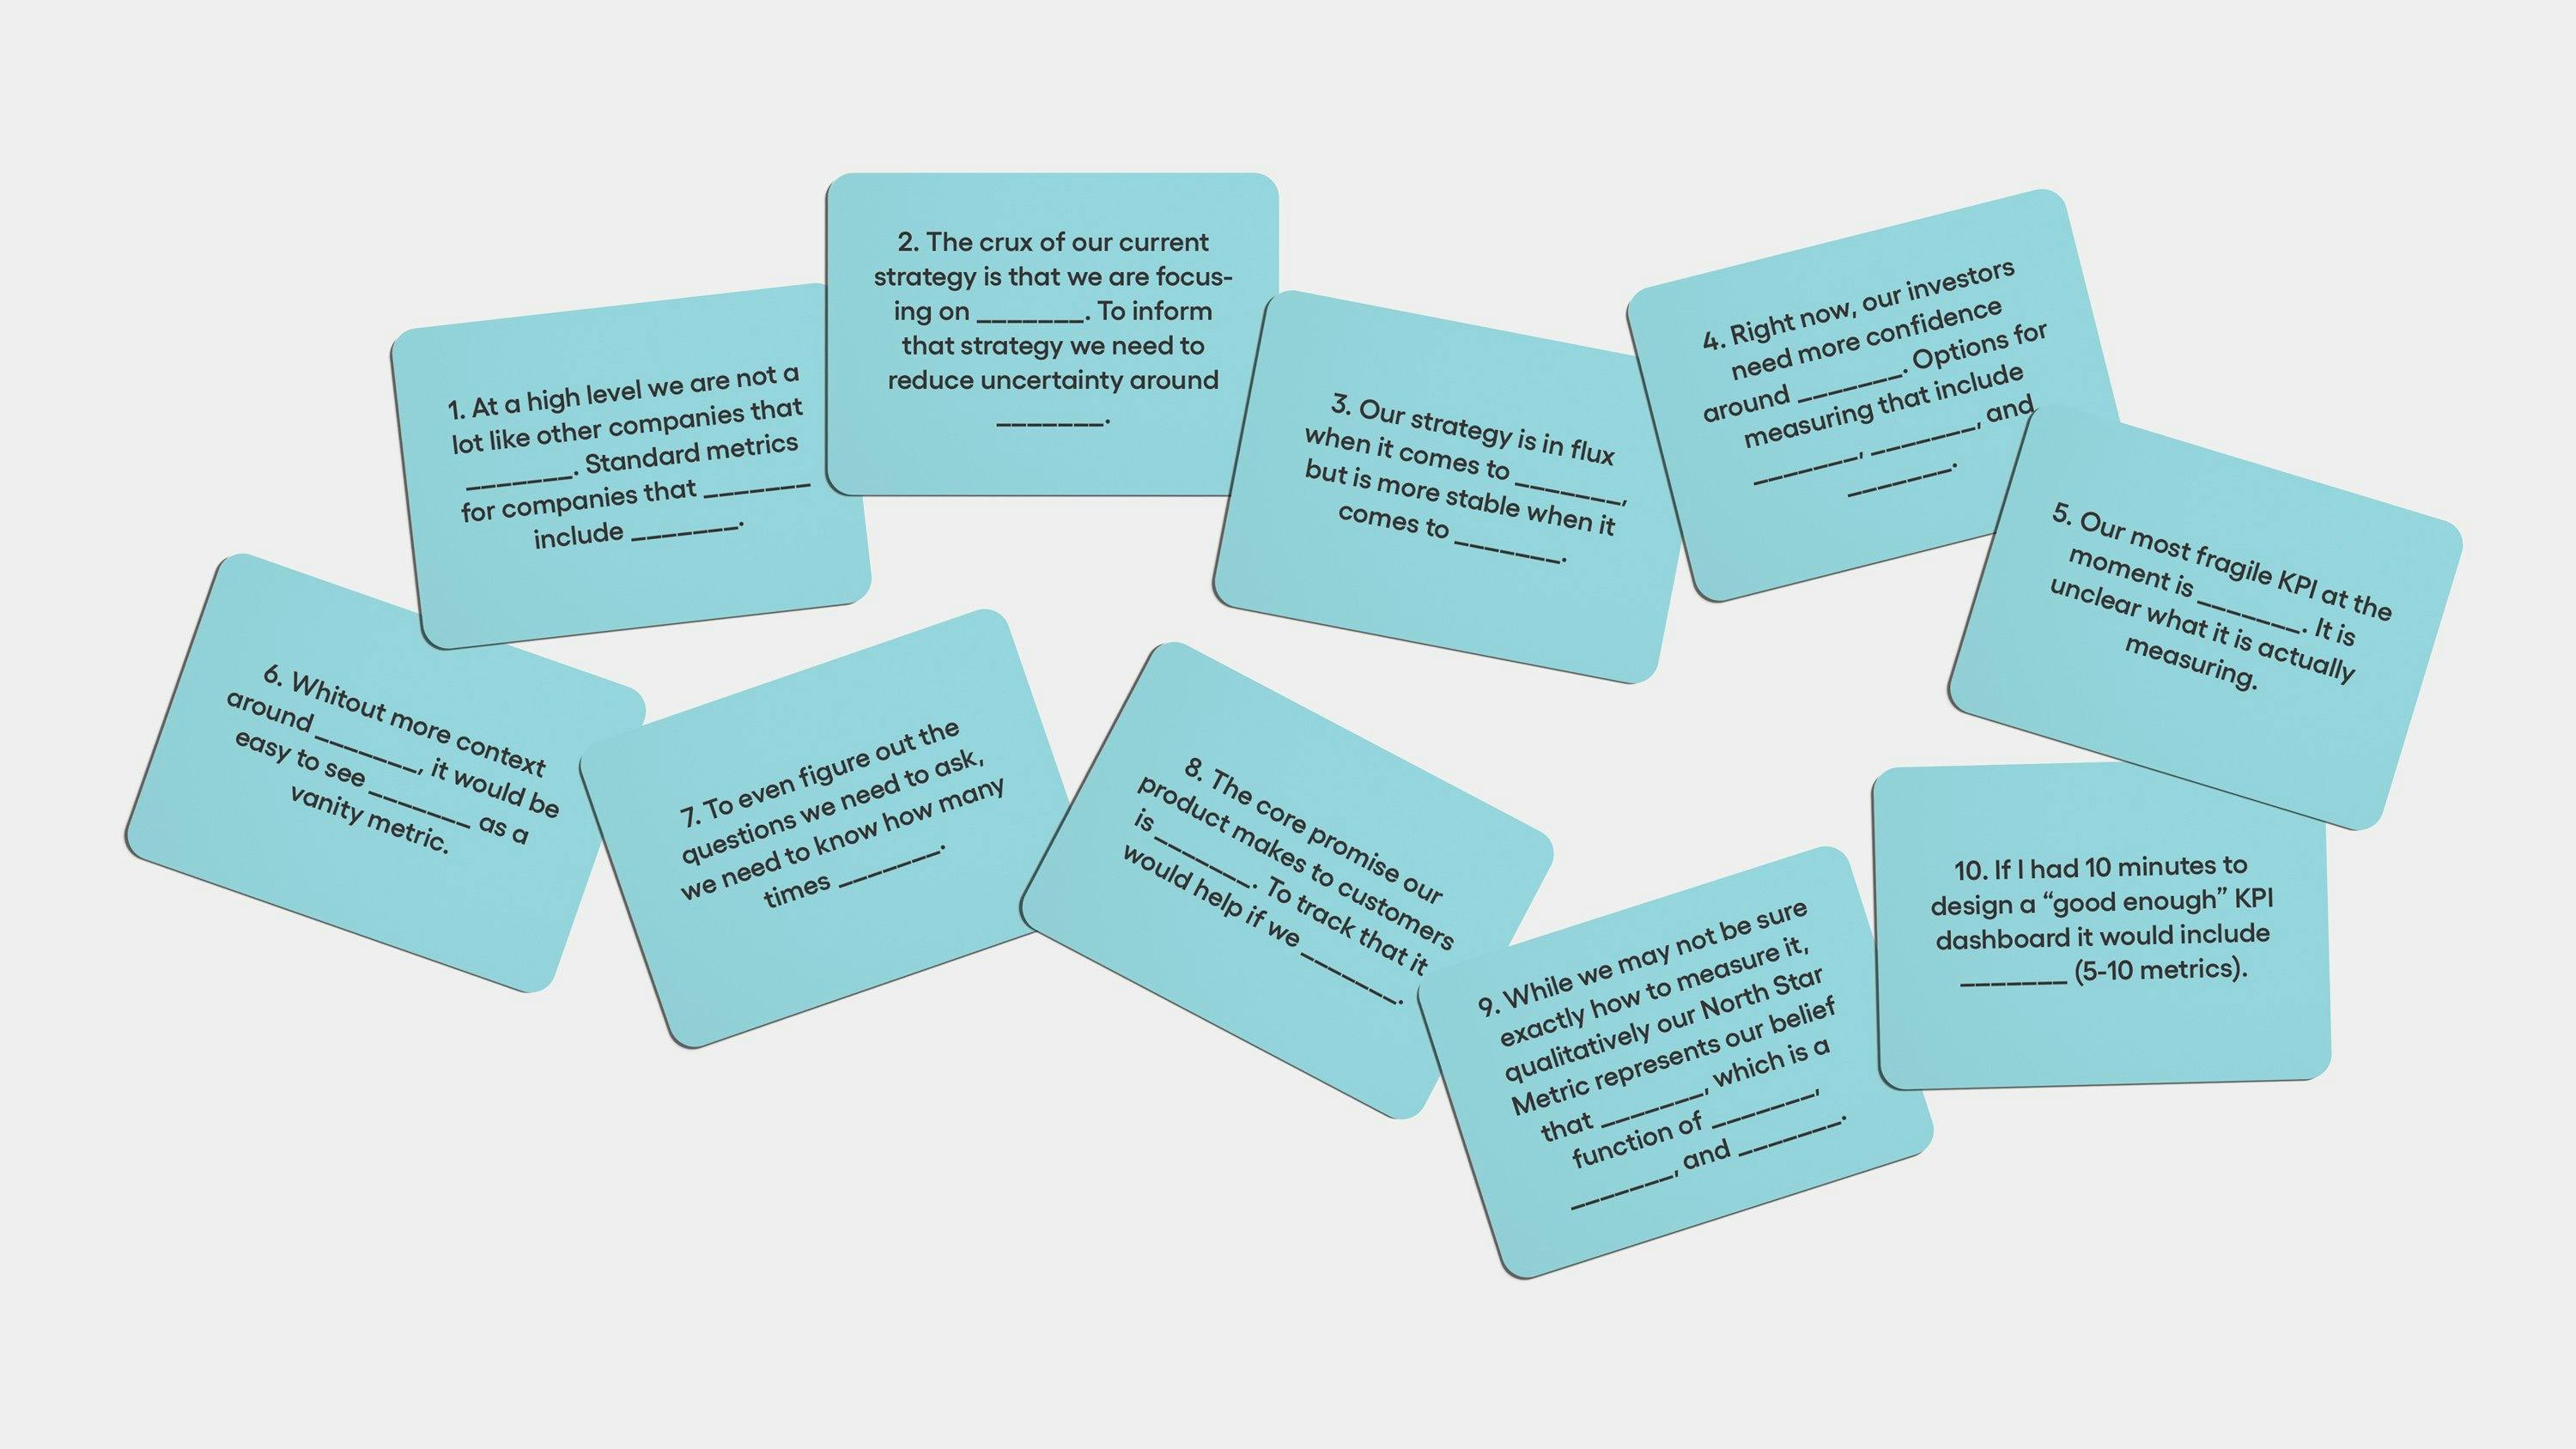
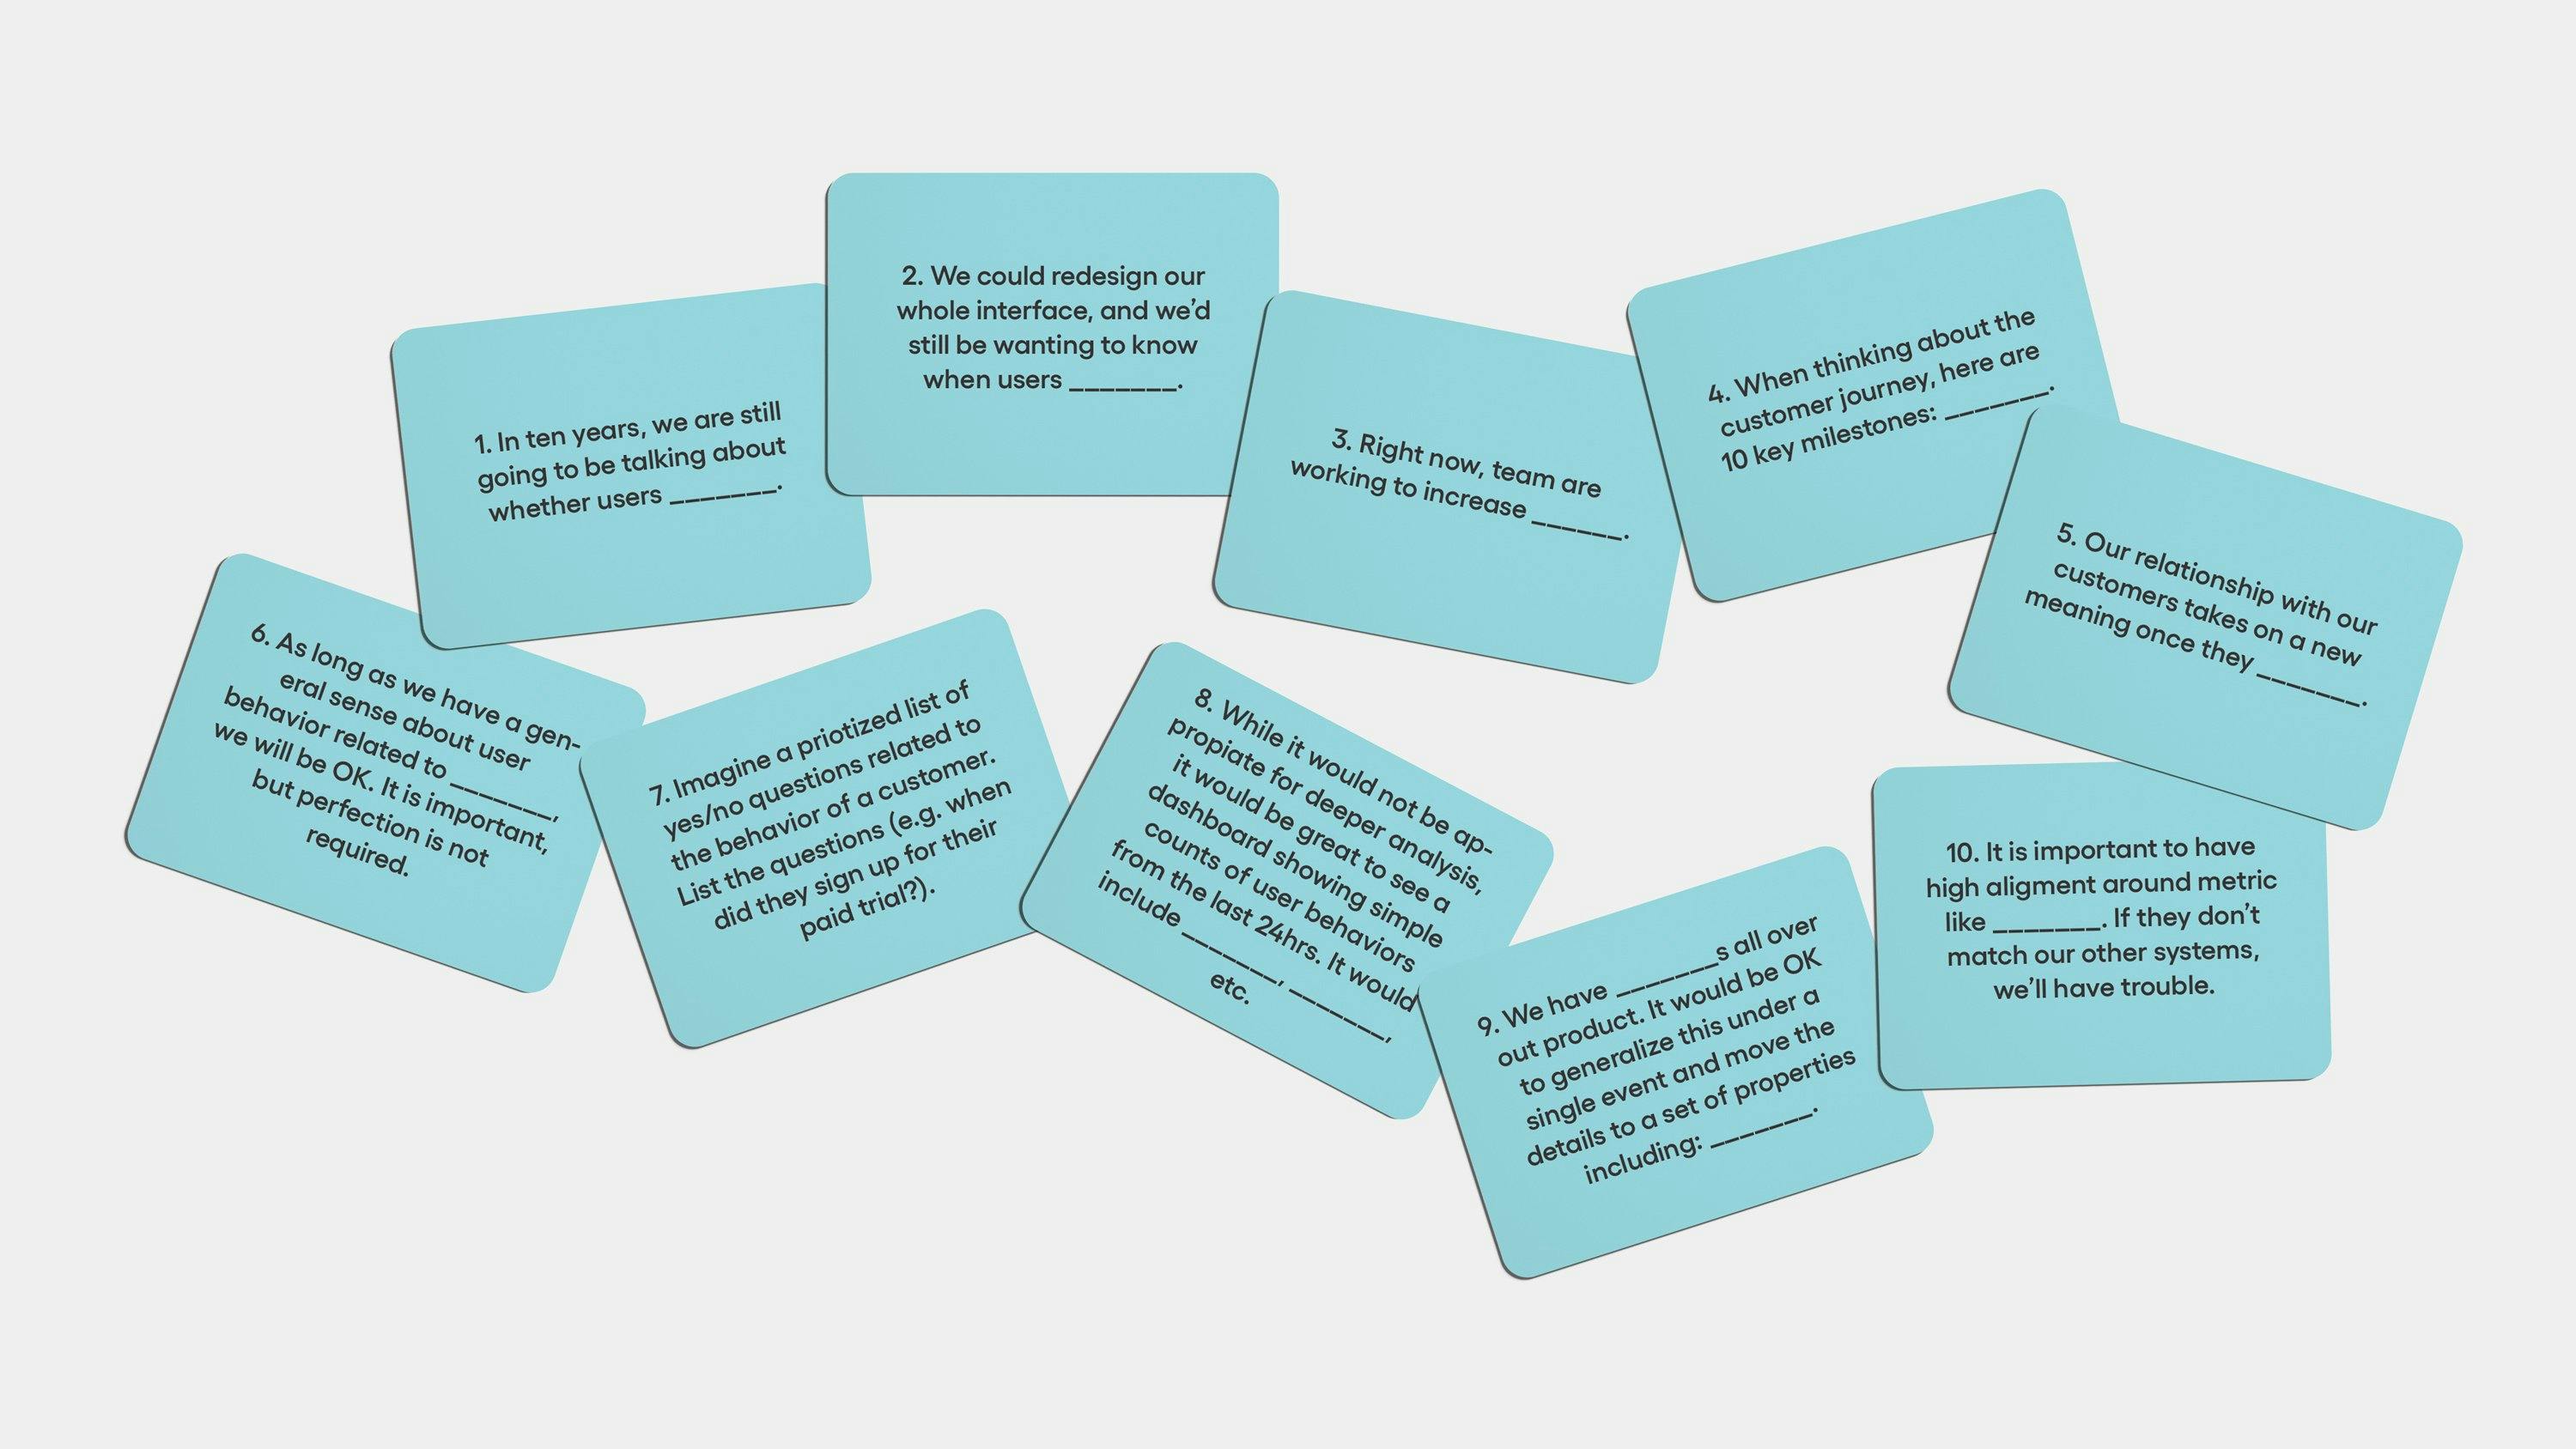
Team Discussion Prompts
We’ve put together prompts to help you and your team avoid the pitfalls of the analytics freak out.
Learn More
We’ve included more resources below to keep you moving forward on your journey in analytics.


Check out Amplitude today for free! Get hands on with our platform to explore how self-service can rethink your business analytics.

Want to bring Amplitude into your company, but not sure how? Check out our guide to help you learn how.

No matter your experience level, our Academy helps you get started on your path to self-service analytics.