Release Notes: May 2017 (Part I)
Here's what's new in Amplitude as of May 2017.
In this product update post you’ll find updates on:
- New Features
- Engagement Matrix
- Usage Reports
- G Suite SSO Integration
- Feature Improvements
- Funnels
- Event Segmentation
- Stickiness
- UI/UX Improvements
- Custom segment labels
- Zoom in on charts
- Resizable table columns
- Responsive screen sizes
- Resources
- Product Analytics Playbook: Mastering Retention
- Webinar Series
- SDK Updates
View May 2017 product update part II. Read past product updates here.
New Features
Engagement Matrix
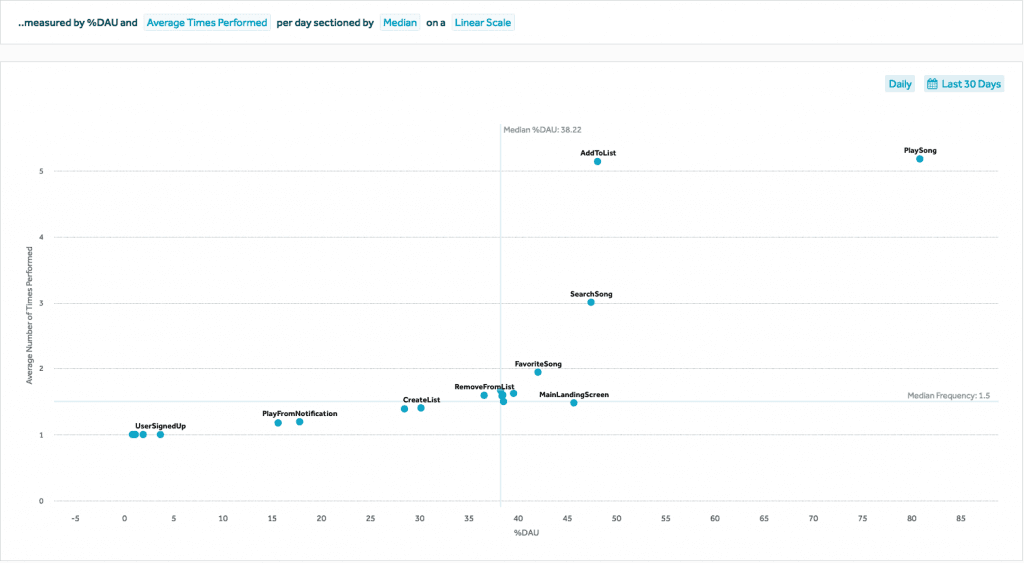
(Enterprise Only) This is an entirely new chart type that allows you to understand the overall engagement of features in your product. It can help provide a general understanding of feature usage by allowing you to see your top and bottom events in a matrix view. You can read all about the latest edition to our chart types here!
Usage Reports
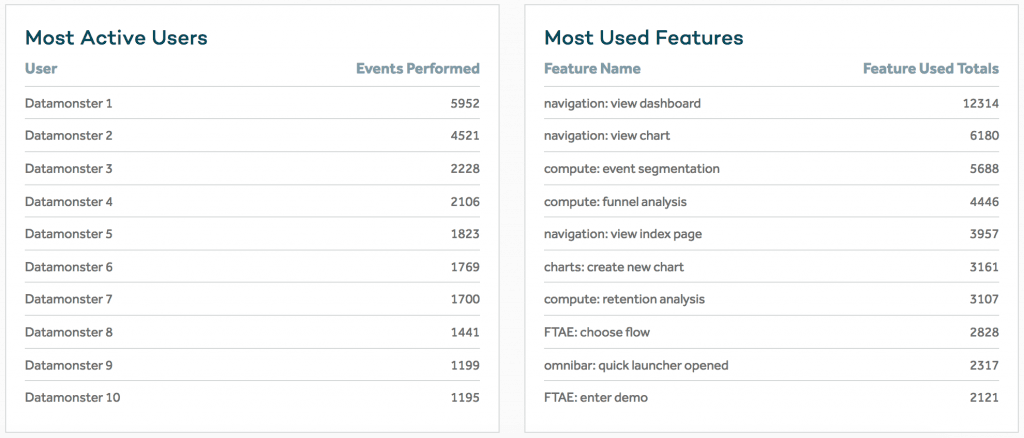
(Enterprise Only) Organization admins and managers can now view Usage Reports in the Settings page of their organization. This tab shows useful information about how users within an organization are utilizing Amplitude. Read more about Usage Reports here.
G Suite SSO Integration
(Enterprise Only) Amplitude now offers G Suite SSO for our Enterprise Customers. To set up SSO, please reach out to your dedicated Customer Success Manager and also follow the instructions here.
Feature Improvements
Funnels: AB Test Visualization
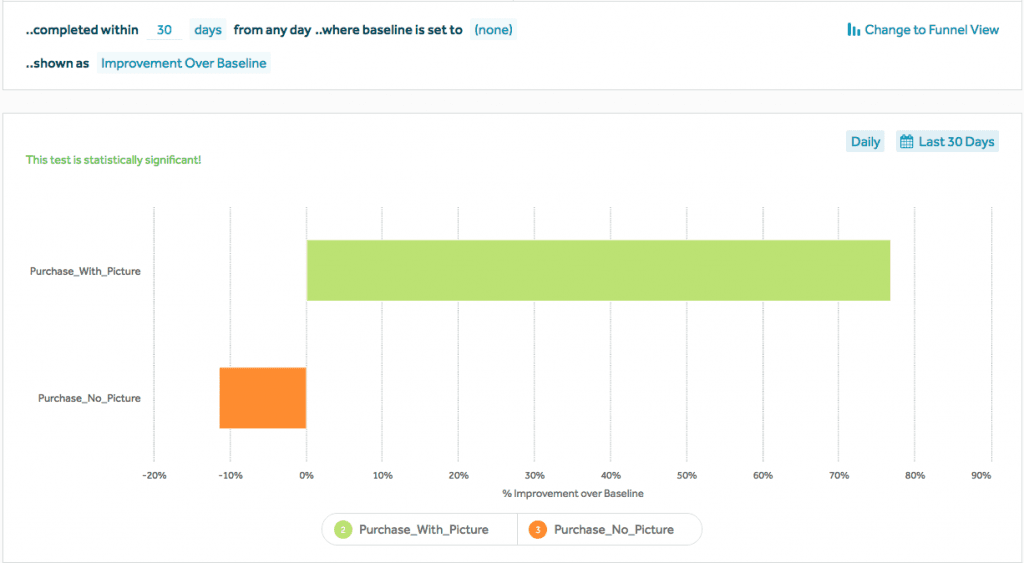
(Enterprise Only) The Funnel Analysis chart type now contains an AB Test View. This will allow you to visualize AB tests as well as receive a report on the statistical significance of each test variant to help better analyze AB test results and identify winners. Read more about it here.
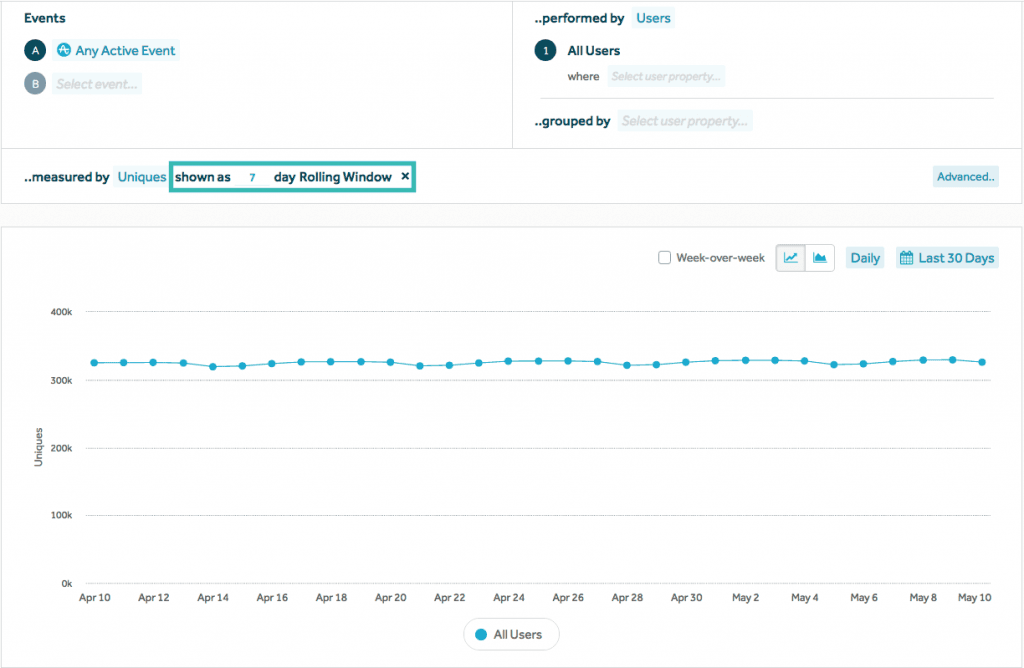
Event Segmentation: Rolling Windows
You can now select to view your Event Segmentation charts with rolling windows under the “Advanced..” dropdown in the bottom module. This will display the aggregate last X days of information in a single data point. Read more about this new metric here.
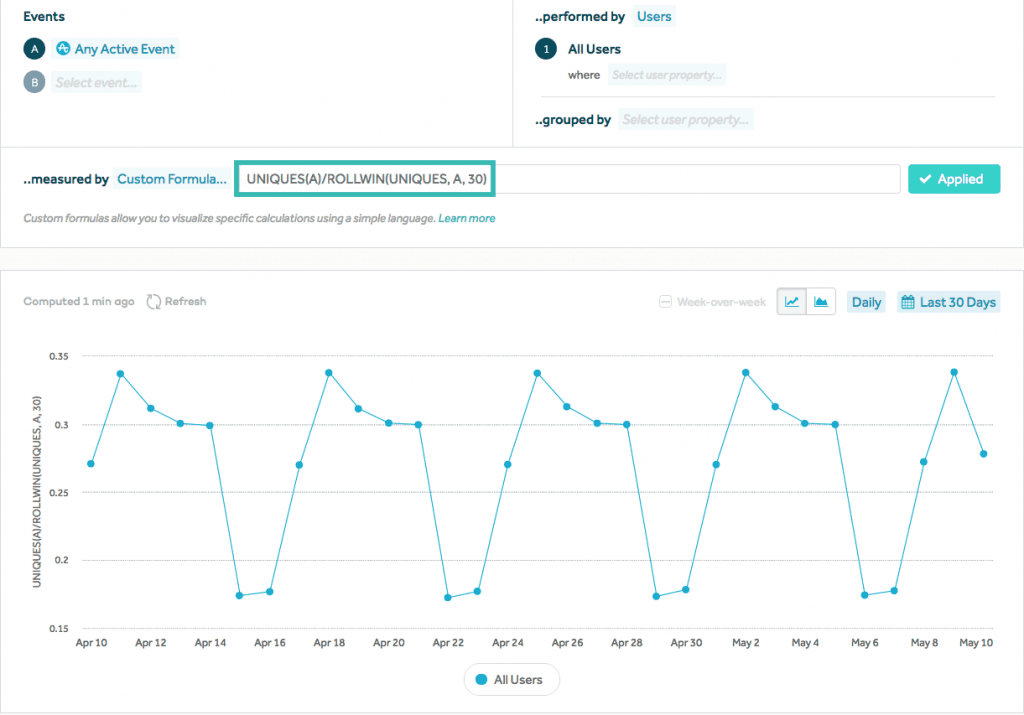
Event Segmentation: Rolling Windows and Rolling Averages in Custom Formulas
We added rolling windows – ROLLWIN() and rolling averages – ROLLAVG() as new functions that you can use to build custom formulas. This will allow you to create cool charts such as plotting your DAU/MAU ratio by using the custom formula UNIQUES(A)/ROLLWIN(UNIQUES, A, 30) where event A is ‘[Amplitude] Any Active Event’. Find more information about custom formulas here.
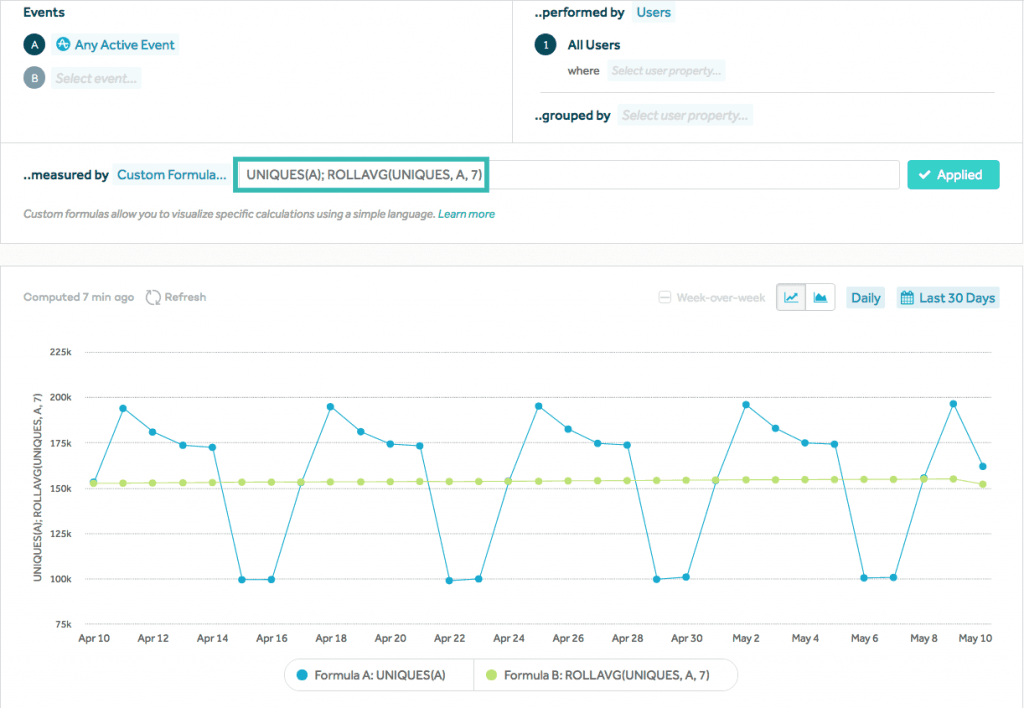
Event Segmentation: Simultaneous Custom Formulas
We’ve also added the ability to plot multiple custom formulas on the same Event Segmentation chart. With this updated functionality, you can even superimpose your rolling average on top of your DAUs! You can do this with the custom formula UNIQUES(A); ROLLAVG(UNIQUES, A, 7) where the semicolon separates the formulas and event A is set to ‘[Amplitude] Any Active Event’. Read more about custom formulas here.
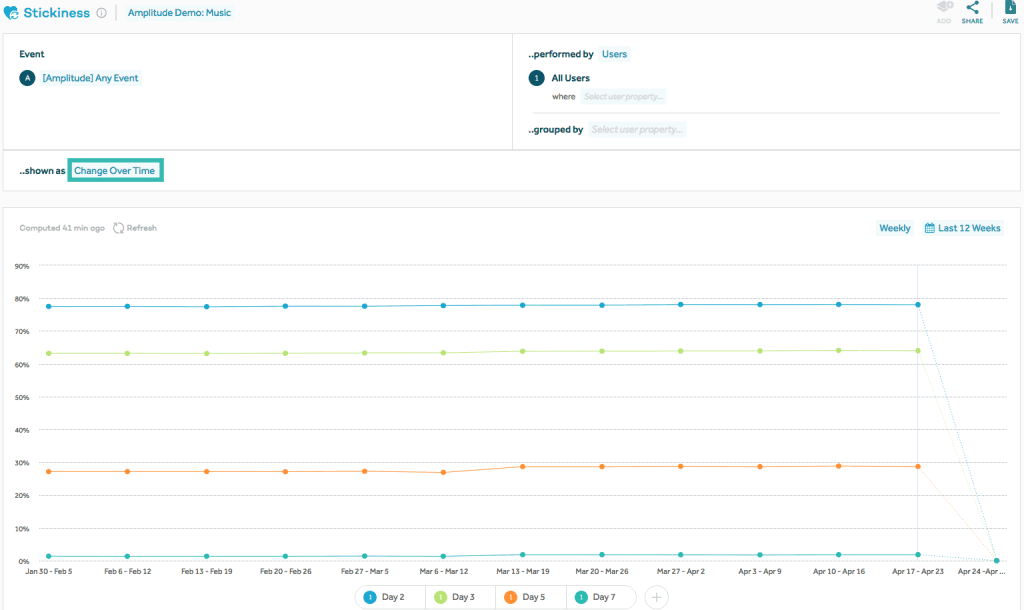
Stickiness: Change Over Time
You can now see the stickiness of your events over time. To do so, select “Change Over Time” in the dropdown in the Stickiness chart type. Find more information about stickiness over time here.
UI/UX Improvements
Custom Segment Labels
Previously, Amplitude would name segments for you by default. This can quickly become confusing, especially for complicated segments. You can now edit the name of your segments and doing so will even update the labels on the charts! Find out how to do this here.

Zoom
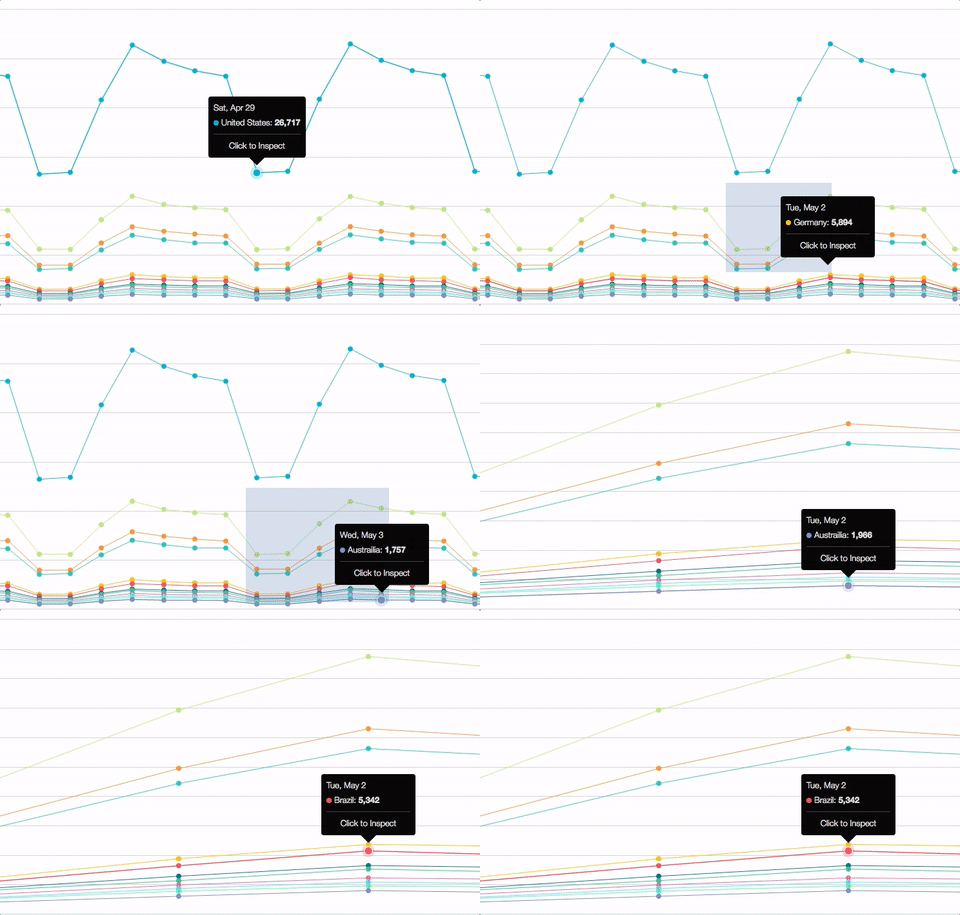
You can now zoom in on interesting data points in charts. You can zoom in by dragging diagonally with your mouse across an area of your chart that you want to focus on. See our Help Center article for more information.
Resizable Table Columns
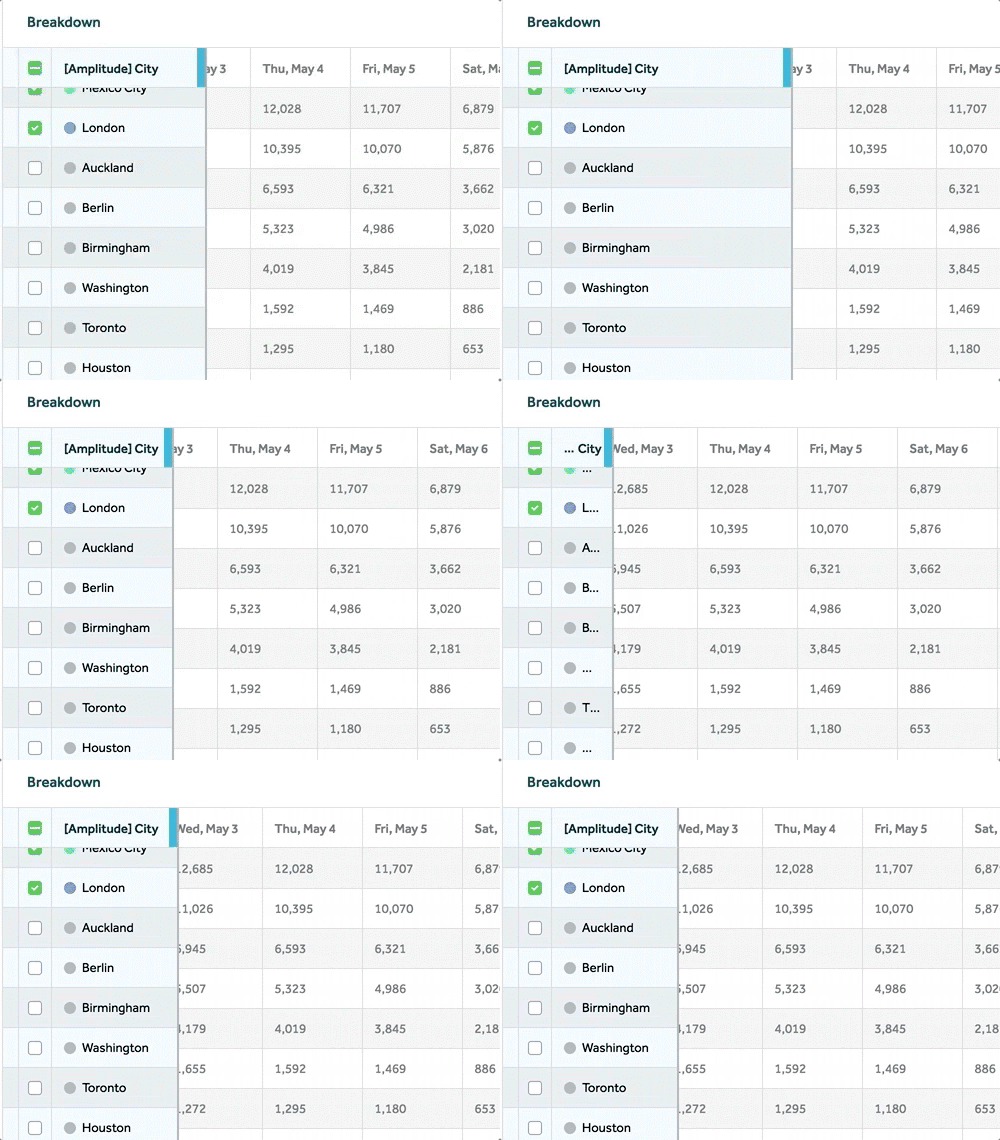
You can now expand the size of columns in data tables. This is useful if you have values or segments with very long names.
Responsive Screen Sizes
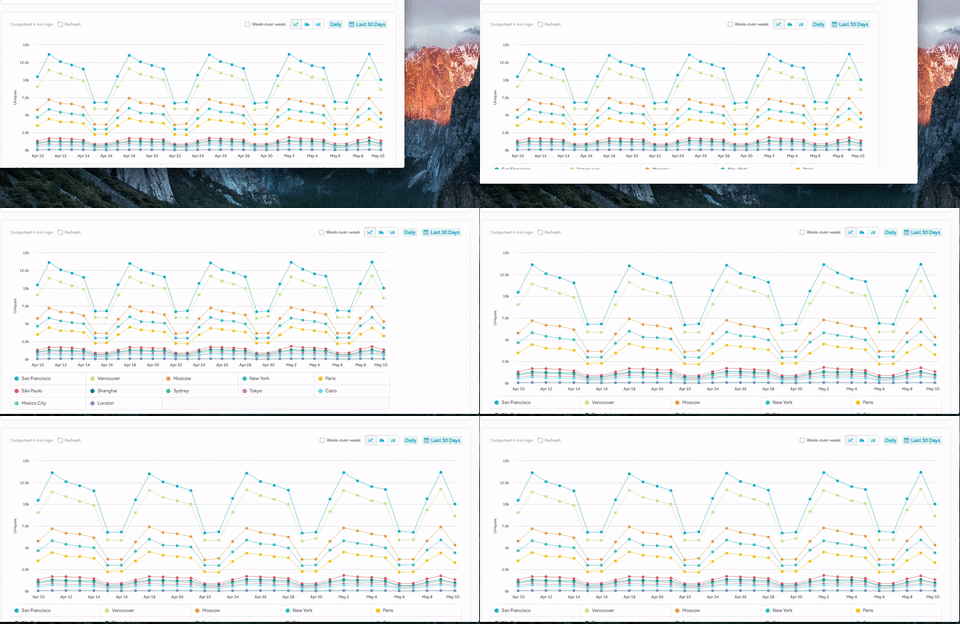
Amplitude charts are also now responsive and will resize accordingly.
SDK Updates
Please find below an update we’ve made to our Android SDK. We highly recommend that you always update to the latest version of our SDKs.
Amplitude-Android v2.13.4
- Since v2.13.3:
- Handle exceptions when fetching device carrier information.
- Copy userProperties on main thread in setUserProperties to prevent ConcurrentModificationExceptions.
- Migrating setup instructions and SDK documentation in the README file to Zendesk articles.
More resources
- Read Case Studies from Amplitude customers. Learn how brands like Square, Instacart, Yellow Pages are building better products with product analytics.
- Download the Product Analytics Playbook. Learn proven methods for building a data-informed retention strategy

Kate Adams
Former Product Manager, Amplitude
Kate is a former product manager at Amplitude focused on improving customer adoption. She's always looking for excuses to visit new places, learn new things, and eat unusual food.
More from Kate


