ExperimentMay 23, 2024
[All updates]Experiment Color Results Grid
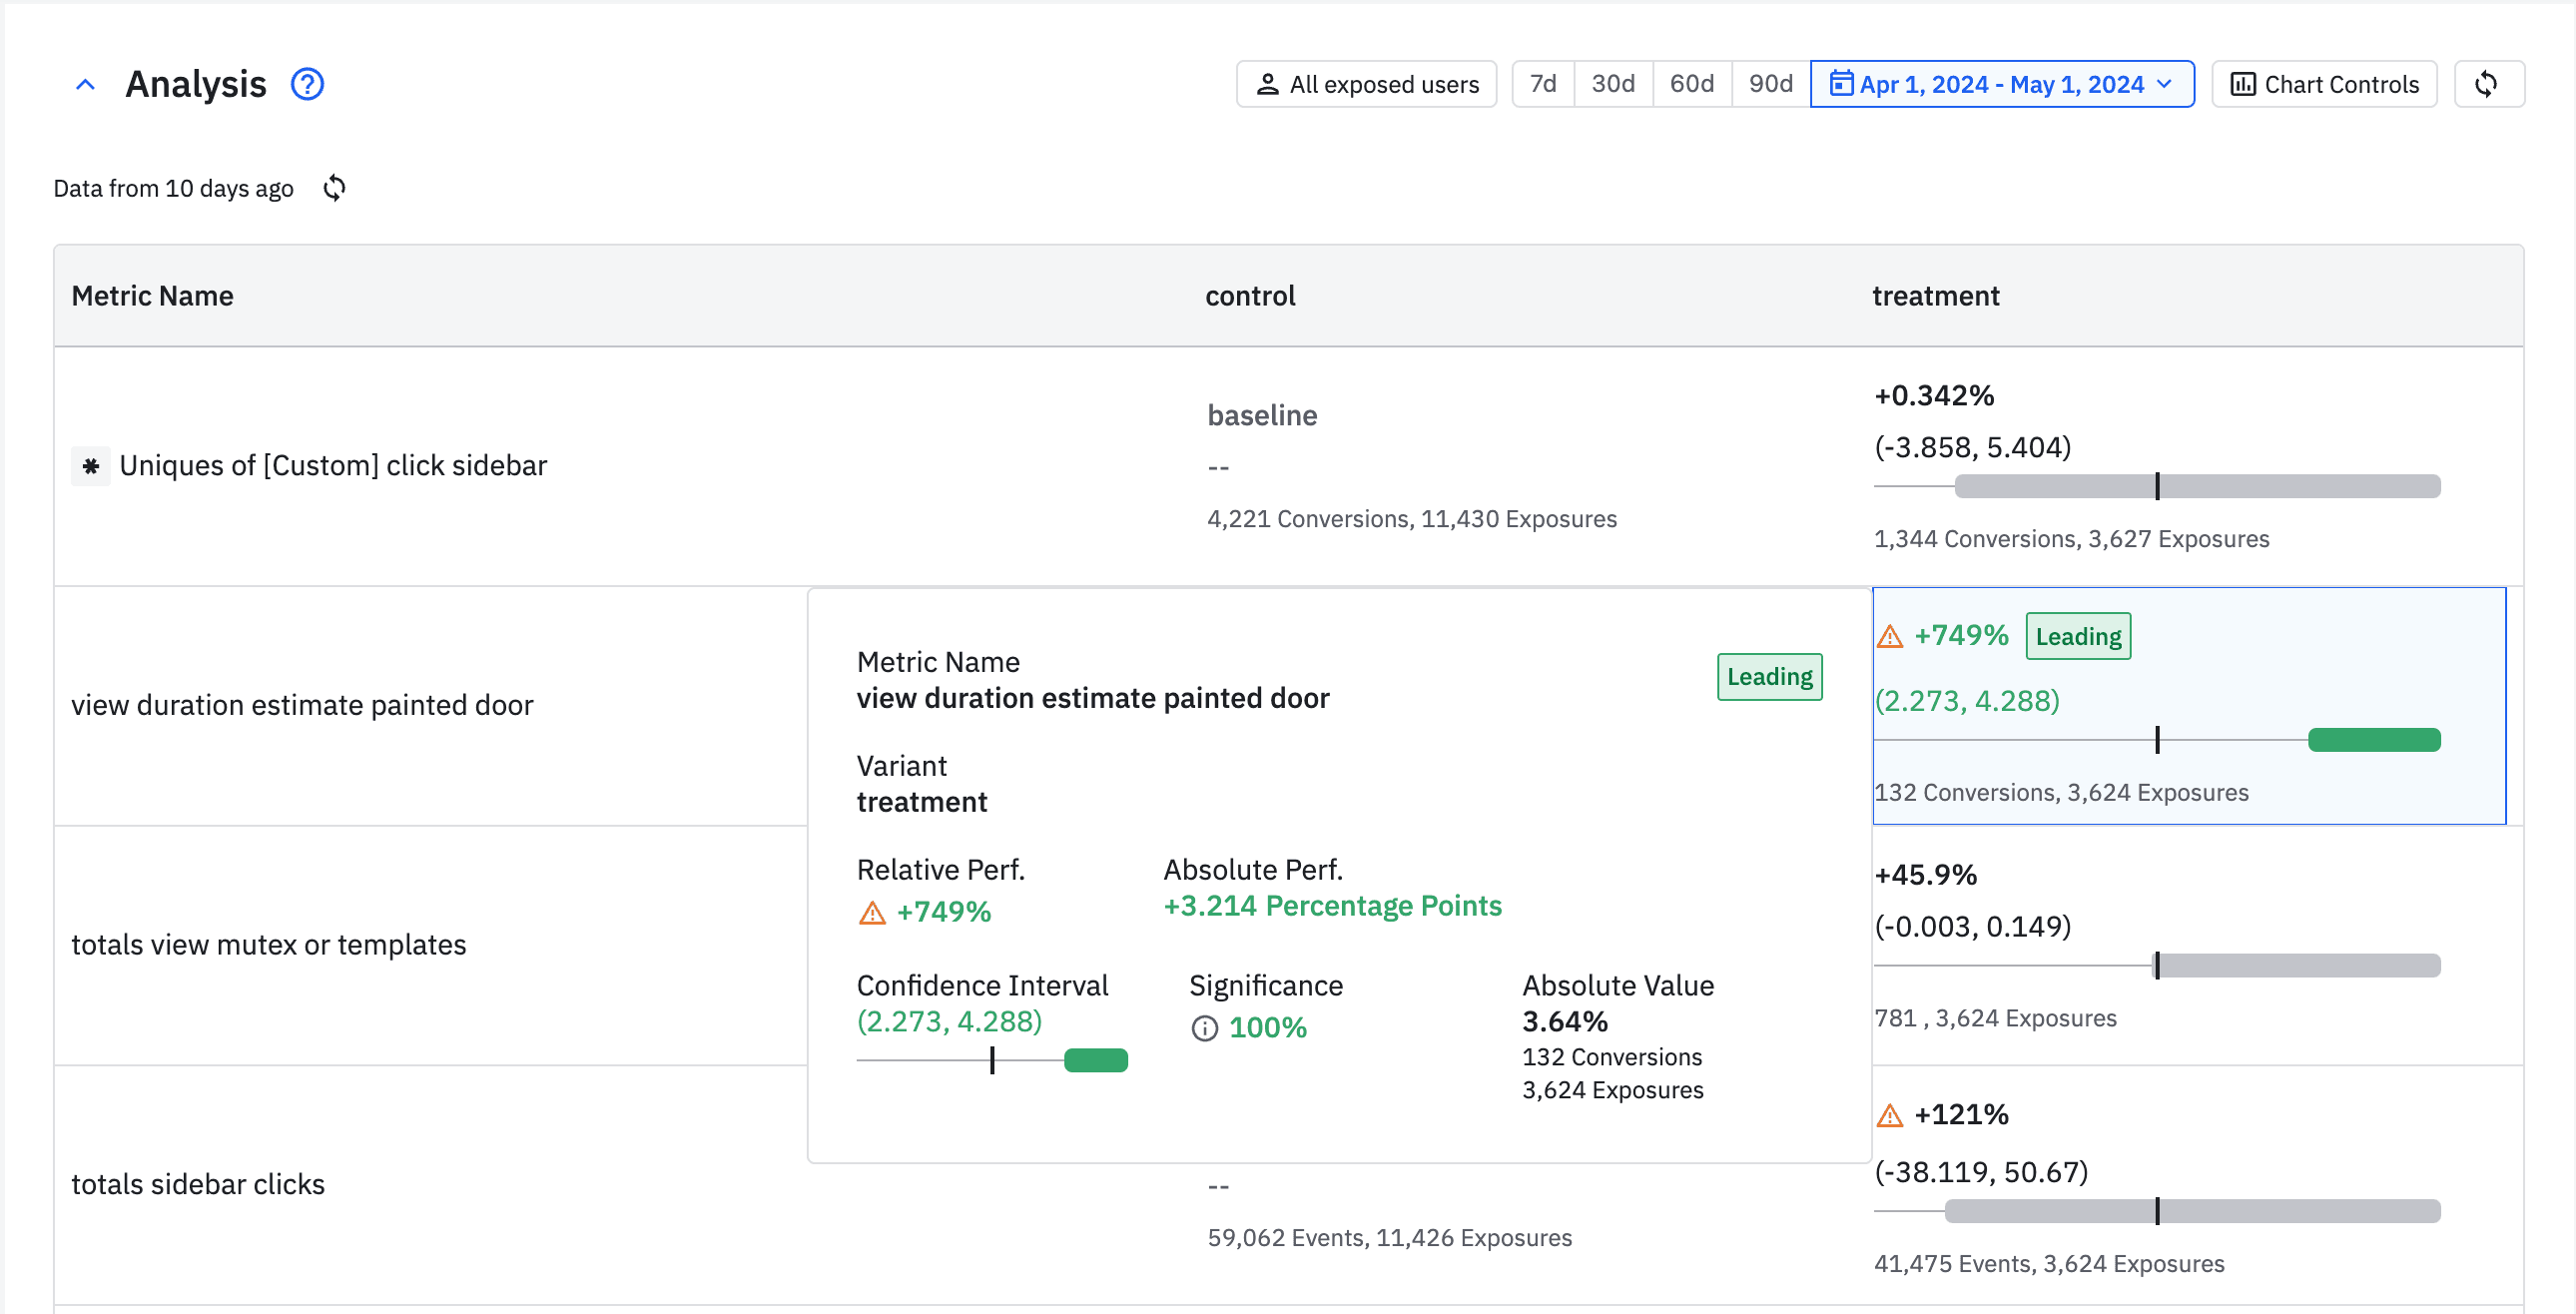
Description: The analysis table in Experiment and Experiment Results is getting a redesign to make it easier to read and identify significant variants. Metrics are structured as rows, while variants are displayed across columns. Table cells can be hovered to bring up a card with details, and are now colored if that variant is statistically significant.
When: Live Now