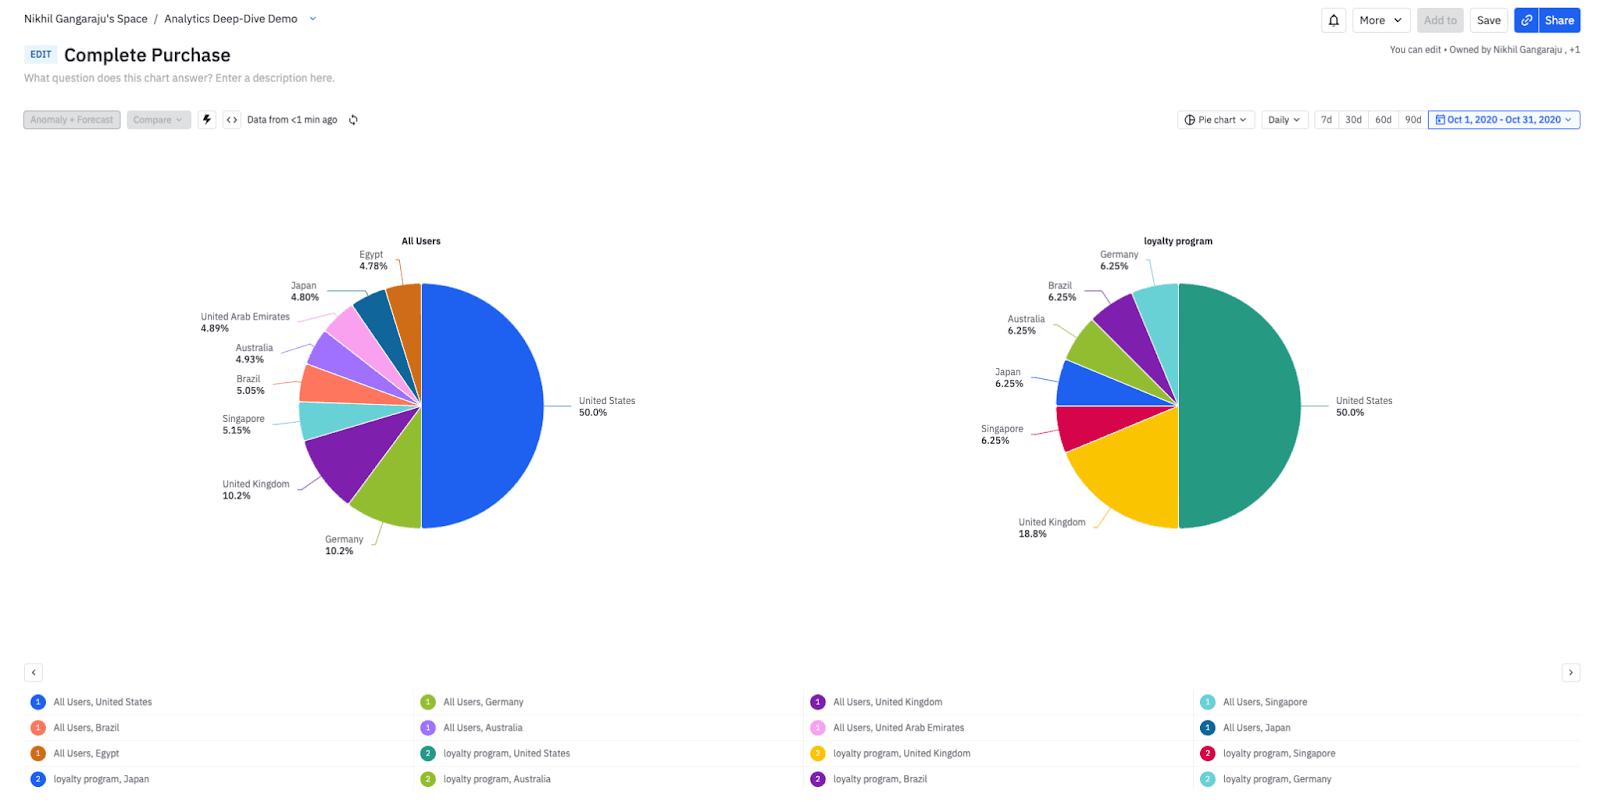
Pie charts in segmentation
You can now select pie charts as a visualization for most segmentation measures! You can have up to two segments in this visualization!
What it is
Description: You can now select pie charts as a visualization for most segmentation measures! You can have up to two segments in this visualization!
Why: A fairly requested feature for segmentation, customers want more access to a pie chart visualization outside of composition. A very common complaint is that user composition (the only chart with a pie chart vis) is limited to only event/user properties. (Note: You can have up to two segments in this visualization.)
Where: Segmentation charts. Does not currently support PoP, A+F, or the measures: Active %, or Distribution of Property Value.
Available in EUDC: Yes