ExperimentMay 06, 2026
Web Experiment Chrome Debugger — Targeting Visibility
The Amplitude Instrumentation Explorer Chrome extension now shows granular targeting debug details for Web Experiments, making it faster to diagnose why an experiment isn't firing.
What it is
Description: The Amplitude Instrumentation Explorer Chrome extension now shows granular targeting debug details for Web Experiments — so you can diagnose why an experiment isn't firing in seconds.
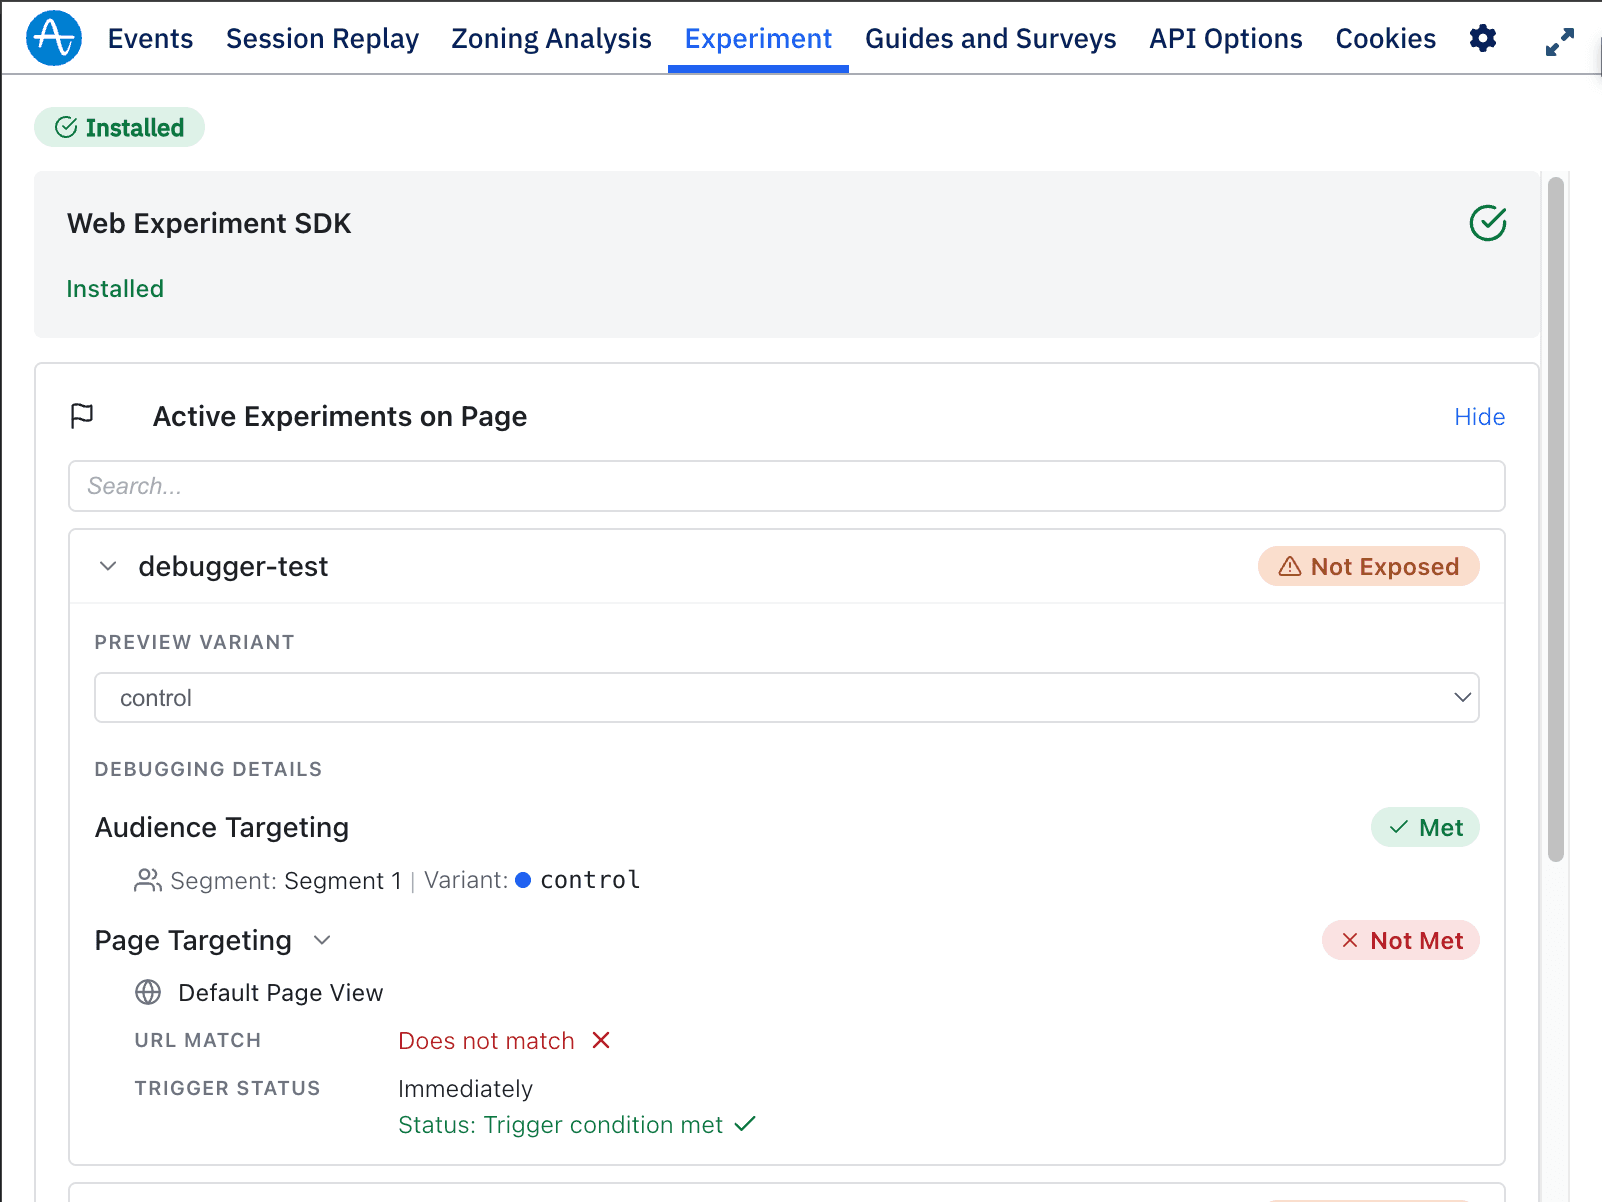
When an experiment is active, you'll see a Debugging Details panel with:
- Audience targeting — which segment matched and the assigned variant
- Page targeting — configured page view rule, URL match status, and trigger status
- Exposure status — top-level Exposed / Not Exposed at a glance
- Preview variant — override the assigned variant for quick QA without touching experiment config
Where: Access via the Amplitude Instrumentation Explorer Chrome extension. When: Available now (Update to the latest version of the extension to use).