Funnel Analysis Dashboard Template Example
Unlock insights into your conversion funnel with our comprehensive dashboard. Track conversion rates, trends, and user behavior to optimize pathways and enhance user experiences. Ideal for product managers, marketers, and analysts seeking actionable insights for growth and success.
Unlock insights into your conversion funnel with our comprehensive dashboard. Track conversion rates, trends, and user behavior to optimize pathways and enhance user experiences. Ideal for product managers, marketers, and analysts seeking actionable insights for growth and success.

About this template
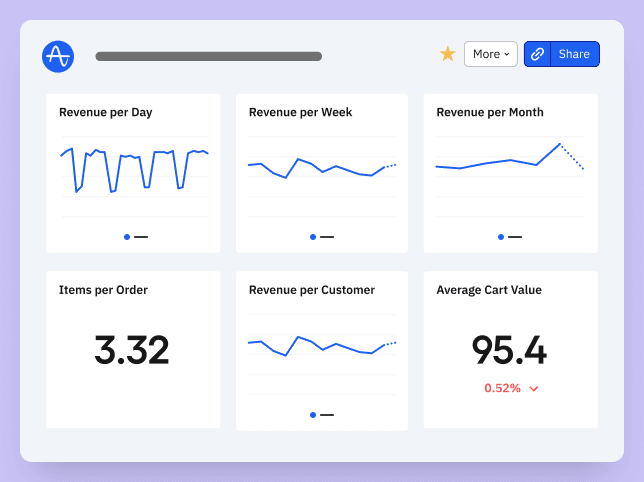
Amplitude's funnel analysis dashboard is made up of useful charts to help evaluate your company's conversion funnel.
- What is the conversion rate of this funnel?
- How is the conversion rate changing over time?
- How long does it take users to convert?
- How many times do users perform the starting event before converting?
- What paths do users take to get to your ending event?
How this template works
Unlock the full potential of your data with our step-by-step template.
1. Click "Try it in Amplitude" if you have sufficient data in an Amplitude account, or click "View chart in demo".
2. Replace the dashboard's placeholder content with your own events by clicking on the event names within the "Events" panel and selecting from the menu.
3. Save the chart and share it with your team.
About Amplitude
Amplitude is a leading digital analytics platform that helps companies unlock the power of their products. Amplitude guides companies every step of the way as they capture data they can trust, uncover clear insights about customer behavior, and take faster action. When teams understand how people use their products, they can deliver better experiences that drive growth. Amplitude is the best-in-class analytics solution for product, data, and marketing teams, ranked #1 in multiple categories by G2.
Recommended Integrations
- ProductBoard - Productboard is a product management platform that provides a single source of truth for all customer data, helping teams uncover trending user needs.
- Appcues - Appcues supports personalized, targeted in-app onboarding messages, modals, and hotspots to guide specific user segments through a tour or to pinpoint key page elements.
- Apptimize - Apptimize empowers product teams to create the best possible experience for individual users through data-driven A/B tests and personalized promotions and feature releases.
Frequently Asked Questions
Amplitude is a leading digital analytics platform that helps companies unlock the power of their products. Amplitude guides companies every step of the way as they capture data they can trust, uncover clear insights about customer behavior, and take faster action. When teams understand how people are using their products, they can deliver better product experiences that drive growth.
Yes, Amplitude is free to get started. Our Free plan includes 2 million events per month, out-of-the-box Analytics and templates, Session Replay, Web Experimentation, and more—all at no cost.
Related templates

Dashboard Templates
by Amplitude
Twilio Segment Product KPI Dashboard

User Activity Templates
by Amplitude
User Activity Dashboard Template

Dashboard Templates
by Amplitude
Twilio Segment Fintech Dashboard
Dashboard Templates

Timo Dechau
Founder & Data Engineer @ Deepskydata


