Dr. Bart's A/B Experiment Dashboard Template
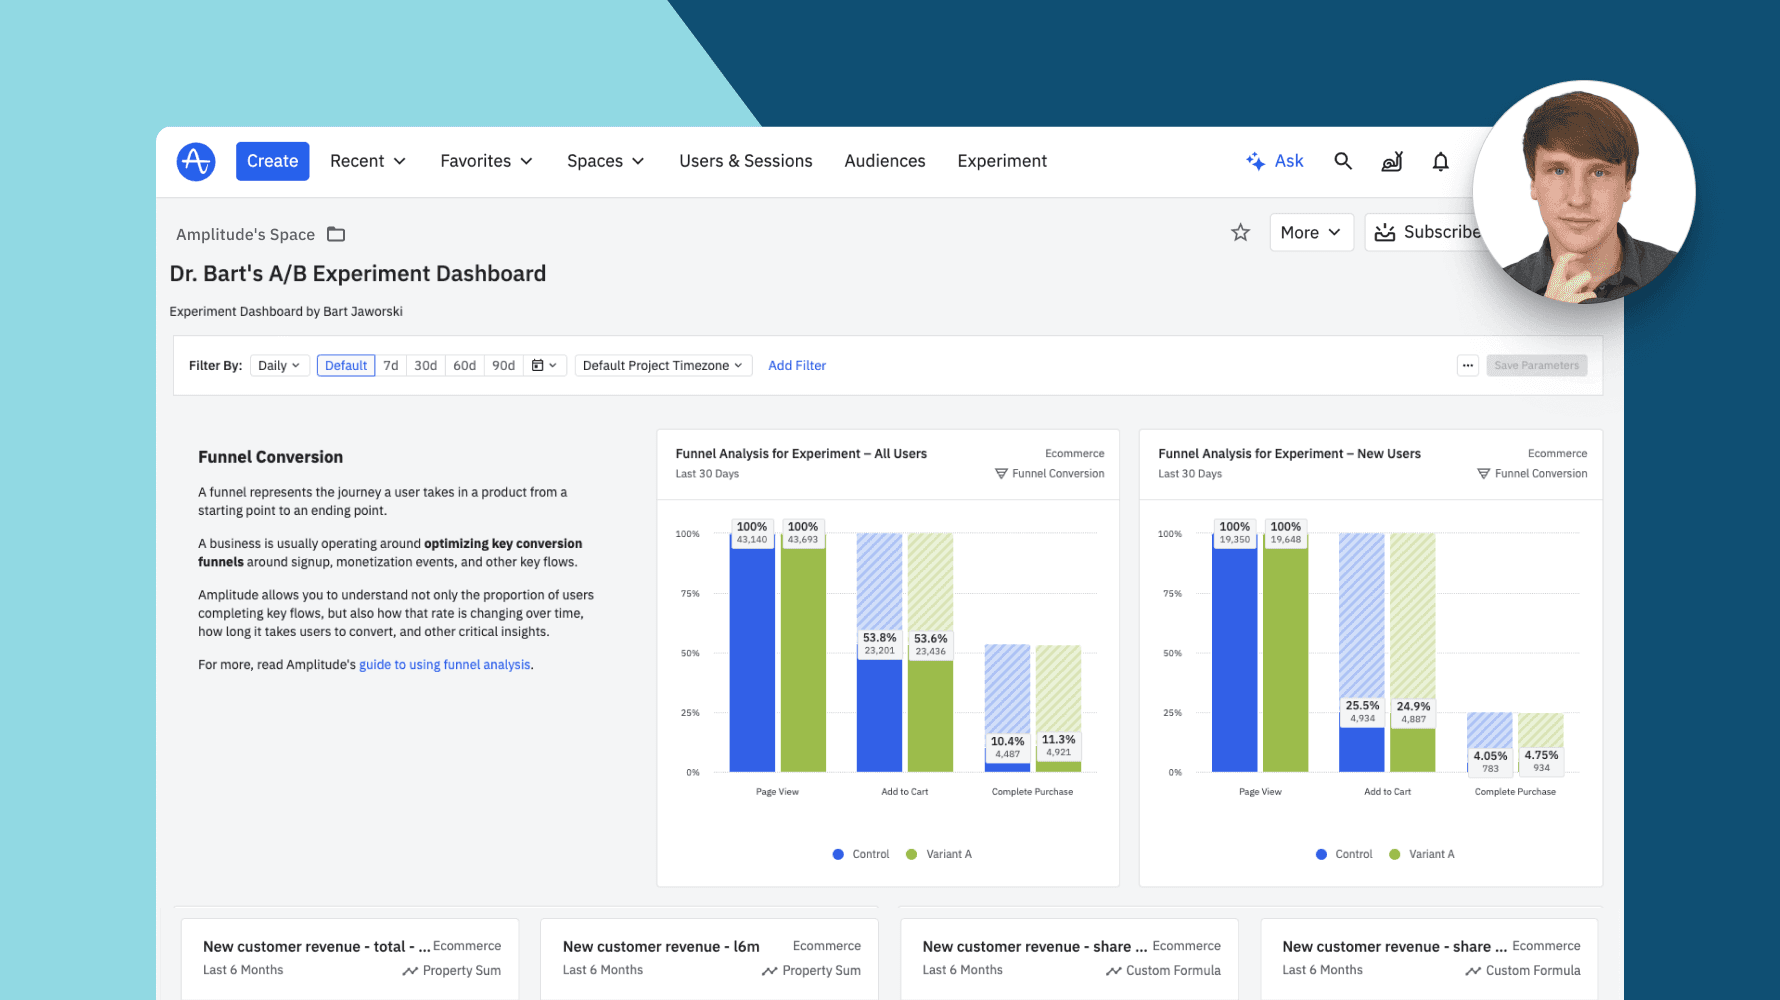
Dr. Bart's A/B Experiment Dashboard helps you visualize and analyze user behavior across key conversion funnels, from signup to monetization events. By tracking both primary and secondary metrics, the dashboard provides insights into how experiment variations impact funnel performance and ensure that no important metrics are adversely affected.

About this template
Dr. Bart's A/B Experiment Dashboard offers a comprehensive view of how users navigate through key conversion funnels in your product, such as signups and monetization events. It allows you to compare experiment variations and observe improvements in funnel conversion rates, providing a clear understanding of which changes drive the most value.
Beyond the primary metrics, the dashboard tracks secondary and guardrail metrics to ensure that changes don’t negatively impact other critical areas of the user experience. Amplitude’s advanced insights also highlight how conversion rates evolve over time and the speed at which users complete these journeys. This holistic approach enables data-driven decisions to optimize your product’s performance without unintended consequences.
How this template works
About Amplitude
Recommended Integrations
- Hubspot - HubSpot is an all-in-one marketing tool that helps attract new leads and convert them into paying customers.
- Braze - Braze is a comprehensive customer engagement platform that powers relevant experiences between consumers and brands they love. Braze helps foster human connection through interactive conversations across channels
- AppsFlyer - AppsFlyer helps brands make good choices for their business and their customers with its advanced measurement, data analytics, deep linking, engagement, fraud protection, data clean room, and privacy-preserving technologies.
- ProductBoard - Productboard is a product management platform that provides a single source of truth for all customer data, helping teams uncover trending user needs.
- Appcues - Appcues supports personalized, targeted in-app onboarding messages, modals, and hotspots to guide specific user segments through a tour or to pinpoint key page elements.
- Apptimize - Apptimize empowers product teams to create the best possible experience for individual users through data-driven A/B tests and personalized promotions and feature releases.
Dr. Bart's A/B Experiment Dashboard Template
Created by

Senior Product Manager at The Stepstone Group
I am a resourceful and experienced Product Manager that, as Mark Twain suggested, never works, as this position became my hobby. I like to bring people together to create something great and help them become even better. I have been very lucky, being able to execute my career as I planned so many years ago and I am really proud to call myself a doctor. While still being an active Product Manager, I try to give back to the world of product management. My online courses have helped thousands to develop their skills and careers and I'm here to help develop yours as much as I can.
Frequently Asked Questions
Amplitude is a leading digital analytics platform that helps companies unlock the power of their products. Amplitude guides companies every step of the way as they capture data they can trust, uncover clear insights about customer behavior, and take faster action. When teams understand how people are using their products, they can deliver better product experiences that drive growth.
Yes, Amplitude is free to get started. Our includes up to 50K MTUs, out-of-the-box and templates, , , and more—all at no cost.
Related templates


Advisor (PLG / Product / Growth) @ The Product-Led Geek
The Product-Led Geek Monetisation Dashboard by Ben Williams

ABM Dashboard Template

Adjust Dashboard Template
