4 Ways Customer Analytics Software Can Help You Build Better Products
Use customer data to set a clear direction for product development.
You can’t build a great product without understanding your users, and you can’t understand your users without product data. That’s where customer analytics software comes in. Any product-led company needs the right tools to be able to sift through data and find insights. With the right software, you can get immediate feedback on what’s working with your platform and what’s not. You can map the customer journey, run a cohort analysis, measure the impact of new features, and act on the insights you find.
In short, you can build the best product for your customers. It all starts with using analytics to discover where they find value from your product. Here’s a few ways to get started:
1. Behavioral Cohort Creation
Customer analytics software helps you assess users’ actions and segment them into behavioral cohorts—groups of users defined by the actions they take on your platform. By comparing cohorts to your larger user base, you’re able to find common threads in the activity of high-value customers. Then, you can nudge users to take similar actions in your product so they also convert.
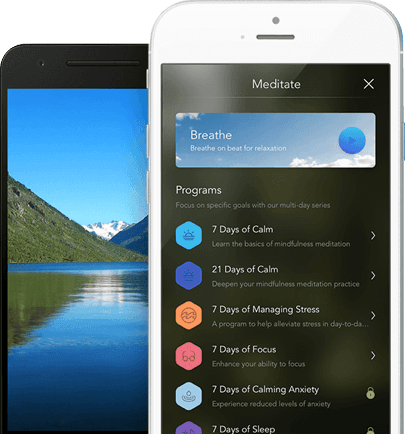
Meditation app Calm used behavior cohort analysis to triple their user retention. The company realized that the 1% of users who were using their daily reminder feature were highly engaged. But they weren’t sure whether setting reminders was a sign of a power user or whether setting reminders turned customers into power users.
Calm used behavior cohort analysis to find a feature that tripled user retention.
To investigate, the product team ran an experiment that made the daily reminder feature more obvious to a subset of new users. The result: Calm found that the new users who set daily reminders became highly engaged as well. They made the feature more prominent for all users in order to encourage more people to set the daily reminders.

2. Retention Improvement
When measuring retention, there are two parts to consider:
- Critical Event: The most important action you want users to take. This action should align with your company’s goals and also provide value to the customer.
- Critical events are unique to your company and may be repeated actions too. For instance, at a digital music store, the critical event may be multiple purchases of songs, rather than just the initial purchase.
- Usage Interval: The time frame in which your user should complete this action.
[Related: 6 Worksheets to Understand, Improve, and Calculate Retention Rate]
Anything you can do to nudge people toward the critical event within your ideal timeframe will help boost your retention rate and reduce churn. But knowing what is causing people to give up before that critical event requires analysis.
Using customer analytics software, you can look at the steps users take leading up to that critical event and see what is keeping them from progressing through the funnel.
ABA English used funnel analysis and behavioral cohorts to understand why users were falling off shortly after subscribing to their language academy. With the goal of users successfully completing a course and renewing their subscription, the ABA English team dug into why their users were abandoning the platform in their first subscription period.
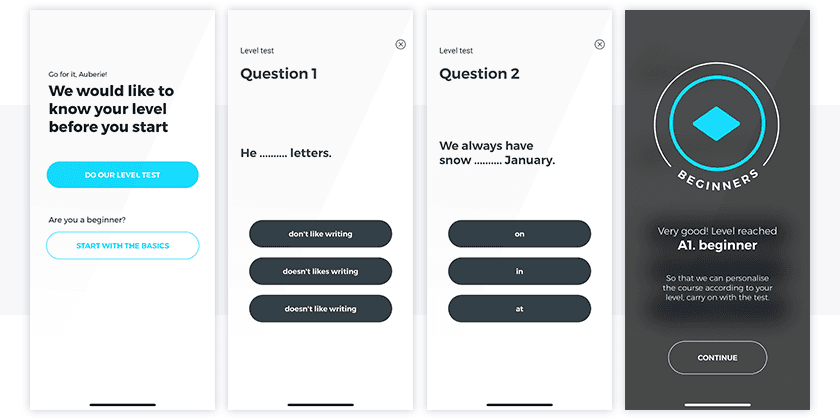
In looking at the data, they found the issue in their onboarding process. Users often signed up for course levels that didn’t match their experience, which caused frustration. The ABA English product team revamped the onboarding process to include a Level Test, so users were able to pick the right course for their needs.
ABA English introduced a Level Test into their onboarding process and increased retention.
The ABA English team used funnel analysis to inform a product change, but they didn’t stop there. They created a retention chart in Amplitude to validate that the new onboarding flow led to a positive impact. The retention chart proved that by removing hurdles in the onboarding process, ABA English doubled the percentage of users who completed their first study unit—a key indicator for long-term retention.

3. Engagement Growth
Retaining users during onboarding is a challenge. But as a product manager, you know your job is not done once users complete your critical event. You need to keep the product fresh and engaging so your users continue to find value in your platform.
With analytics software, you can identify ways to optimize the customer experience. Use your tool to identify the milestones throughout the customer journey that turn a person into a high-value user. Customer analytics software can identify what actions high-value users are taking (and how frequently). With that information, you’re empowered to encourage other users to follow a similar path.
Microsoft used multiple rounds of A/B testing to perfect their engagement strategy and quadruple the time spent in their product. After launching a new family of products within Office360, Microsoft found varying levels of engagement with these tools. To encourage high engagement across the board, the company tested feature changes that made it easier to complete tasks that Microsoft knew increased retention, such as scheduling time on their calendar for focused work.
4. New Feature Development
Your product as a whole needs to evolve with your users; otherwise, it can grow stagnant. You should use quantitative data from your product analytics software to inform the qualitative data—like customer feedback—that you need to collect.
You might, for example, use your software to analyze site searches or ways users customize your product. This information can help you brainstorm possible features and test them before fully launching.
Financial ecosystem Dave used product analytics to identify a new offering. The company knew that their most valuable customers were those who took an advance to avoid overdraft fees. The product team suspected that this group might also be interested in a new checking account offering.
To verify this idea, the team showed these users a preview of the potential new product to gauge interest. Dave found that 50% of the users who were shown the preview were also excited about a new checking product.
The company ran more tests to determine possible features of this checking product, such as increased maximum paycheck advance and no overdraft fees. One feature was preferred 2.5x over the others. With this insight, the Dave team could build the checking product from an informed, data-backed perspective.

Create a Valuable Product with Customer Analytics Software
Incorporating data from customer analytics software into your product development gives you a clear roadmap. You’re able to create more value for your customers, from launching new features to improving onboarding. Understand your users’ behavior through your software and you can create a product your customers want to come back to again and again.
Ready to build products with customer experience data? Let us show you how our customer analytics software can help. Watch our on-demand walk-through, or sign up for a live demo.

Carolyn Feibleman
Principal Product Manager, Amplitude
Carolyn Feibleman is a principal product manager at Amplitude, where she focuses on helping companies adopt digital analytics to build better products and experiences.
More from Carolyn


