Conversion Rate Trend over Time Chart

Track changes in conversion rate over time to assess trends and performance fluctuations. Ideal for product managers, analysts, and marketers aiming to monitor the effectiveness of strategies and campaigns.,
About this template
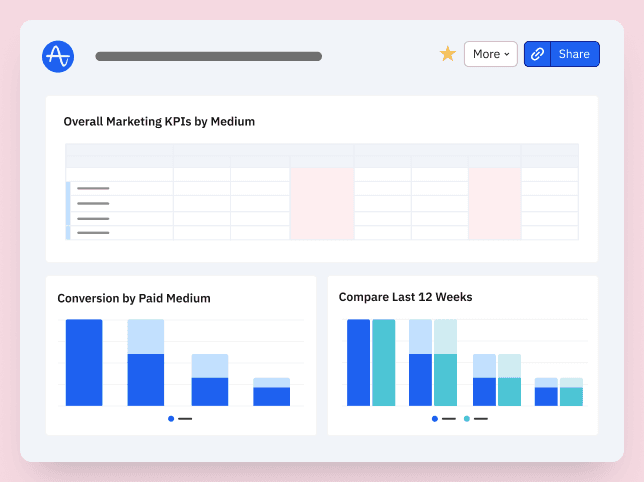
Marketing and growth teams use this chart to analyze how conversion rates evolve over time. This helps assess the long-term impact of campaigns and strategies.
This chart template is a part of Amplitude’s template library, which compiles multiple charts, like this Conversion Rate Trend over Time Chart, into a Marketing Analytics Dashboard. We have other Marketing Analytics templates that you can use to get more insights from your product.
How this template works
About Amplitude
Recommended Integrations
- Google Ads - Google Ads is an online advertising platform developed by Google, where advertisers bid to display brief advertisements, service offerings, product listings, or videos to web users.
- The Trade Desk - The Trade Desk allows advertisers to access a wide range of digital advertising inventory, including display ads, video ads, mobile ads, native ads, and more. Advertisers can use the platform to target specific cohorts based on various parameters such as demographics, interests, browsing behavior, and location.
- Customer.io - Customer.io helps you send automated email, push, SMS, and webhooks based on your customers’ activities and makes conversion tracking, optimization, and re-marketing easier.
- Hubspot - HubSpot is an all-in-one marketing tool that helps attract new leads and convert them into paying customers.
- Braze - Braze is a comprehensive customer engagement platform that powers relevant experiences between consumers and brands they love. Braze helps foster human connection through interactive conversations across channels
- AppsFlyer - AppsFlyer helps brands make good choices for their business and their customers with its advanced measurement, data analytics, deep linking, engagement, fraud protection, data clean room, and privacy-preserving technologies.
Conversion Rate Trend over Time Chart
Frequently Asked Questions
Amplitude is a leading digital analytics platform that helps companies unlock the power of their products. Amplitude guides companies every step of the way as they capture data they can trust, uncover clear insights about customer behavior, and take faster action. When teams understand how people are using their products, they can deliver better product experiences that drive growth.
Yes, Amplitude is free to get started. Our Free plan includes 2 million events per month, out-of-the-box Analytics and templates, Session Replay, Web Experimentation, and more—all at no cost.
Related templates

Conversion Rate by Channel Performance Chart

Marketing Analytics Dashboard

B2B SaaS Marketing Specialist
Growth Marketing Overview Dashboard by Ruben Lozano


