Feature Usage by Device Chart

Analyze the platforms used by users to experience the feature, providing insights into platform preferences and compatibility. Suitable for product teams, developers, and analysts focusing on optimizing platform experiences.
About this template
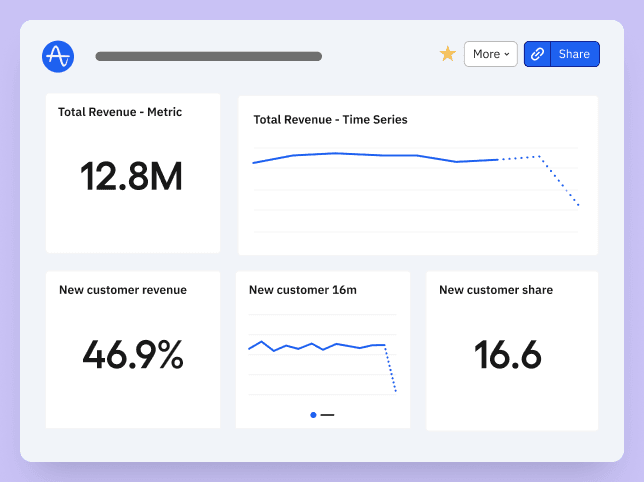
Product and growth teams use this chart to analyze how different device types influence feature usage. This helps optimize the user experience across devices and improve feature adoption.
This chart template is a part of Amplitude’s template library, which compiles multiple charts, like this Feature Usage by Device Chart, into a Feature Adoption Dashboard. We have other Feature Adoption templates that you can use to get more insights from your product.
How this template works
About Amplitude
Recommended Integrations
- ProductBoard - Productboard is a product management platform that provides a single source of truth for all customer data, helping teams uncover trending user needs.
- Appcues - Appcues supports personalized, targeted in-app onboarding messages, modals, and hotspots to guide specific user segments through a tour or to pinpoint key page elements.
- Apptimize - Apptimize empowers product teams to create the best possible experience for individual users through data-driven A/B tests and personalized promotions and feature releases.
- Hubspot - HubSpot is an all-in-one marketing tool that helps attract new leads and convert them into paying customers.
- Braze - Braze is a comprehensive customer engagement platform that powers relevant experiences between consumers and brands they love. Braze helps foster human connection through interactive conversations across channels
- AppsFlyer - AppsFlyer helps brands make good choices for their business and their customers with its advanced measurement, data analytics, deep linking, engagement, fraud protection, data clean room, and privacy-preserving technologies.
Feature Usage by Device Chart
Frequently Asked Questions
Amplitude is a leading digital analytics platform that helps companies unlock the power of their products. Amplitude guides companies every step of the way as they capture data they can trust, uncover clear insights about customer behavior, and take faster action. When teams understand how people are using their products, they can deliver better product experiences that drive growth.
Yes, Amplitude is free to get started. Our Free plan includes 2 million events per month, out-of-the-box Analytics and templates, Session Replay, Web Experimentation, and more—all at no cost.
Related templates

Product Thought Leader
Feature Tracking Dashboard by John Cutler

Feature Adoption Dashboard

Product Engagement Dashboard Template
