Question the Data: How to Ask The Right Questions To Get Actionable Insights
To derive actionable insights, we can formulate questions for these three primary components: the problem, the test, and the results.
Data: you’re probably collecting it, but are you maximizing its potential? Just possessing the raw information isn’t super useful; value has to be coaxed out through analysis. The data won’t give you any answers that you don’t ask for. So how do we come up with the right guiding questions?
We can start with the key elements of the scientific method: a hypothesis addressing a problem you have, a process to test this hypothesis, and an evaluation of the of the results. To derive actionable insights, we can formulate questions for these three primary components: the problem, the test, and the results.
- The **problem **is the unknown value or issue that you want to solve. The question that defines your problem summarizes the goal of the test, or what you want to know. It addresses an element of the product or platform that has puzzling outcomes or could be improved.
- The test is the process to investigate the query and test the hypothesis. The question that informs the testing process identifies a path to finding out what you want to know. It might target a particular metric or aspect of the product for further assessment.
- The results carry the implications of the discovery and inform the next steps that you can take. The question that evaluates the results considers the implications of what you’ve just discovered and why it matters. This question is open-ended in nature and poses a framework to prompt ideas for some potential next steps.
An analysis process may involve more than just three steps too; one set of results may inspire further questions, thus rendering it a sub-conclusion as well as a premise for the next set of evaluations.
Let’s run through this problem-solving framework in two hypothetical situations:
Example 1: Why are food delivery app NomNom’s order numbers lower than expected?
NomNom is a food delivery app; it partners with a variety of local restaurants and aggregates the ability to place orders from multiple vendors onto one platform. Recently they’ve noticed that the daily number of orders that go through their system is significantly lower than the number of users who have accessed the app. NomNom decides to probe into the data to see what’s going on.
**The Problem: Why is there such a discrepancy between the number of active users and the number of orders? **
This question explicitly defines the reason for the discrepancy as the unknown that needs to be solved.
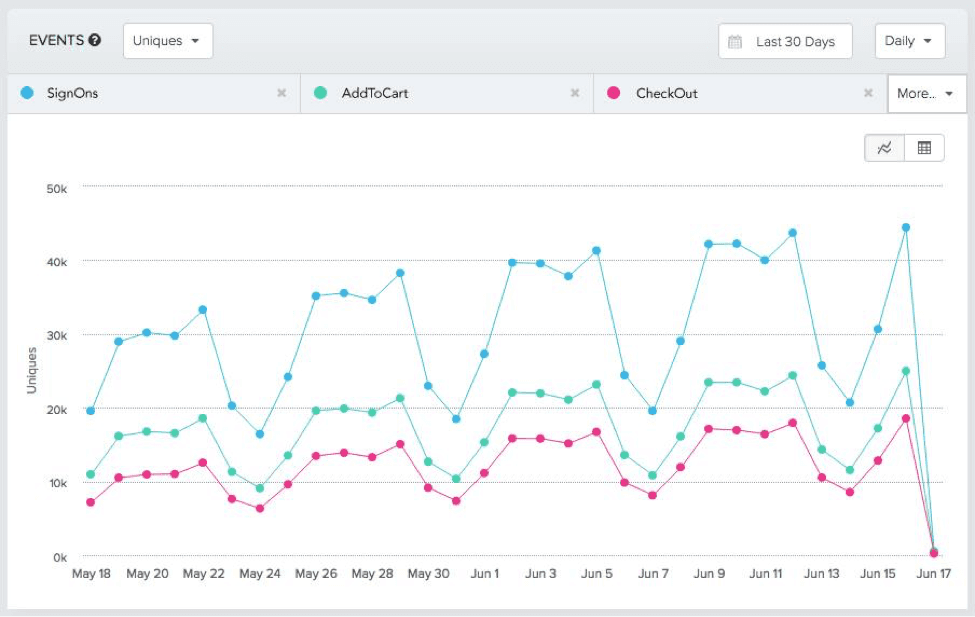
The Test: How many users are: (a) signing in; (b) adding items to their cart; and (c) completing the checkout process?
This question describes the particular metrics that will be examined to try to solve the puzzle.

Looking at the visualization of the event counts, it’s clear that the daily number of users who sign on to NomNom greatly outnumbers the number of users who add items to their carts, which in turn outpaces the number of users who complete the checkout process. The first part of that observation isn’t surprising; many users will sign on to see what food options are in the area, but not all of them will end up ordering.
What is puzzling is the severe drop-off after food options have been added to the cart, as that would seem to imply that a more significant amount of investment has been made in terms of time, decision-making and getting ready to order. The results from the first analysis add new information to the original question but hasn’t solved it yet, and as such can be both a sub-conclusion and a premise for the next set of evaluations.
The Results/The Next Test: Where in the checkout process are users abandoning their orders?
Here we have a question that simultaneously suggests a next step (taking a closer look at the checkout process) and describes what should be investigated (the point in the process where users are abandoning their orders).
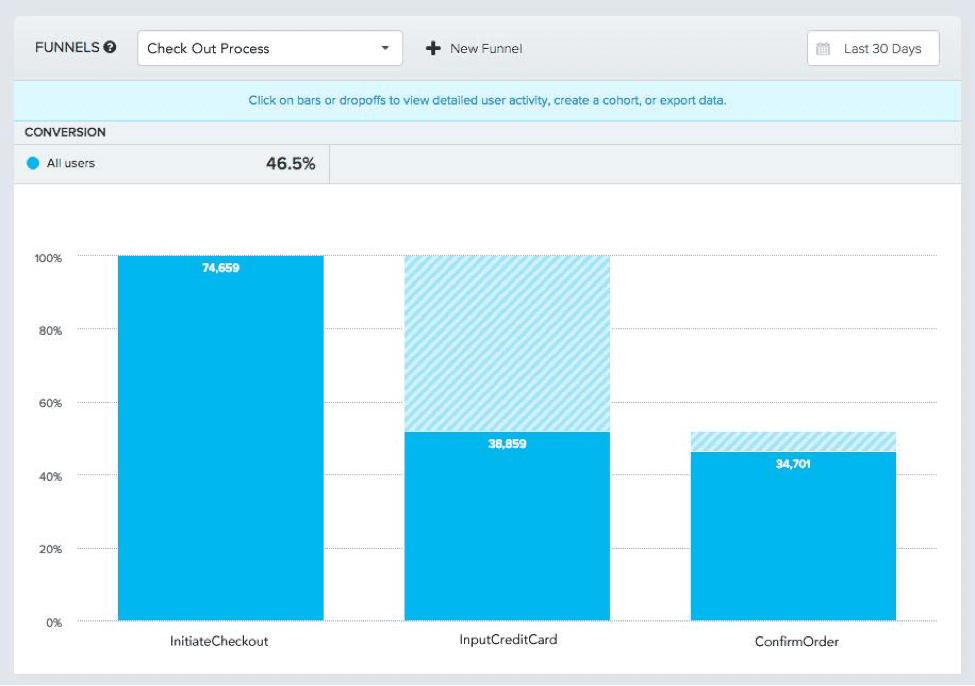
Funnels help to visualize a sequence of actions that users must take, often in the context of a conversion process; a bar graph makes it easy to visualize the conversion rate at each of these pre-defined steps. In this case, NomNom’s consecutive steps are: (1) initiating the checkout process, (2) entering credit card information for payment, and (3) confirming the order.

The funnel chart above depicts a significant drop-off (almost half the customers abandon cart!) once the page to input credit card information shows up, which happens immediately after the checkout process is initiated. However, the vast majority of users who complete this step go on to successfully confirm their order and complete the transaction. The final conversion rate, 46.5%, is displayed at the top.
From a UX standpoint, one potential explanation for this could be that people don’t feel comfortable entering their payment information right away upon navigating to the checkout without being able to confirm the contents of their order first. This presents a possible explanation which would require confirmation via further investigation. The next question will explore possible next steps based on these results.
The Results: How can we make the checkout experience more familiar and intuitive so that more users complete the transaction?
Using this question as a guide, NomNom can experiment with various fixes for the problem. For example, they could start by segmenting their user base. Categories could include: most active users, least active users, users that always complete their transactions, and users with a transaction completion rate below 50%. The UX research team could then reach out to a small sample of individuals from each of these cohorts and ask for more in-depth feedback on the checkout process. Having these buckets would allow the team to compare their findings against their “favored” user group.
Alternatively, NomNom may choose to send out a customer feedback survey instead, perhaps with an incentive such as a discount attached, to solicit general opinions from their user base. Any leanings in favor of a particular type of user would be due to self-selected reporting, as opposed to any selection bias on the part of the team.
Or NomNom may opt to continue working with quantitative data and implement an A/B test to try out various progressions of steps in the checkout process. Once they find the variation that is most successful at ensuring the highest number of completed transactions, the team could then roll out that solution across the board.
Example 2: Why is Wizard Crusades losing players?
Wizard Crusades is a multi-level time-sensitive game. Users choose from a cast of characters consisting of a peasant, a mage and an apprentice. They’re then given a series of missions, progressing along levels as they complete more and more tasks. Some of these tasks (such as planting a field of maize crops) require a certain amount of time to elapse.
Having been recently featured in a number of gaming publications, the game is doing really well in terms of new user signups. Traffic stats seem to indicate that the game is seeing decent usage too. Yet the total number of active users appears to have plateaued, causing Wizard Crusades’ data analysts to think that the churn rate may be disproportionately high.
The Problem: Why are so many users abandoning the game?
The Test: When and where in the game are users most likely to drop off?
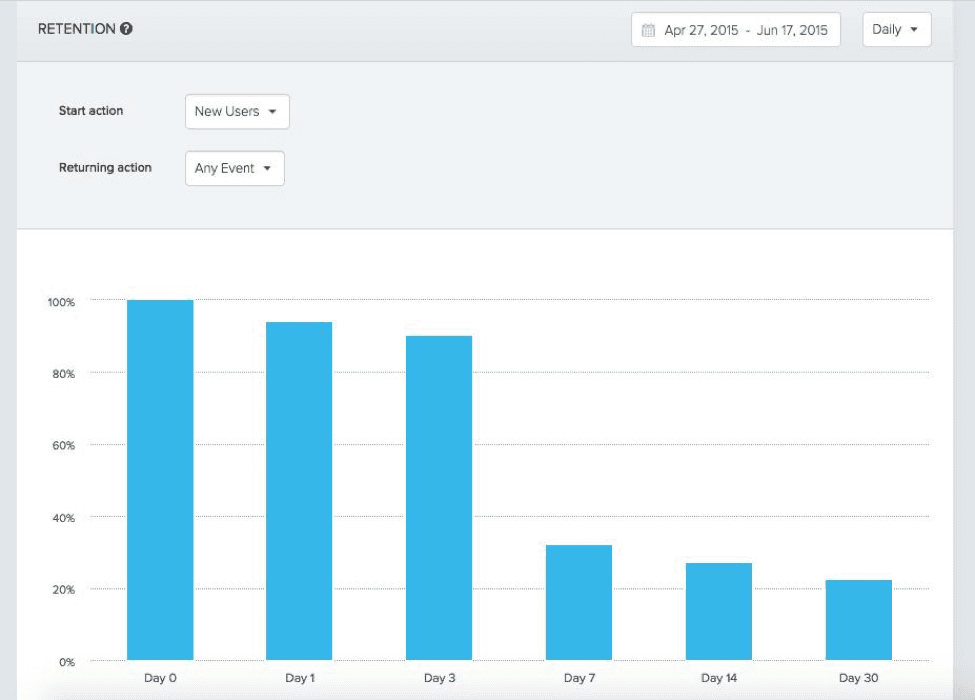
Using this as their guiding question, the Wizard Crusades team takes a look at the user retention data. The retention chart below shows the percentage of users who started on Day 0 who then returned to the game on Day 1, Day 3, etc.

As the team expected, there’s a bit of user loss over the first few days, but the large drop by Day 7 is particularly troubling.
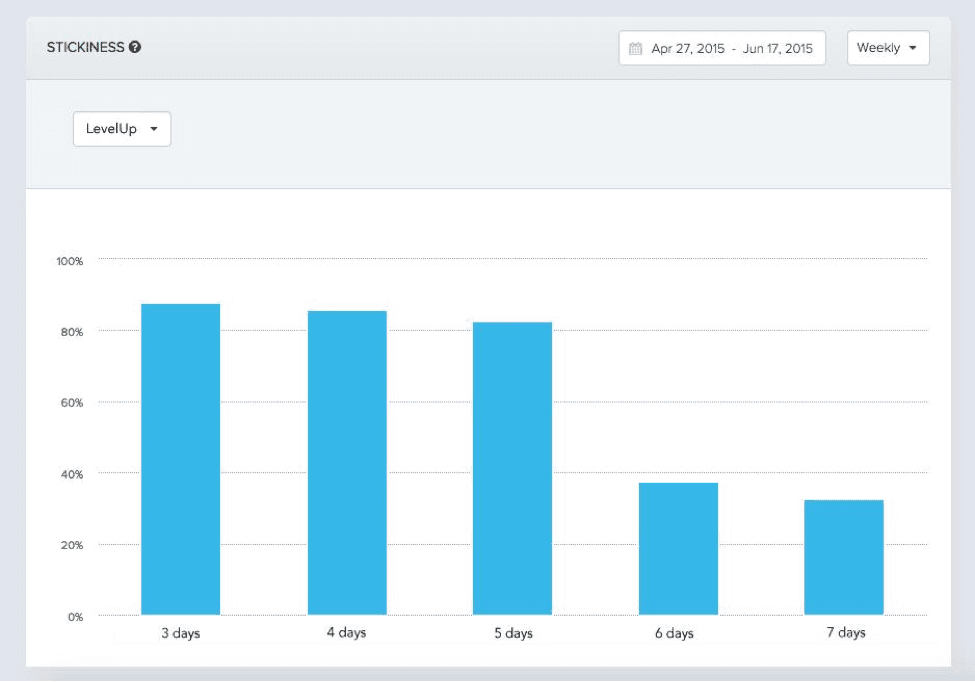
To gain greater insight, the analytics team also looks at the game’s stickiness, a metric that measures how often players are accessing the game. In the weekly stickiness graph below, we see the percentage of users who played Wizard Crusades on n different days in a given week.

Since the timeline for Wizard Crusades is more or less preset, the team has designed the game such that players must advance by at least one level per day to continue.
Looking at the graph, over 80% of users Level Up on 5 days within a week, but less than 40% Level Up for 6 or more days. The team could conclude that advancing a level for 6 or more days is significantly more difficult than doing so on only 5. Yet the difference in difficulty between 6 days and 7 days is fairly negligible, implying that gamers who power through this hardship are then able to continue advancing with little trouble.
Since the plot line of Wizard Crusades is relatively linear, the team concludes that the sudden jump in difficulty on day 6 is filtering out a lot of users and causing them to give up and quit.
The Results: How can we modify the jump in difficulty between the levels reached on day 5 and day 6 of playing the game so that the changes are more consistently incremental?
How might the Wizard Crusades team figure out what to modify? One method might be to track user paths to see how people are playing the game and which challenges people are most often getting stuck on. This would inform the team about the particular pain points that players are experiencing.
Being gamers themselves, the Wizard Crusades team might also already be aware of the steps that are particularly difficult and tweak those. Like NomNom, the team could experiment with different levels of difficulty and find the game variation that results in the most users advancing on days 6 and 7, and ultimately sticking with the game in the long term.
Your analytics data holds many important insights that can help improve your product, but you need to frame your problems and questions properly to get anything useful out of the data. By following the framework of the scientific method, you can structure your data analysis strategy to address the problem, the test, and the results, and then apply the learnings. Once the answers are in hand, all that’s left to do is act!

Daisy Qin
Digital Strategist, Nuvango
Daisy Qin is currently a digital strategist at Nuvango. After years of studying warfare strategy, public policy, political philosophy and literature, she now spends her time thinking about brand strategy and business tactics. Always on the lookout for great tacos and hot chocolate (not necessarily together).
More from Daisy


