The Tools to Win the Streaming Wars
Improve user engagement and retention across your portfolio with self-service streaming media analytics. Amplitude unites all your customer data—web, mobile, OTT, IoT—into actionable insights that drive revenue.
Media teams and digital publishers grow better with Amplitude
One self-service platform. All your customer insights.
Turn first-party data into a clear picture of each user segment—behaviors, preferences, top content—for granular insights into what’s best for customers and your bottom line.
Attract every audience using cross-platform behavioral analytics to personalize content recommendations, curate catalogs, optimize experiences at scale—and become the platform of choice.
Drive lifetime value with data-driven insights into your high-value content, campaigns, features, and users. Amplitude empowers any team to answer the questions that drive subscriptions, right out of the box.
When you know, you grow
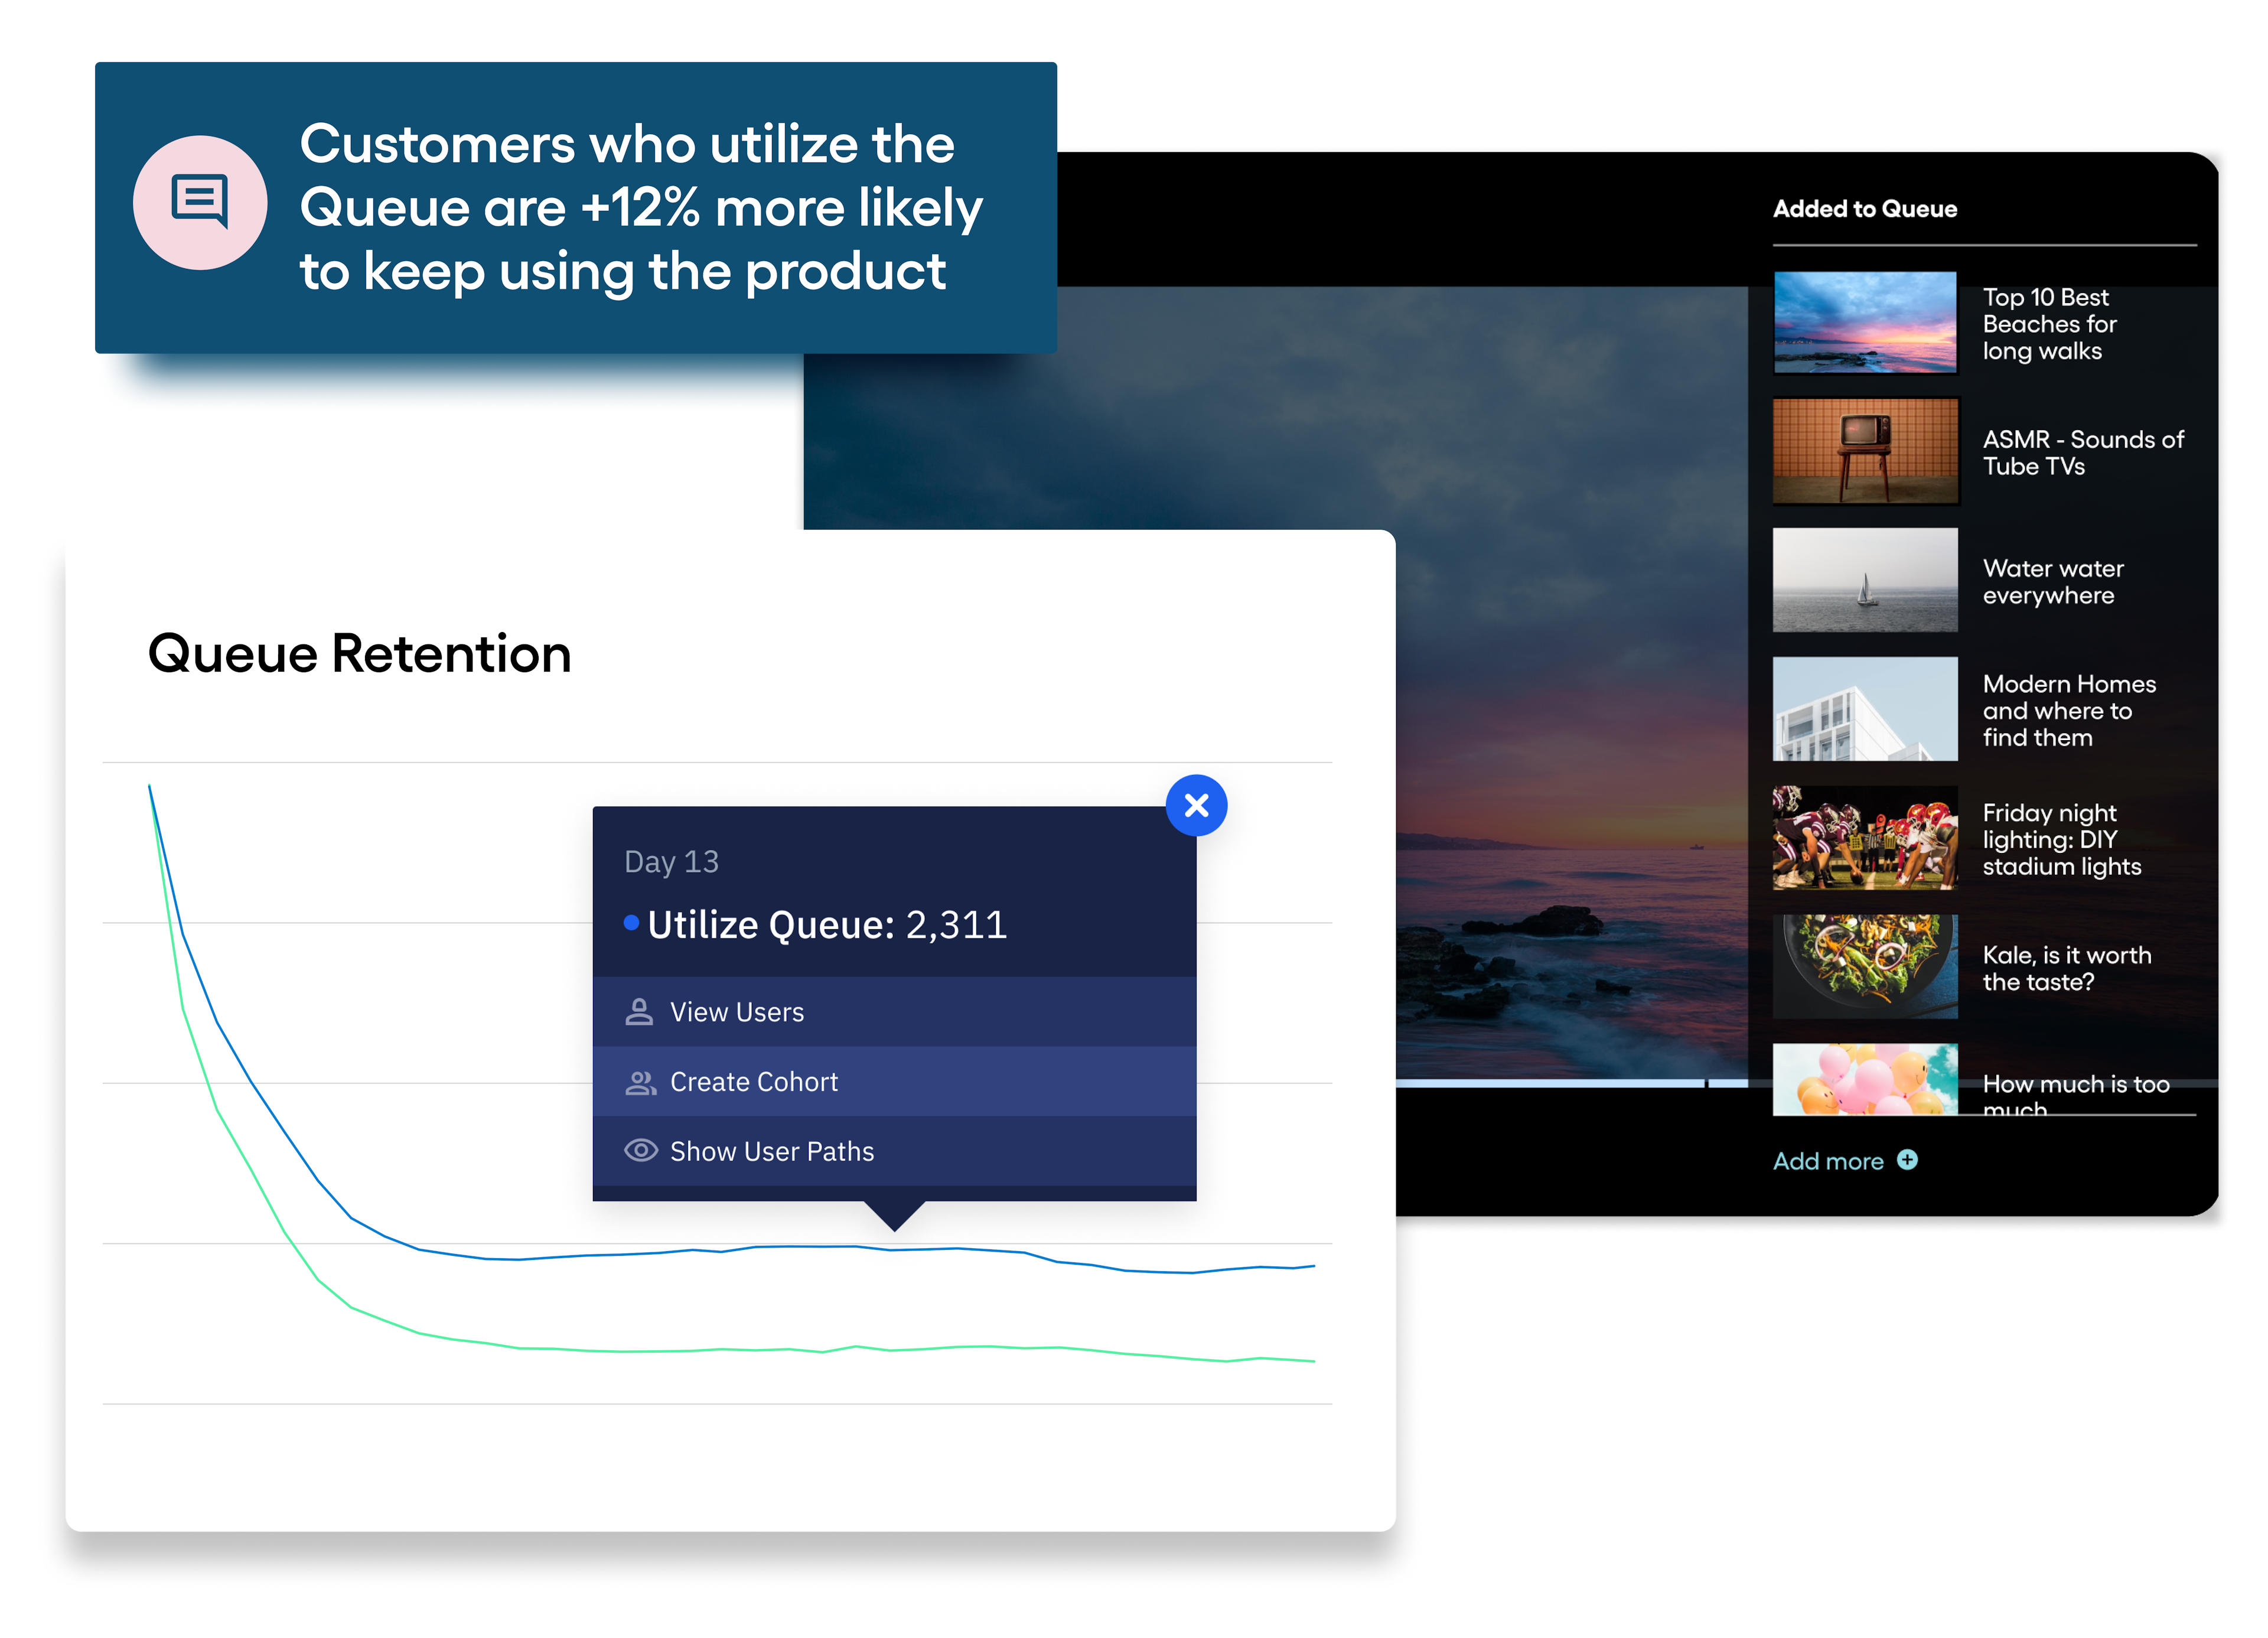
See at a glance what behaviors, content, and user segments correlate with retention—or churn—with Amplitude’s intuitive charts and instant visualizations.
Segment viewers then use your first-party data to create segment-specific engagement strategies that deliver exceptional value.
Measure ad engagement across platforms to identify the channels, campaigns, and messaging that drive growth.
See how ad delivery and personalization impact viewers to improve targeting and ensure you deliver the right message at the right time.
Measure real-time streaming metrics—unique views, average view duration, viewer retention, and more—to pinpoint your top content and grow your subscriptions.
Configure, test, and measure experiences using built-in experimentation that’s natively integrated with your first-party product data.
Learn what each audience wants
Compare how different user segments engage with content, campaigns, and platforms to discover what drives revenue by audience. Answer questions like:
- How does each user segment impact your downstream metrics?
- Which content, campaigns, and channels drive the most growth?
- What new features or messaging, when tested, measurably improve the user journey?
Discover how to stop churn
Identify the behaviors, content, and cross-platform experiences that predict loyalty—or churn—by user segment. Answer questions like:
- Who are your power users?
- What features correlate with retention?
- How does retention compare between different payment plans? Revenue models?
Boost audience engagement
Encourage your audience to take key actions with personalized experiences based on behavioral insights.
- Guide users through high-value journeys to boost engagement.
- Prompt users to explore new features and promotions to reduce churn.
- Test targeted messages to increase conversions and revenue.
See where viewers drop off, and why
Visualize any number of user journeys in one timeline to see which paths lead to conversion, churn, and loyalty. Answer questions like:
- Where do users encounter friction?
- What’s stopping subscriptions—Friction? Content? Pricing?
- What product milestones lead to subscriptions? Loyalty?
Correlate efforts with outcomes
Track lifetime value to see how product changes impact revenue and uncover the best way to turn acquired users into subscribers. Answer questions like:
- How do ads, freemium, subscriptions, and paywalls impact revenue?
- How quickly do different user segments convert from a free trial to a subscription?
- Which podcasts or other content drive subscription revenue?
Test experiences to unlock growth
Use built-in A/B testing to measure impact, validate ideas, and optimize every touchpoint using authoritative insights, no analyst support required. Answer questions like:
- Where and how can you adjust the user experience to boost engagement?
- How do feature changes impact activation and subscription?
- What campaigns, experiences, and CTAs best drive subscriptions? Retention?
“It’s data science in a box…[Amplitude] allows us to move faster, experiment quicker, and understand our users better to take more immediate action to improve our customer experience.”
Customer Success
Forrester names Amplitude a Leader and a Customer Favorite
Looking to align product and marketing teams on one powerful self-serve analytics platform? Amplitude delivers. See how we earned 5/5 scores across 21 criteria in The Forrester Wave™: Digital Analytics Solutions, Q3 2025.
