FinTech Dashboard
Empower your FinTech initiatives with our essential dashboard. Track weekly sign-ups, channel conversion rates, and platform usage. Dive into user behavior from bank connection to money transfer, optimizing engagement and retention. Ideal for product and marketing teams in FinTech seeking actionable insights for growth and user satisfaction.

About this template
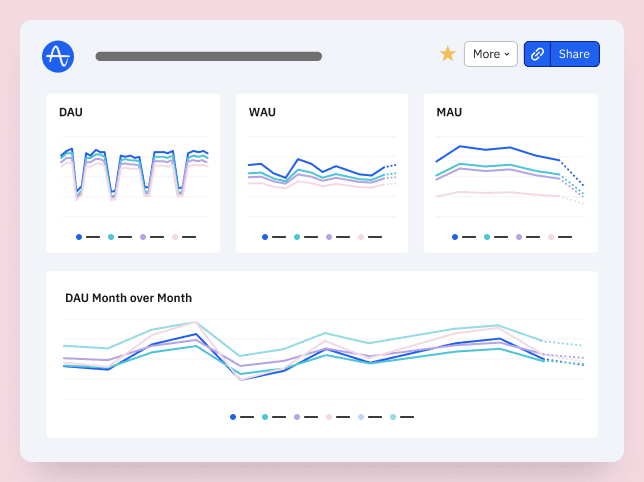
Amplitude's FinTech dashboard offers a robust view of charts to help measure user acquisition, user engagement, and deeper conversion metrics within your FinTech product.
User Acquisition Charts
- How many users sign up per week?
- Which marketing channels have the most conversion to signups?
Basic Engagement Metrics Charts
- What is the distribution of platforms used?
- What is the average session length per user by platform?
Deeper Conversion and Engagement Metrics Charts
- What percent of users who sign up then connect their bank?
- What is the conversion of users who connect a bank and then transfer money?
- How long does it take a user to transfer money?
- What actions do users take after they start the money transfer process?
- How frequently do users submit money transfers?
- What is the monthly retention of users who come back to transfer money?
How this template works
About Amplitude
Frequently Asked Questions
Amplitude is a leading digital analytics platform that helps companies unlock the power of their products. Amplitude guides companies every step of the way as they capture data they can trust, uncover clear insights about customer behavior, and take faster action. When teams understand how people are using their products, they can deliver better product experiences that drive growth.
Yes, Amplitude is free to get started. Our Free plan includes 2 million events per month, out-of-the-box Analytics and templates, Session Replay, Web Experimentation, and more—all at no cost.
Related templates

Head of Data & Analytics
Mobile Subscription App Engagement and Retention Dashboard by Olga Berezovsky from MyFitnessPal

Marketing Analytics Dashboard

Product Analytics KPI Dashboard Template Example


