Media Dashboard
Enhance your media strategy with our robust dashboard. Track weekly sign-ups, channel conversions, and content consumption metrics. Gain insights into user behavior, including search-to-view patterns and purchase behaviors. Analyze session lengths, session frequency, and distribution. Perfect for teams seeking to optimize content engagement and drive conversions.

About this template
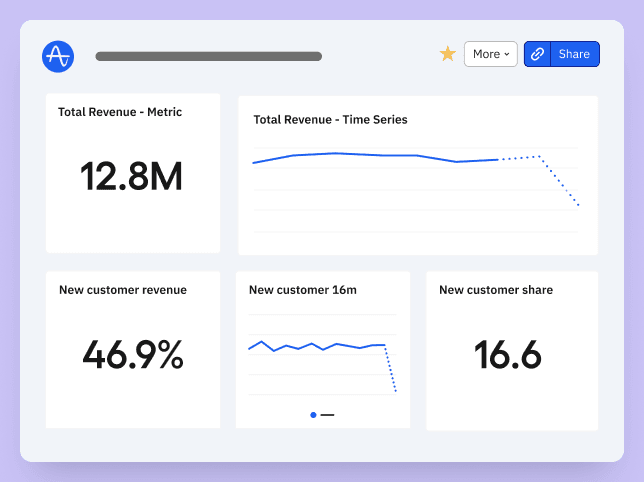
Amplitude's media dashboard offers a robust view of charts to help measure customer acquisition, user engagement, conversions, and retention for your media business.
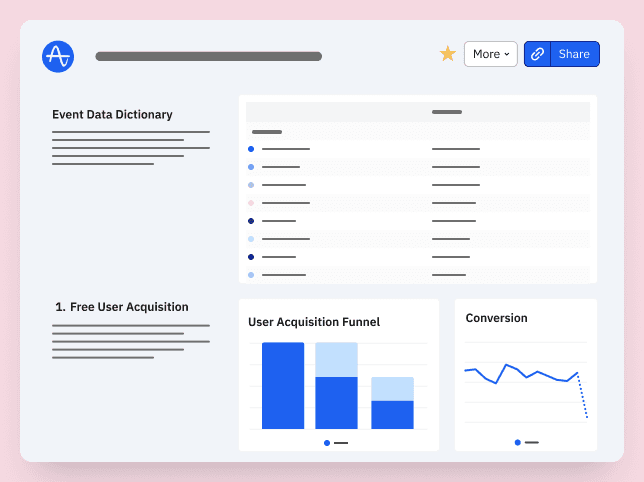
User Acquisition Charts
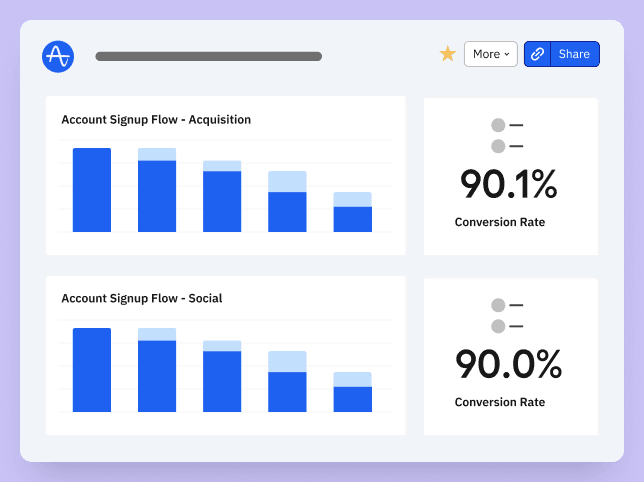
- How many users sign up per week?
- Which marketing channels have the most conversion to sign-ups?
Basic Engagement Metrics Charts
- What is the average count of content viewed by user per day?
- What is the percentage of content viewed per user per genre?
- How many users view content on a computer vs phone vs TV?
Conversion and Session Metrics Charts
- What percentage of users perform a search and then view content?
- What percent of new users make at least one purchase, within 7 days?
- How much time does it take new users to make at least one purchase?
- What do users do before they make a purchase?
Session & Retention Metrics Charts
- What is the average session length?
- What is the average number of sessions per user?
- What is the distribution of session lengths?
How this template works
About Amplitude
Recommended Integrations
- Snowflake - Snowflake makes it easy to amass all your data, enable rapid analytics, and glean data-driven insights for all your business's users.
- Databricks - Databricks is a cloud-based platform that provides a unified environment for data engineering, data science, and analytics. Built on Apache Spark, it offers collaborative notebooks for teams to work with data, build models, and automate workflows across big data processing and machine learning tasks.
- Census - Census empowers data and business teams to sync cloud data warehouses to business tools so they have access to the data they need.
Frequently Asked Questions
Amplitude is a leading digital analytics platform that helps companies unlock the power of their products. Amplitude guides companies every step of the way as they capture data they can trust, uncover clear insights about customer behavior, and take faster action. When teams understand how people are using their products, they can deliver better product experiences that drive growth.
Yes, Amplitude is free to get started. Our Free plan includes 2 million events per month, out-of-the-box Analytics and templates, Session Replay, Web Experimentation, and more—all at no cost.
Related templates

Interim Product & Growth Executive, Board Member
Product-Led Growth Template Dashboard by Leah Tharin

Session Engagement Dashboard

Founder & Data Engineer @ Deepskydata
Ecommerce Core Metric Tree Dashboard by Timo Dechau

Head of Growth at Labelbox


