How the Fastest Growing Game In the App Store Retains Its Users
This past May, Amplitude Head of Product Justin Bauer spoke with Stefanía Bjarney Ólafsdóttir, Head of Data at Icelandic mobile gaming startup QuizUp.


Building a data-driven culture isn’t easy. You need goals, metrics to track your progress, and an understanding of just what constitutes success. An obsession with data has to permeate every level of your organization and guide you in everything you do.
We love talking to our customers about how they’ve done it, and we especially love when we can share their insights with you. This past May, Amplitude Head of Product Justin Bauer spoke with Stefanía Bjarney Ólafsdóttir, Head of Data at Icelandic mobile gaming startup QuizUp. They talked about the importance of data, how and why QuizUp wound up using Amplitude, and what challenges they’ve faced on the way to becoming a truly data-driven organization. Check out the full webinar here, or keep reading to learn more!
What Is QuizUp?
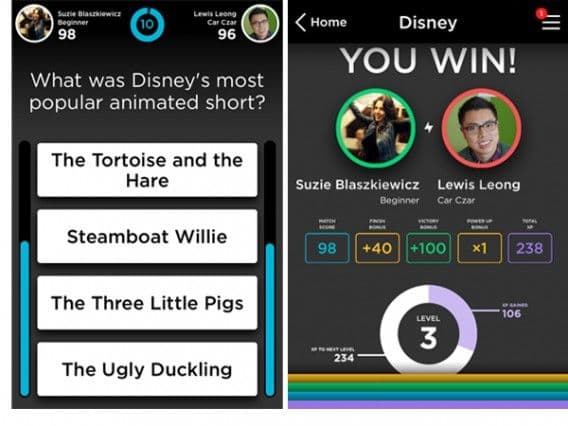
QuizUp is a mobile game developed by the Iceland-based studio Plain Vanilla Games. The game lets users make profiles, take quizzes from over 550 fields, and compete head-to-head with friends and strangers.
“QuizUp became the fastest growing game in App Store history.”
Eight days after its release on the App Store, QuizUp had signed up 1 million users. Within three weeks, that number was 3.5 million—QuizUp became the fastest growing game in App Store history. Stefanía Bjarney Ólafsdóttir joined QuizUp as Head of Data in November of 2013. As a former computational geneticist, she’d cut her teeth writing algorithms and running statistical analyses on the human genome. Over the next few years, the amount of data QuizUp’s users were producing exploded, giving Ólafsdóttir and her team a gigantic cache of data on user behavior to draw insights from. The way they honed their process on the fly to create a truly data-driven culture in the midst of massive growth is a great lesson for any company trying to understand its customers.
Why Data Is Critical To QuizUp
The hockey-stick-shaped growth curve isn’t always a good thing. When products grow slowly, teams can look closely at their users and talk to them. They can identify what’s not working and double down on what is, gradually improving their product until what they have is truly refined.
When you get 3.5 million users in three weeks, that’s a lot harder to do—but it’s no less important. No product is perfect at launch. QuizUp had to hit the ground at a full sprint when it came to using data to get better.
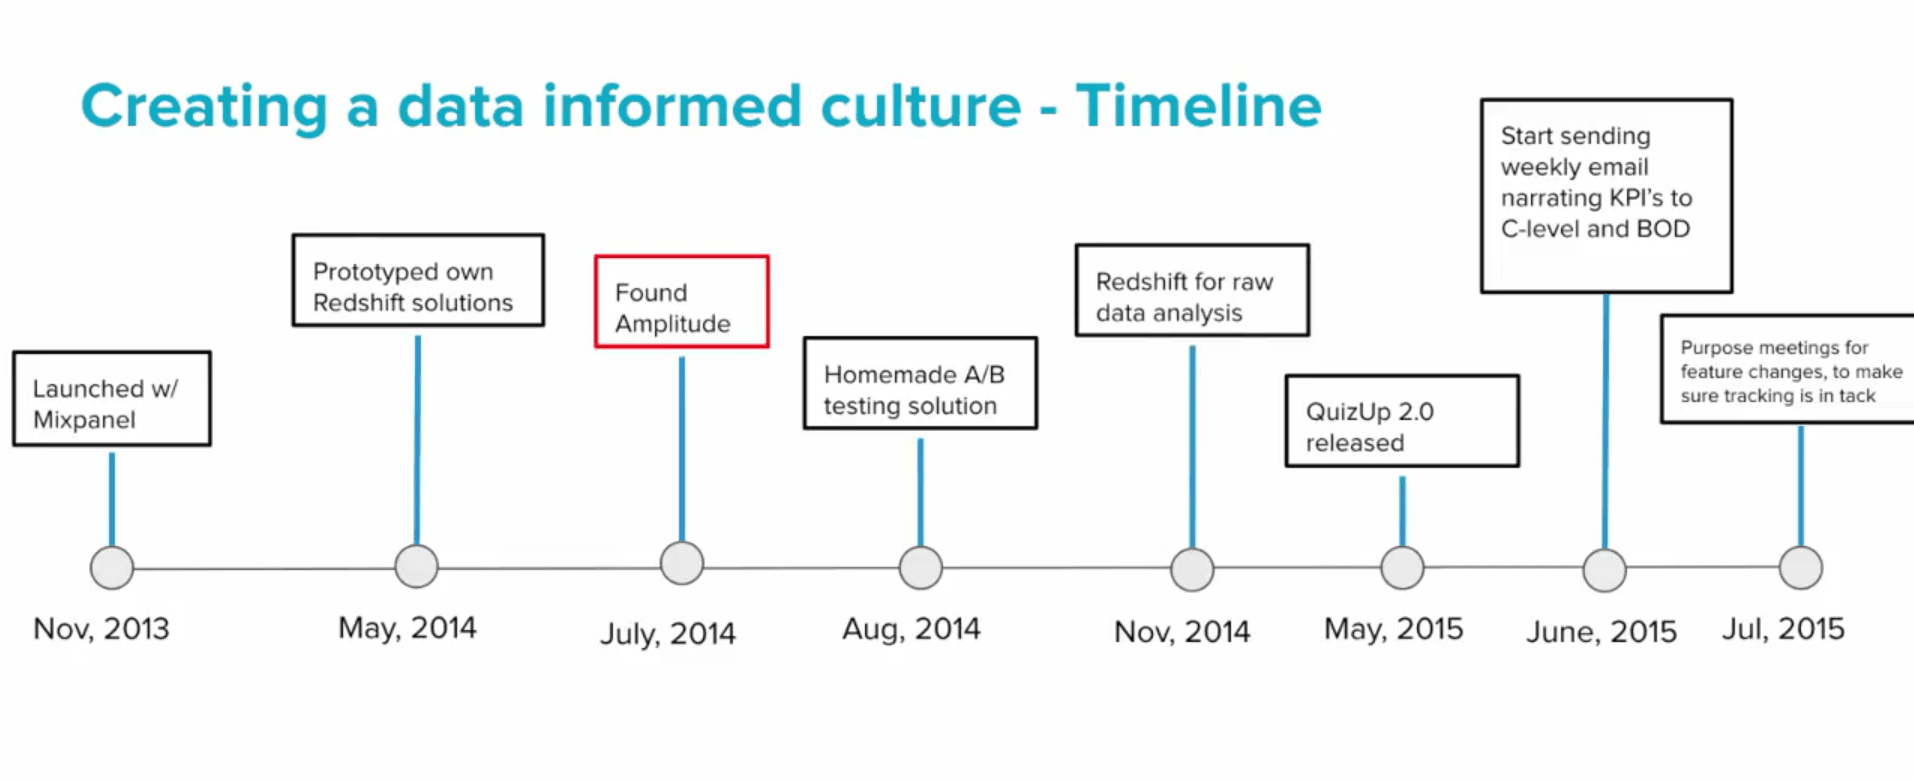
After their first period of massive growth in November 2013, QuizUp started using Mixpanel to track their data—but quickly found it insufficient. They needed access to more of their raw data, so they started rigging together their own Amazon Redshift pipelines. This gave them what they needed, but it involved a lot of time and engineering work to get up and running.
Amplitude offered QuizUp the ability to send events through Redshift pipelines without hiring a full-time engineer to maintain them. The different UI views let them draw quick insights into user behavior. And its extensibility made it easy to incorporate A/B testing into their development process.
In May 2015, the team launched QuizUp 2.0. Their largest product change since launch, QuizUp 2.0 was the culmination of a year and a half of data collection and analysis. Here’s how they did it.
How To Start A Data-Informed Culture
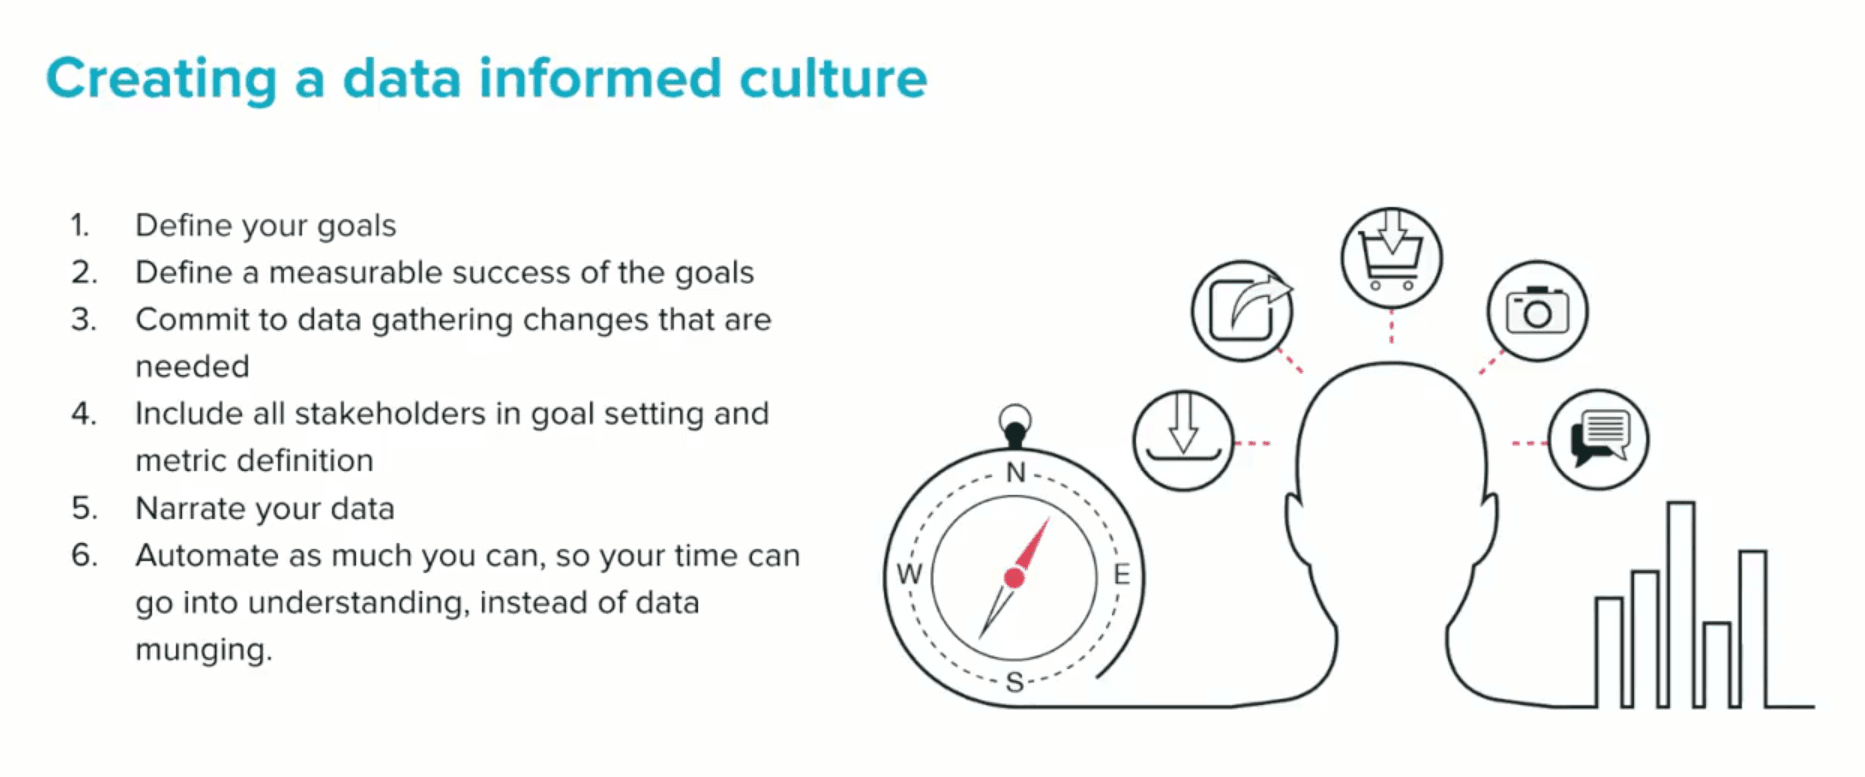
1. Define Your Goals
In looking at their data on how often certain groups of users stuck around and kept using QuizUp, one trend stood out. Users who took advantage of the social aspects of the game, who had friends on the platform and played them regularly, stuck around a lot longer. Retention is king. With that in mind, the QuizUp team set improving retention by emphasizing social as their primary objective for the launch of QuizUp 2.0.
This kind of higher-level goal doesn’t just orient your data collection—it has a much more powerful effect, and it’s one that permeates the company at every level. It unites people behind an idea. When that idea is improving user retention, all the progress you make toward it helps build a stronger company with more stable revenue.
2. Define success
To figure out whether they were making progress toward their goal, QuizUp needed metrics. They also needed to avoid becoming completely burned out after collecting all the data they wanted–something that can too quickly lead you down a rabbit hole if you don’t know what you’re looking for.
“Your team needs clear KPIs to rally around, not just a high-level goal and a pile of raw data.”
When you’re collecting a ton of data, your team needs clear KPIs to rally around, not just a high-level goal; otherwise, things are going to get confusing really fast. When QuizUp was planning to ship a new feature, they’d start by asking some fundamental questions:
- Where is this on the impact-effort scale?
- How does it relate to the larger goals we have for the product?
- What are the most important metrics we can use to track our progress?
- What are the least important product metrics we can use to track our progress?
In answering them, they’d devise a plan for executing and measuring their success:
- Ideally, every change would be high-impact and low-effort, i.e., improve the in-game experience for a large amount of users with minimal work required.
- Progress on this project has to feed into the larger goal. If it doesn’t, it’s not important.
- Metrics should be ranked. The most important kinds of data to collect should be prioritized.
- The data that’s not as helpful or that’s too time-consuming to implement should be set aside.
By asking and answering these questions, the QuizUp team could devise a set of effective metrics for any project. They were able to focus their developers’ time on the data that really mattered and understand what would make them successful and what would be just noise.
3. Change how you gather data if needed
One of the biggest challenges in building a data-driven culture is avoiding the procedural pitfalls that come along with it. For instance, involving your developers in high-level data discussions. You need to have the people who will be implementing your ideas present from the beginning so they can tell you if such-and-such piece of information is going to take minutes or days to get together.
You’ll save a lot of time down the road that way. You should also make sure that you have absolutely no tracking bugs caused by mismatched IDs or an improper configuration. It’s not just because your data will be off. It’s because allowing a loss in data quality at any point compromises the integrity of the entire operation.
Until you have everything working smoothly, every single insight gleaned from the data will be subject to this question: “Well, isn’t that just because of that tracking bug?” Make your data inscrutable.
4. Include all stakeholders
“Purpose meetings” are central to data analysis at QuizUp. These occur when the stakeholders in a project—managers, data scientists, developers—get together and talk in-depth about feature releases:
- They start at a high-level and discuss the overall goal.
- They discuss the metrics they’re using to track success.
- They start slicing the new feature into individual sections, looking for edge cases where their assumptions break down.
These meetings are designed to clarify every aspect of a new project and get people into alignment over KPIs but also to get the team excited. Slicing it down into sections creates ownership, and makes every individual person on the team feel responsible for some part of it. They know what their contribution should be, they know exactly how to track whether they’re delivering on it, and they know what success looks like.
5. Narrate your data
As the project rolls on, it’s important to update all stakeholders on what the data is saying and how you’re interpreting it. This includes people like the C-suite and Board of Directors: being open about the data you’re collecting is the only way to get everyone on board with the idea of a data-driven culture. That means narrating your data.
A graph is not interesting in and of itself, and no one is going to read your mind to understand what it means. Ólafsdóttir finds herself asking others on her team to explain their findings a lot even when she knows just what they mean. “It’s amazing how much your knowledge increases trying to tell someone else about something… the value of the data really increases by like 300%,” she said.
“It’s amazing how much your knowledge increases trying to tell someone else about something… the value of the data really increases by like 300%.”
One of the fundamental principles she’s instilled at QuizUp is that graphs and charts and all kinds of data visualization are really good at producing questions. Producing answers—that’s a job for humans. The only way to translate data into understanding is by explaining it to other people, and that’s also the only way that you’re going to get an entire team on the same page about what’s happening.
It also completes the loop of authority created by the purpose meeting. By having individual contributors explain the results of experiments on which they had authority, they create clear accountability and standards for data collection throughout the organization.
6. Automate everything you can
Automation is often overlooked in data analytics but it can be a massive boost to your productivity.
“For Ólafsdóttir, if a process regularly took 15 minutes out of someone’s day, it was time to write a script to automate it.”
QuizUp would sometimes supplement Amplitude’s dashboards with dashboards of their own. It’s easy to let one-off projects like that become manual labor, and what QuizUp did was simply write scripts that would produce certain dashboards for them over and over again.
When it came to querying up raw data, they would use cron jobs that update tables for them on a running basis. Instead of waiting for it to process, it’d be right there when they needed it.
For Ólafsdóttir, if a process regularly took 15 minutes out of someone’s day, it was time to write a script to automate it.
The big challenge here is for non-developers who aren’t as used to the idea of automation. Those without programming experience need to be especially vigilant for aspects of their work that are repeatable, and they should find an engineer to help them figure out a solution when they do.
At QuizUp, it’s all about automating absolutely everything possible. That leaves the QuizUp team with maximum time to focus on what computers can’t do.
QuizUp and Amplitude
Building these processes with clarity and rigor as the guiding principles helped QuizUp massively boost their retention. After noticing that QuizUp 1.0’s users were more engaged the more they used social features, they built a road map to an even more social QuizUp 2.0. But it took a lot more than a clear goal to get them there. To do that, they had to build their entire company around the idea of asking questions of data.
Today, it’s a QuizUp requirement that when you have gut feelings about things, you ask questions. To answer those questions, you look to the data. And when you’re looking for the data, you go to Amplitude.
“The first time you ask me a question now, I will tell you the result and show it to you in Amplitude. The second time, I will tell you how to do it in Amplitude. The third time I say go to Amplitude,” says Ólafsdóttir.
A truly data-driven culture lives and dies on the old idiom about teaching a man to fish—there’s not a single person who should be out of the loop on the way that users are actually behaving. And providing that data piecemeal, on an individual basis, is not the solution. The solution is getting everyone on the team actively involved in asking their own questions of phenomena and answering those questions with data.

Archana Madhavan
Senior Learning Experience Designer, Amplitude
Archana is a Senior Learning Experience Designer on the Customer Education team at Amplitude. She develops educational content and courses to help Amplitude users better analyze their customer data to build better products.
More from Archana


