How We Accelerated the Adoption of Amplitude at Preply
Uncovering an inspiring case study from our data team
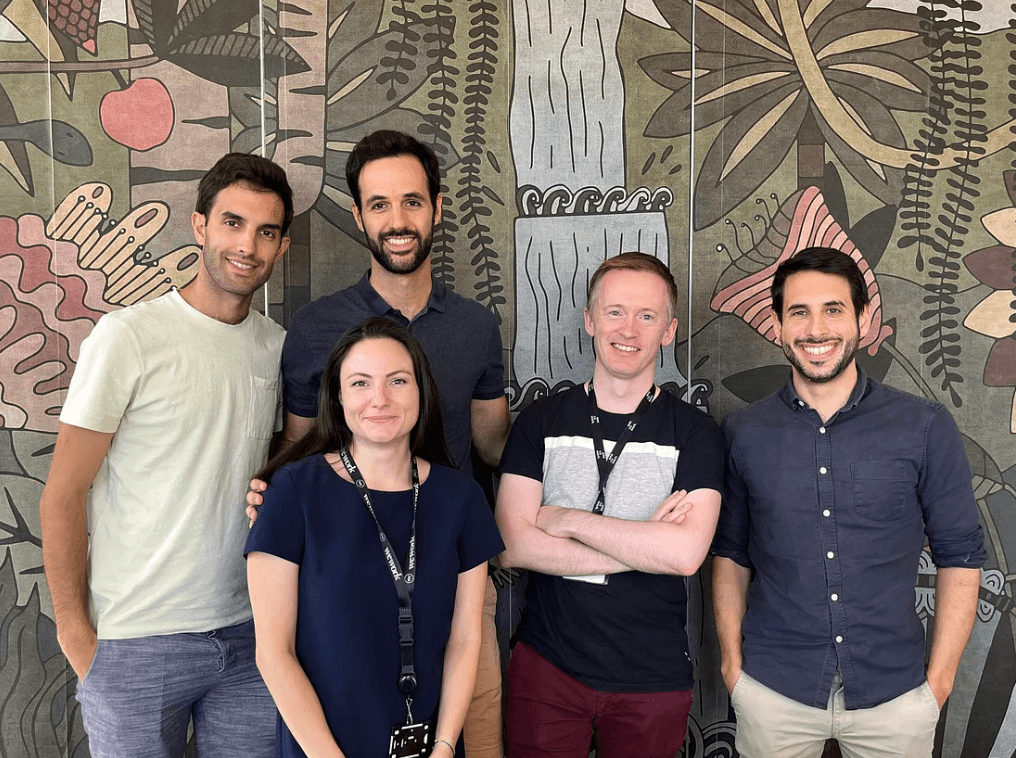
This post was originally published on Preply's blog and is co-authored by Quentin Laveau, Senior Analytics Manager at Preply. Quentin is a Senior Analytics Manager at Preply with a proven track record of driving business success through data-driven insights. With extensive experience as a Senior Strategy & Data Analyst at Booking and currently leading the strategy analytics efforts at Preply, Quentin is passionate about fostering a data-driven culture that empowers organizations to make informed decisions, optimize processes, and achieve their strategic goals.
Building a data training ecosystem at the organization from scratch
Preply is an online language learning marketplace, and unlocking human potential through learning is ingrained in our company’s DNA. We prioritize our employees’ professional development and firmly believe that continuous learning together can have a profound impact on the entire organization.
One of the ways we put this belief into action is by driving learning initiatives. Adopting new data tools across an entire organization can be a challenge, but it’s one that Preply, like many other companies, faces head-on. We like to see challenges as opportunities in disguise and aim to approach each with determination and innovative solutions.
For that reason, we initiated the Data Academy project, which consists of comprehensive training, interactive workshops, engaging quizzes, and other activities. We aim to educate our colleagues and empower them to make more data-driven decisions through these resources. One of our most significant accomplishments is the Amplitude training, and we are excited to share with you the valuable insights we have gained from it.
Why Amplitude?
Let’s begin with an overview: Amplitude is a product analytics platform that enables businesses to track visitor behavior and conduct collaborative analytics. It allows us to gather data on users’ actions and analyze them through the platform’s robust capabilities. Its primary objectives are to streamline the analysis process, minimize the time spent on ad hoc requests for data analysis, and empower non-data teammates to be more self-sufficient. Moreover, by leveraging Amplitude, we aim to foster a culture of generating more data-backed hypotheses.
We started using Amplitude two years ago. By the middle of 2022, we had accumulated a substantial amount of historical data, and some of our teammates had started utilizing the platform. However, we identified areas for improvement, which prompted us to embark on this educational project.
Preparing and defining the audience
Our initial target audience was the product team. We specifically chose to focus on this team because Amplitude primarily stores front-end events, which provide valuable insights into feature usage and retention, interaction with interface elements, and other product-related aspects.
Our objective was to ensure that all team members could access and utilize data effectively, leading to quicker response times and a decrease in ad-hoc data requests sent to the data team. However, we noticed that not all team members fully embraced the Amplitude tool. To tackle this issue, we launched a research project to discover why.
First, we wanted to understand the pain points experienced by our team members. To do this, we designed a survey and shared it company-wide, with a particular focus on our core audience. The survey consisted of specific questions, such as “What, if anything, has made you reluctant to use Amplitude in the past?” and “What would you like to accomplish with Amplitude?” We aimed to collect qualitative data regarding the barriers and the tasks that needed to be fulfilled.
The insights we gathered revealed a strong intention to use the tool, but people felt they lacked expertise. The main obstacles identified were the uncertainty surrounding available data, the lack of hands-on experience, and some mistrust in the accuracy of the collected data.
Next, we looked at solutions. We decided these challenges could be addressed through a targeted training program designed to provide hands-on experience using relevant data for our colleagues’ day-to-day tasks. To ensure comprehensive coverage of the problem, the product and data teams collaborated on three key objectives: tracking, training, and usage. This approach aimed to improve data collection practices and increase overall adoption.
We also initiated the measurement of current tool usage and gathered comprehensive data on our internal activities. Our analysis revealed that a significant number of users primarily engaged in reviewing the charts. However, our objective was to encourage a higher number of users to actively create content rather than just review or share it. This is because we firmly believe that by fostering more content generation, we can set a positive example for other users and inspire them to do the same. Additionally, the act of chart creation ensures that users obtain answers to their queries.
To create content in Amplitude, users can create new charts and save them once completed, or they can duplicate existing charts. Our observations revealed that new users often chose a third option, which was to modify existing charts to meet their specific needs. This prompted us to include “modify” as an active event. As a result, we are now fully dedicated to improving the Weekly Active Users (WAU) by focusing all our efforts toward this goal.
Designing the training
For our target audience, we defined two tiers:
- Tier 1: Product Managers (PMs) and designers
- Tier 2: Developers and other roles within the product team
To map out the learning journey, we identified five key takeaways that trainees should internalize by the end of the training program. We carefully considered the design aspects, determining which content should be front-loaded (e.g., videos, quizzes, and reading materials) and which would be suitable for live sessions. We also explored relevant use cases to enhance the learning experience.
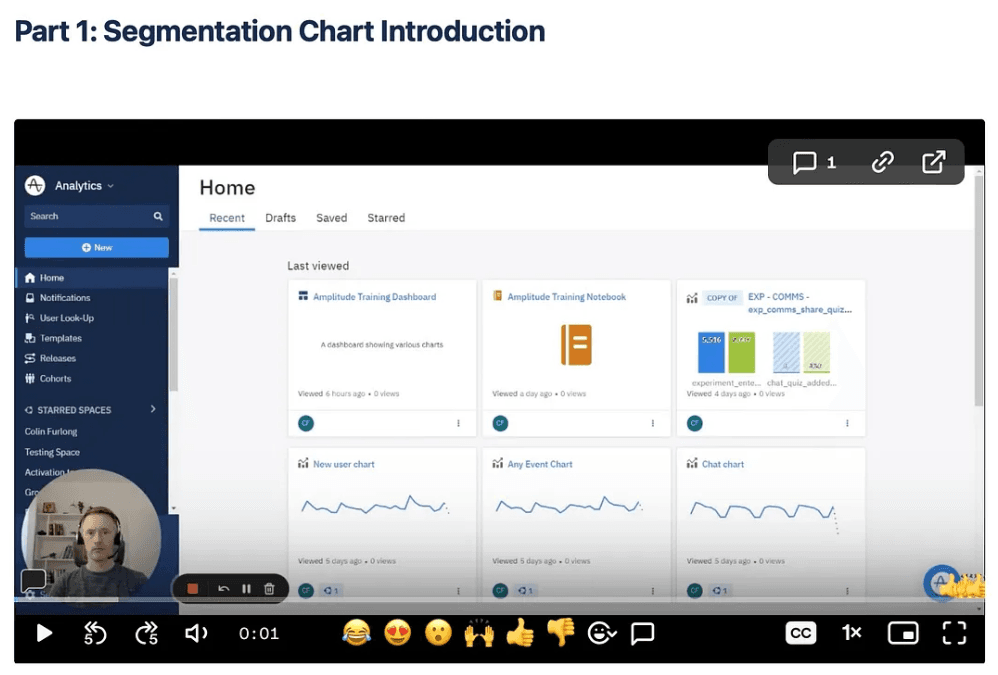
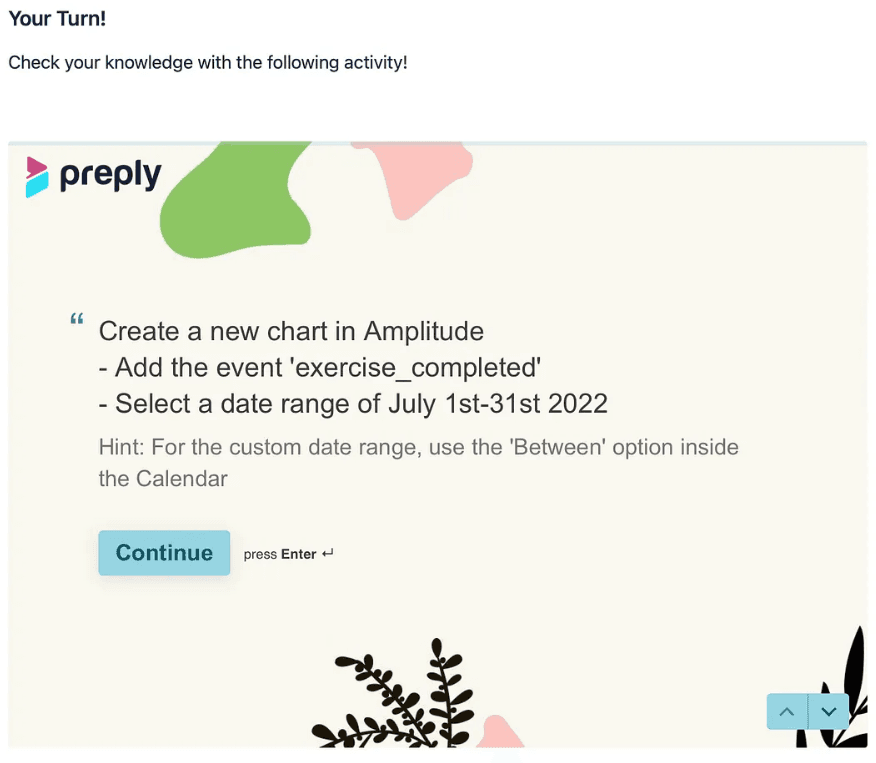
To create content, we recorded videos using Loom, which were then compiled into a Confluence page. The first part of the training focused on Amplitude basics, with bite-sized videos that combined slides and interface walkthroughs presented by our in-house Amplitude expert. Each section was complemented by a quiz, requiring users to independently explore the data to solidify their knowledge.
The second part of the training consisted of live sessions facilitated by the data analysts from each squad. These sessions emphasized hands-on exercises tailored to each team, ensuring they were as relevant as possible. In practice, the live sessions included a demonstration of cases related to the team’s area, followed by breakout room activities where groups of three to five teammates collaborated on the exercises. We aimed to create an environment for individuals to exchange knowledge, fostering a mutual learning experience rather than a one-sided teaching approach.

Extract of the Segmentation chart video with Colin walking the students through the Amplitude interface

Quiz created with Typeform embedded in the Amplitude Training Confluence page to reinforce learnings from the video
Measuring results and business outcomes
We measured the effectiveness of the training by collecting feedback at the end of each session. This was requested through a form after completing the training, allowing participants to share their insights and suggestions. Additionally, we conducted an “Amplitude retro” with our teammates to better understand each team’s specific needs.
The results exceeded our expectations. The training received high recognition for its overall quality, with a Net Promoter Score (NPS) of 89 in the post-training feedback. The self-paced component of the training achieved a rating of 4.8 out of 5, an impressive score for the first attempt. Approximately 60 out of 90 enrolled participants completed the self-paced section, and around 80 individuals actively joined the live sessions. The feedback we received was overwhelmingly positive, especially considering that it was the first training of its kind at Preply.
We also received suggestions and requests, and many of these revolved around the desire for more learning opportunities, including longer sessions, advanced content for experienced users, and increased frequency. These requests served as an encouraging indicator of the impact of the training.
Based on this positive feedback, we organized a second session for each team to ensure all team members had enough hands-on experience and the opportunity to ask questions.
Additionally, we analyzed the data on tool usage and observed a significant increase in our key metric of WAU, which had doubled in number. Even after completing this training phase, we continued to follow a sustained positive trend, indicating the establishment of new data-related habits within our product team.
We also observed significant and quantifiable business outcomes. Here are a couple of examples where we discovered valuable insights through Amplitude, resulting in positive impacts on the business:
- We noticed a drop in the checkout conversion rate in the iOS app and a rise in Apple Pay users. In response, we made Apple Pay the default option, resulting in a 5% increase in the conversion rate for new subscribers in the B group.
- In our analysis, many Preply users faced a “no hours left” modal. We found that students preferred adding hours to their plan rather than switching subscription type. In response, we introduced a call to action for purchasing more hours, leading to a 4% increase in the conversion rate for paid students.
- We found lower rates in certain language versions of the Preply app by analyzing conversion rates. We conducted an audit, resolving language-quality issues that affected user experience. This led to a significant improvement in the conversion rates for subscriptions in those specific languages.
This success story was the result of effective cross-team collaboration. It involved the data team and the methodology team, who provided invaluable assistance in developing the optimal learning journey. The Learning and Development (L&D) team played a pivotal role in managing the operational aspects of the training, including company-wide communication, enrollment, reminders, and logistics. The support and endorsement of the product leadership were also instrumental in promoting the training and setting a positive example for all participants.
The delivery of this project is a real Preply success story, especially regarding the collaboration between all the different actors involved. From the project setup, where problems and solutions were identified, to creating clear and trackable goals we held ourselves accountable for, and finally, to the execution, I can’t help but feel proud of our achievements in the last quarter.
Simon Mizzi, Senior Director of Product
Additional initiatives and next steps
The first phase of our project was just the beginning. We remained dedicated to improving Amplitude usage and went on to develop some more initiatives:
- Certification: As a natural progression from completing the training program, we implemented a final quiz consisting of 10 questions. Employees who achieved a pass rate of at least 80% received a certificate for completing the program.
- Chart templates: Through a detailed analysis of tool usage, we observed that new users were more inclined to replicate or modify existing charts rather than create them from scratch. To address this, we developed templates tailored to each team’s specific requirements.
- Open sessions: Our analysis of the usage data revealed interest from teams beyond the product team. In response, we organized three “open sessions” that were accessible to all employees within the company and covered general use cases applicable to most teams. Over 100 employees participated in these sessions. As a result, we have identified potential chapters to expand our efforts into, namely customer support and marketing.

Our key learnings
The key learnings from our project are:
- Define your target audience: Understand who your audience is and their specific pain points. Tailor your learning plan to address their needs and challenges effectively.
- Measure success: Determine the metrics and data points that will help you measure the success of your training program. Focus on key indicators that align with your objectives and desired outcomes.
- Continuous learning: Recognize that learning is an ongoing process. Provide opportunities for your team to revisit and reinforce their knowledge. Offer resources and support for continuous learning and skill development.
- Incorporate practical exercises: Ensure your training program includes practical exercises and hands-on activities. This allows participants to apply their learning in real-world scenarios and build confidence in using the tools or skills taught.
- Flexibility in planning: Be prepared to adapt and adjust your training program based on feedback and evolving needs. Collect participant feedback and make the necessary changes to improve the effectiveness and relevance of your program.
Remember, these learnings can be applied to any training or learning initiative at your company, helping you to create a successful and impactful program.
How do you foster a data-driven mindset at your company?

Olha Mateva
Product Data Science Lead, Preply
Olha is a Senior Product Data Scientist at Preply, a seasoned professional with over 5 years of data expertise gained from various tech companies. Olha is dedicated to improving products through data-driven decisions. She firmly believes that understanding customers’ needs through data is the key to building exceptional products and is instrumental in cultivating a culture of data-driven excellence within the organization.
More from Olha


