Digital Analytics “Aha“ Moments
Is your digital analytics team producing and quantifying "aha" moments?
“Aha” moments are one of my favorite things in life. Every once in a while, you learn something new, look at something from a different angle, or something just clicks. At that moment, your brain registers a new learning or what some call an “aha” moment.
Product teams often discuss getting new users to their “aha” moment. “Aha” moments represent the point at which users realize why they need or love the product. When Uber first came on the scene, I was skeptical about getting into a stranger’s car. But one day, I desperately needed a taxi and couldn’t find one, so I tried Uber. Within minutes, a car came directly to me, took me to where I needed to go, and I didn’t have to worry about paying with cash or credit card, but instead simply exited the car. That was my Uber “aha” moment, and I haven’t used many taxis or rental vehicles since.
One of the reasons I got into and have stayed in the digital analytics industry for so long is that I love “aha” moments. One of my first “aha” moments came when I worked at the CME. Shortly after using our digital analytics product, I tracked what users searched for on the website. I learned that ten search phrases accounted for seventy-five percent of all searches. I then used this new insight to put “Recommended Links” (which my team jokingly later called “Greco-mended Links” due to my last name) alongside the search box. Within a week, the number of searches on our website decreased by about seventy percent. Using an “aha” moment, I had turned insight into a better user experience.
Unfortunately, one of the challenges in digital analytics is that you must do a lot of work before you can get to “aha” moments. First, you must identify the questions you want to answer and the data you need to collect. Next, you have to implement to get data into the digital analytics product. After that, you need to validate that the data is accurate. Then you need to train users on how to create charts/reports. Then you have to have people who understand the data, the website/app, and the business so they can correctly interpret and analyze the data. All preceding items have to go smoothly before you even have the opportunity to find “aha” moments.
Many vendors in the digital analytics industry say that their products help organizations create better experiences or more data-driven decisions. At Amplitude, our mission is to help organizations build better products [through data]. But I would argue that the actual value of digital analytics products is their ability to generate “aha” moments. Creating better digital experiences and building better products is a by-product of marketing, product, and data teams having “aha” moments. Therefore, organizations should savor occasions when they have these “aha” moments and consider how easy or difficult it is to generate “aha” moments when evaluating digital analytics products.
Does Your Team Document/Quantify “Aha” Moments?
One of the most frustrating parts of digital analytics is the failure of teams to document or quantify “aha” moments. I have seen different people from different teams leverage digital analytics products to learn amazing things. The other day, I was on a call with an Amplitude client where we walked through some reports and had five “aha” moments. In a span of just a few minutes, we learned that forty-six percent of the time customers view at least one item, they add at least one item to the shopping cart. Next, we dug deeper to identify how this conversion rate changed by product category. There we learned that Men’s Shirts was the highest converting category and Women’s Jewelry was the lowest.
Unfortunately, while it was great to generate these rapid-fire “aha” moments, I was struck by the fact that only a few people were learning them. In this case, only those in the meeting learned about these insights. Perhaps at a later date, an Amplitude notebook would be created in which these “aha” moments would be memorialized, but people get busy and move on to other things. It got me thinking about how many “aha” moments are lost within an organization each day. How many opportunities are missed because the right people didn’t know the right insights at the right time? Most organizations I have worked with are terrible at documenting or quantifying “aha” moments and the insights to which they can lead. Insights lead product teams to try new things and learn from experiments. “Aha” moments are often worth their weight in gold, but I don’t believe that organizations or digital analytics vendors treat them with the respect they deserve.
One approach digital analytics teams can take is to manually document their “aha” moments. Teams can find a place to catalog key things they have learned from the data and share these learnings with the organization. When I worked at Salesforce, we attempted to do this. We had a large wall with a whiteboard in our area and when we learned important things, we would add it to the wall. Later we would document these learnings electronically in an internal wiki. Unfortunately, it was a lot of work and we still didn’t have a great way to share these “aha” moments with everyone at the organization.
How Digital Analytics Products Can Maximize “Aha” Moments
So how can digital analytics products maximize the generation and sharing of “aha” moments? First, digital analytics products must create an environment that maximizes “aha” moment generation. One of the ways to increase “aha” moments is through collaboration features. If data analysts spend most of their time working alone, they are likely to be the only ones having “aha” moments. Digital analytics is often an individual sport instead of a team sport. Most digital analytics products have limited collaboration capabilities. You can create reports, add them to dashboards and possibly add a text box with some comments. Often, charts are added to slide presentations, presented, and then lost forever on file servers. Maybe a few people in the organization learn about the insights, but shortly after that, they are lost to the ether. If new people join the organization afterward, they are unlikely to learn from this prior work.
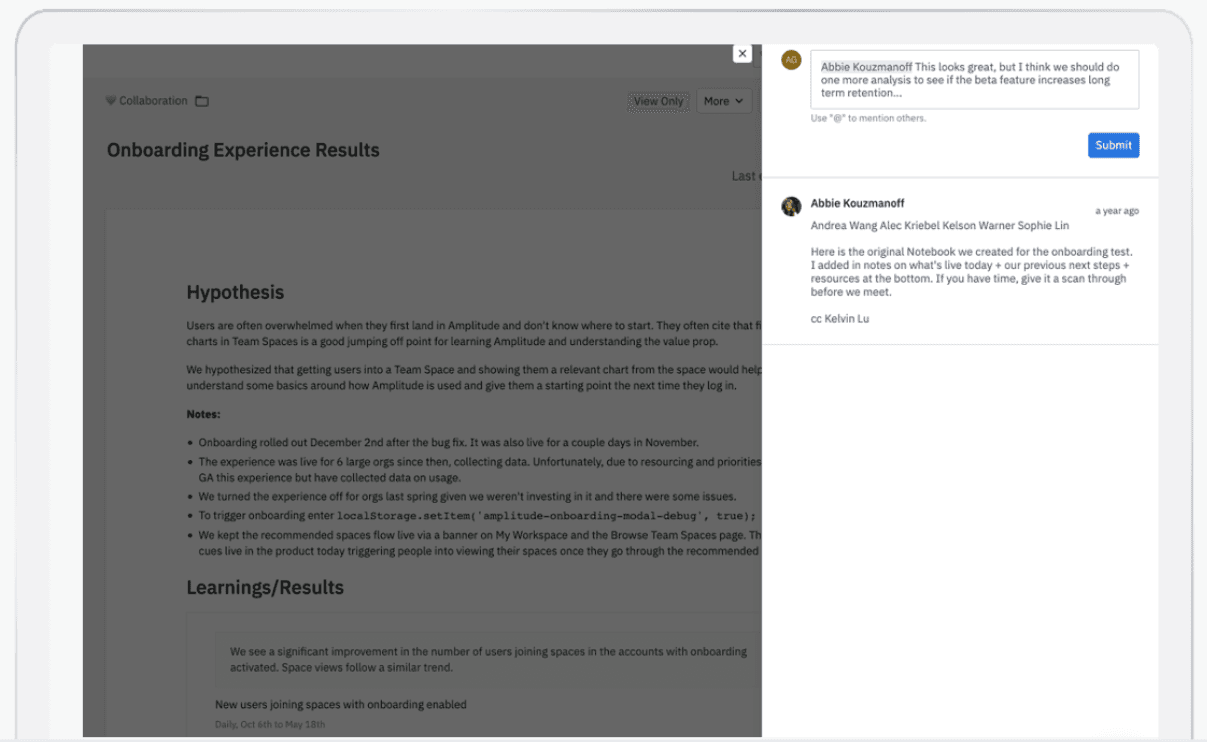
At Amplitude, we have an entire product team dedicated to collaboration. This team is always looking for ways to help our customers increase collaboration and the sharing of insights. One of the ways Amplitude has attempted to improve insight and knowledge transfer is through our Notebooks feature. Amplitude Notebooks provide a freeform way to tell stories with data and insights. Notebooks can contain text, images, videos, charts, tables, and annotations.

Amplitude Notebooks also have full discussion thread capabilities, which allow users to invite others to participate in a discussion around the data:

Discussion threads are a great way to have multiple people collaborate and bounce ideas off each other, especially in our new virtual working environment.
The other benefit of Notebooks and discussion threads is that they happen within the digital analytics product. Being contained within the product means that users are always one click away from diving into the data and exploring it further, which isn’t the case if they are reading a PowerPoint presentation on a shared drive. Another benefit of having insight sharing take place within the product is that future employees can search and find past analyses and learnings. All discussions and commentary live on within the product and can be read by new team members to get up to speed on what the organization has learned in the past.
A New Analytics/Data Team North Star Metric?
If you are part of an analytics or data team, what is your North Star Metric? How do you quantify the value that your team brings to the organization? Is your team viewed as a cost center or a profit center? While all analytics and data teams want to quantify the exact value they provide to the organization, it can often be difficult. As mentioned above, documenting how data has benefited the organization can be difficult and time-consuming.
A good first step is quantifying the number of “aha” moments the team and end users produce. While it isn’t a perfect North Star Metric, I think that a team that produces one hundred digital analytics “aha” moments in a month is probably doing better than one that produces ten. To do this, your organization must start by defining an “aha” moment. The maturity level of the organization may dictate what merits classification as an “aha” moment and these may be different at each organization.
Once a list of “aha” moments is generated, it may be possible to go back at the end of each quarter to see what actions were taken on these “aha” moments. After all, the identification of “aha” moments is meaningless unless your organization turns them into actions. These actions might be changes to your digital properties, the addition/removal of content, changes to product features, or adjustments to marketing campaigns. By tying actions to “aha” moments, you can ensure that the organization is capitalizing on these “aha” moments.
After “aha” moments have been associated with actions, it may be possible to assign incremental revenue or cost savings to the actions taken. Here are a few hypothetical examples:
- An “aha” moment was the realization that a specific marketing campaign was not generating new leads. The action was to shift spending from the underperforming campaign to a better-performing one. This resulted in a better overall Cost per Lead (CPL), which generated more revenue per dollar spent.
- An organization has to decide which product features merit increased and decreased investment. An “aha” moment found that feature A was leading to high customer engagement and retention, while feature B was not. This insight helped the product team determine where to put its time and money and led to increased downstream customer engagement and retention, which in turn led to increased revenues.
“Aha” moments can be a good proxy for how effective the analytics/data team is within the organization. Even if you don’t take the time to connect each “aha” moment to actions and revenue/cost savings, knowing how much your organization is learning through its use of data is essential. This information can help justify the investment your organization has made into data and the analytics team. Quantifying “aha” moments can also help justify new analytics team headcount and continued investments in analytics products.
Does your organization capture and share its “aha” moments? How well does your digital analytics product help you to generate and document “aha” moments? Are you documenting your “aha” moments and associating them with actions and revenue or cost savings?

Adam Greco
Former Product Evangelist, Amplitude
Adam Greco is one of the leading voices in the digital analytics industry. Over the past 20 years, Adam has advised hundreds of organizations on analytics best practices and has authored over 300 blogs and one book related to analytics. Adam is a frequent speaker at analytics conferences and has served on the board of the Digital Analytics Association.
More from Adam


