Introducing the Future of Digital Analytics
Does data have to be difficult to use? A different vision for the future.
“The advance of technology is based on making it fit in so that you don’t really even notice it, so it’s part of everyday life.”
Bill Gates
We’re in 2024, 12 years after the Big Data Revolution. Everyone wants to use data to build great products. When I ask leaders I meet how far along they are in setting up data analytics, their response is invariably something like 5–10%. I have never met someone who has said more than 50%. And this is often after years of investment, dozens of people in the data and analytics organization, and millions—sometimes tens of millions—in spend on cloud data warehouses.
Whether you’re building a custom data stack or using an off-the-shelf analytics tool, every single step of setting up analytics is hard. You need to map out the datasets you want to use. You need dedicated engineering resources to help set up the data pipelines and instrument the events you’re tracking. After that, it’s still hard to use because you need to understand how to do an analysis. Even with the data, most people are at a loss about what it means and what they should do next. Once you get an insight, you’re often questioning the integrity of the data. You also want to somehow connect these insights to take action, which means pulling in more engineering help to connect the data to other systems.
At this point, people have taken for granted that setting up analytics sucks. We’ve grown to accept terrible experiences. This gem regularly gets reposted to Hacker News: Whom the Gods Would Destroy, They First Give Real-time Analytics. It’s easier to ship new products than it is to measure them. How are we accepting this crappy experience as the standard? That is nuts!
Analytics should not be this hard. There have been huge breakthroughs in great user experiences in SaaS. Dropbox kicked it off in 2007 with filesharing. DataDog in 2010 with observability in an operational and configuration-heavy space. Figma with collaborative design in 2015, when a lot of designers said they would never use browser-based applications! Slack followed suit in team chat and Canva in graphic design. Even in the data space, I remember being blown away by what Tableau had created—a lot of what they did inspired the initial interaction design for Amplitude. These companies have all proven that business-heavy workflows with lots of data and collaboration can be simple. Technology shouldn’t leave you frustrated. We can do better in analytics.
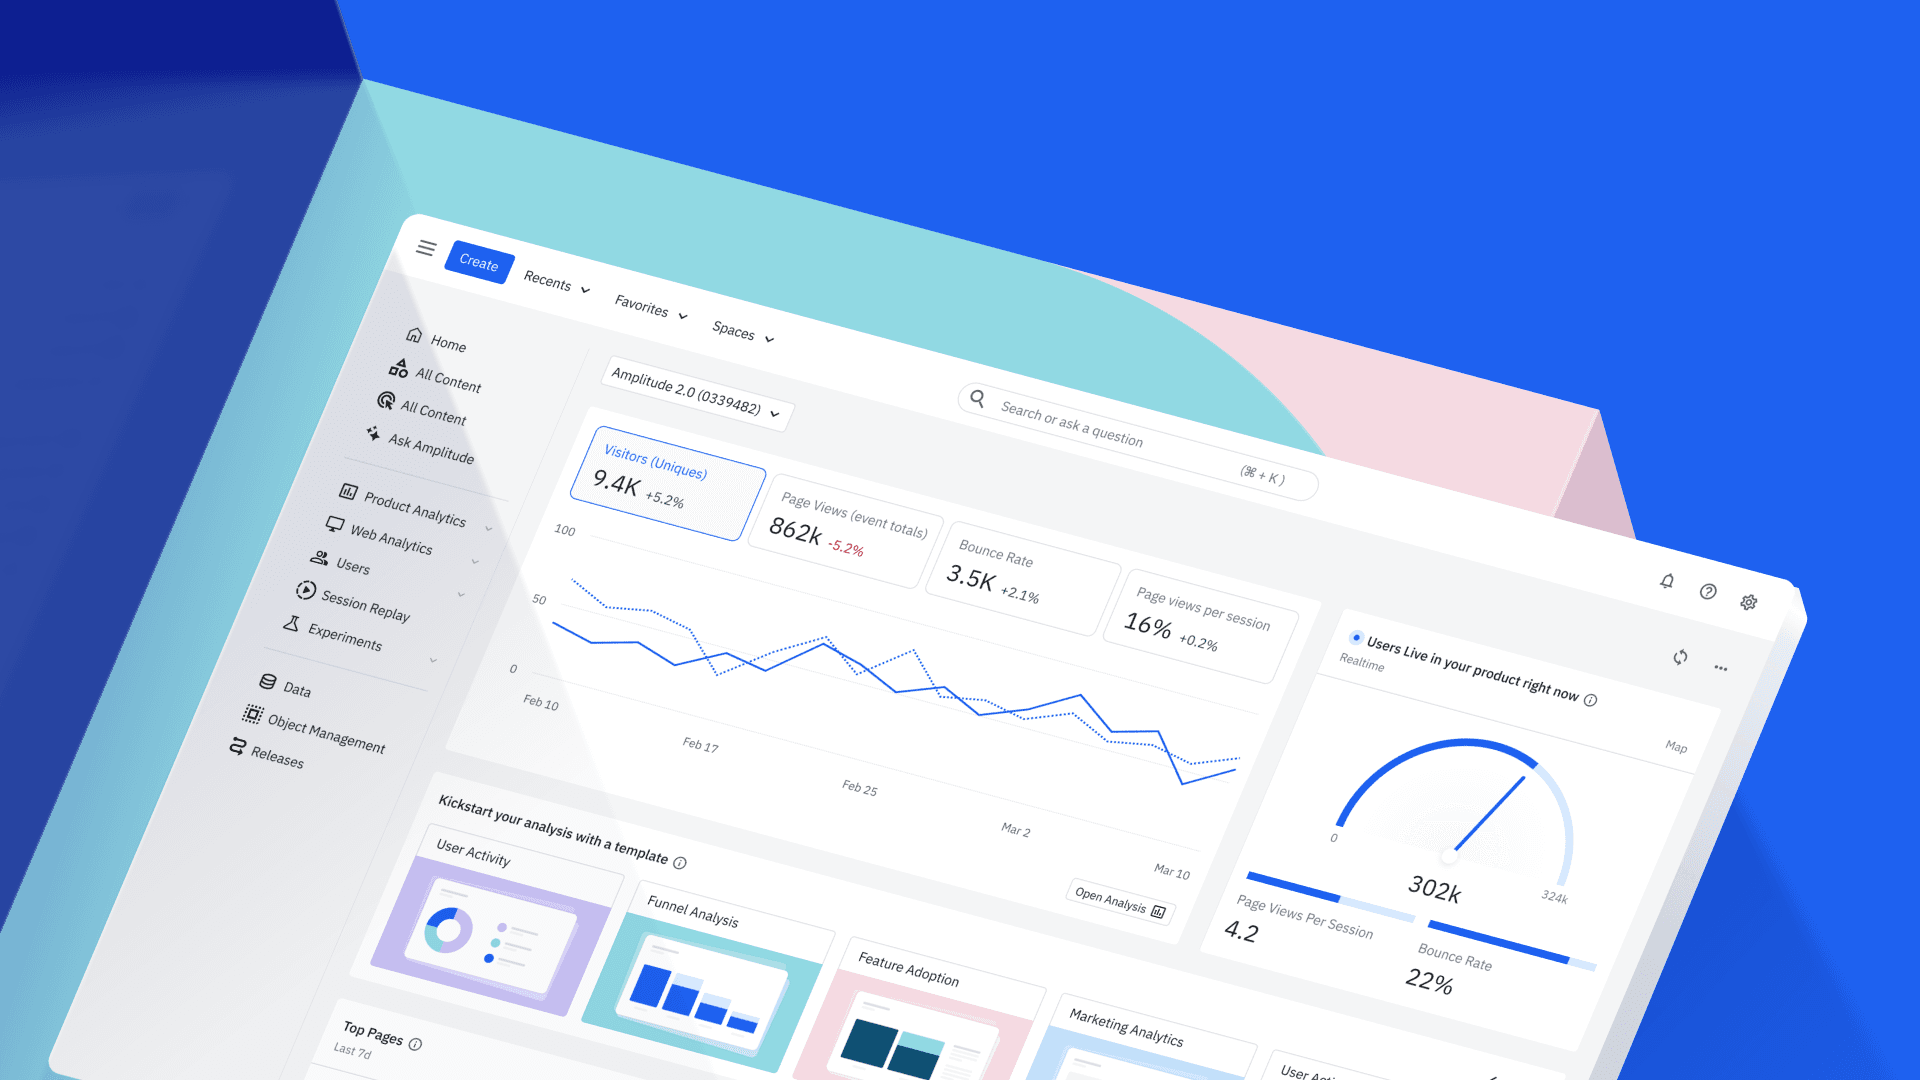
Today, we're announcing a new vision for analytics: Amplitude Made Easy. Amplitude Made Easy is a reimagined experience with new features that radically simplify digital analytics, making it easy to get started, gather insights, and scale your analytics implementation.
What do we mean when we say we are making Amplitude easy? Let’s take a look:
Instrument quickly with one line of code
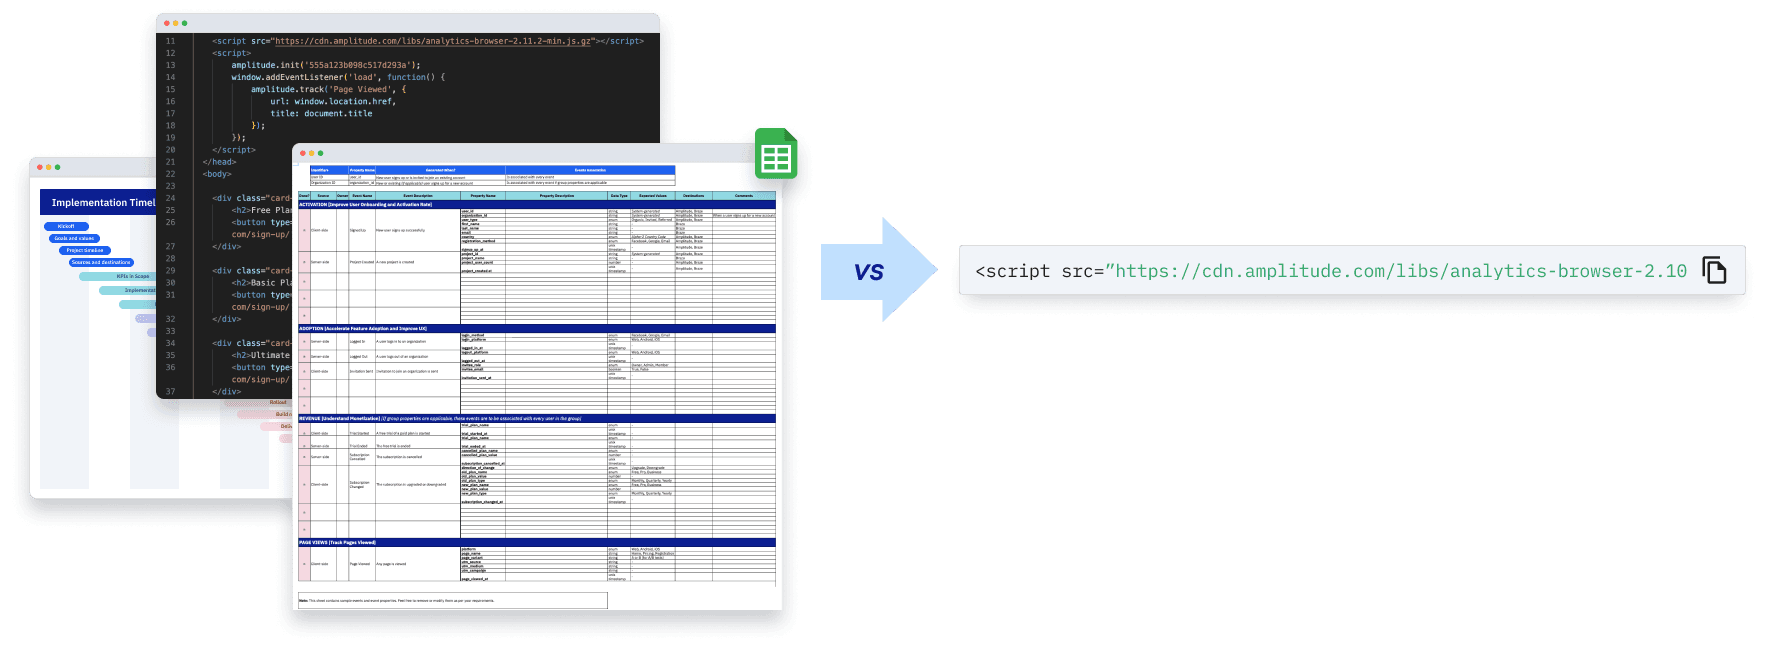
The default with analytics is starting off with a blank slate. Before you can even implement, you’re supposed to build a tracking plan. That gets handed off to an engineer. For each event, the engineer needs to write specific code based on the properties you’re trying to track. If you want to track more sophisticated events, it requires even more engineering and even more lines of code. So expect to see weeks turn into months before you can collect any insights.
We think there’s a better way to get started with an analytics implementation. We’re introducing a single line of code that enables Autocapture, Session Replay, Experimentation, and CDP (customer data platform). Now, anyone can start collecting quantitative and qualitative data and take action on that data within minutes. With a single line of code, teams can automatically populate baseline metrics and dashboards and use visual labeling—a new tool that enables customers to label specific types of interactions for further analysis.
Autocapture, which captures page views, sessions, and user interactions, is powered by our software development kit (SDK), and is a great way for new teams to onboard onto the Amplitude platform. It powers our new plugin experiences with WordPress and Shopify, and integrates with our best-in-class precision tracking to make the on-ramp for Amplitude faster than ever. By bringing these two data collection strategies together, we are providing you with the best of both worlds—and empowering you to take advantage of the benefits of both.
Onboard with pre-built web and product dashboards
Now that you’ve finally instrumented your analytics and your events are rolling in, it’s time to start making sense of them. As a first-time product manager or marketer using a new analytics tool, you likely want to start tracking the metrics that are most important to you. To do this, you’ll need to figure out where to begin—what questions to ask, what charts to build, and how to run the analyses.
You’re probably asking yourself what a funnel is, how to set up a chart, and why you even need to learn all of this stuff—because all you really want are some quick answers about what your customers are doing.
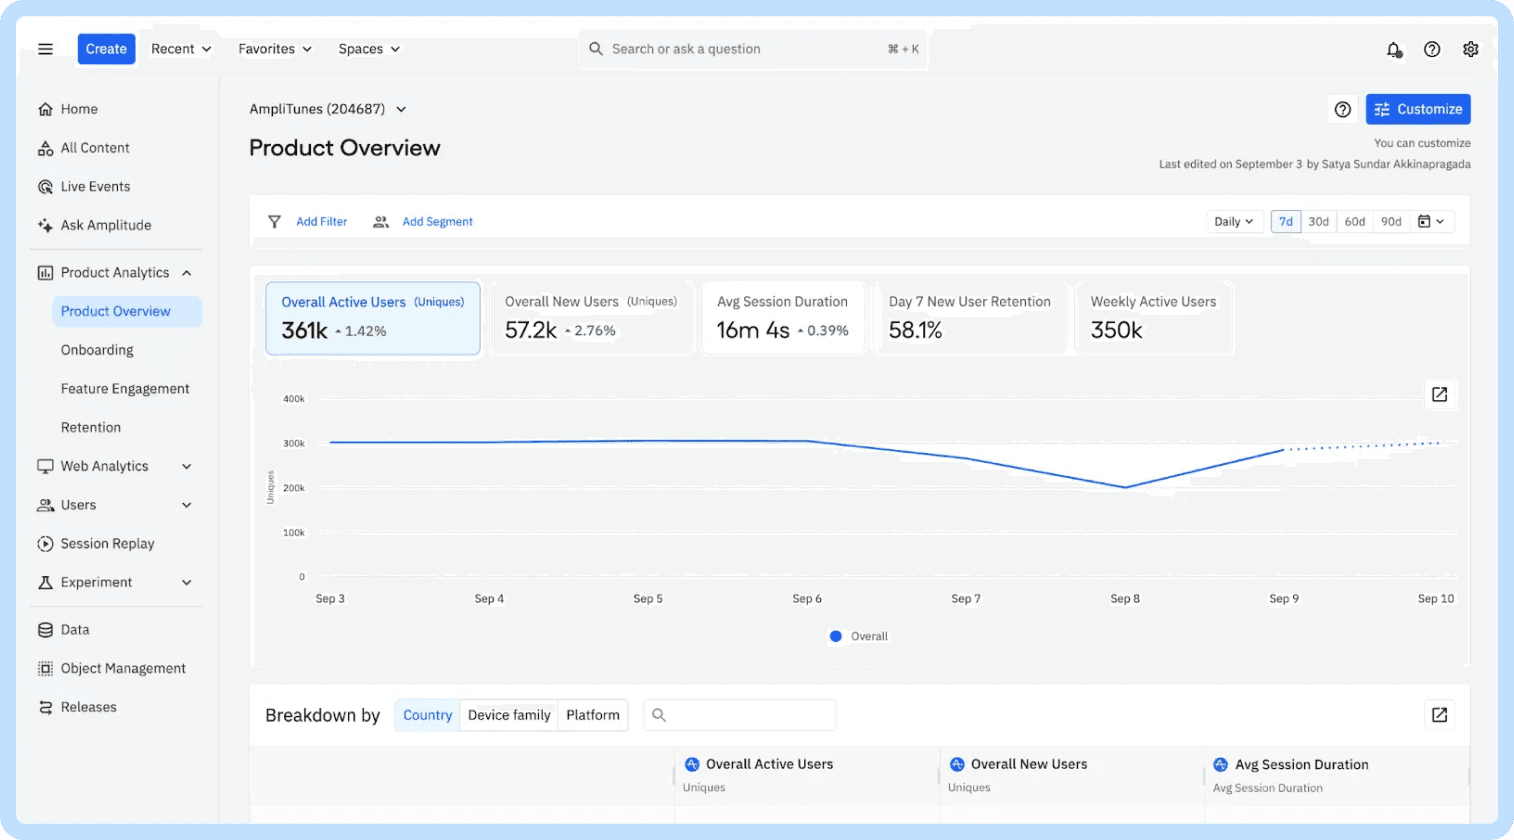
This is why we are introducing new pre-built web and product analytics along with best-in-class templates that make it easy for non-technical teams to access the insights they need the most.
With out-of-the-box web and product analytics, you don’t need to set up or build any chart to get all of the data you need in one place. We’ve taken the most common charts by use case and industry and brought them all together for you. Now you can get the answers you need without having to do any chart building or analysis.
If you’re in marketing, this means you can instantly get insights about what your customers are doing across channels, campaigns, and conversions right from your Analytics homepage—the minute you log in. And if you’re a product owner, you can easily understand what features are most successful and what is driving retention.
We’ve also curated some of the best learnings available across industries and use cases and incorporated them into ready-to-use templates from industry experts like Elena Verna and John Cutler—so you can easily access and use them to uplevel your analyses and move your business forward. The best part? You can take advantage of these templates without creating a single chart on your end.
Answer your questions with generative AI
A big challenge faced by new users is understanding how to use data to get the answers they need. New teams often struggle to understand their taxonomy, what events to use, how to ask the right questions of their data, and how to apply best practices to their learnings.
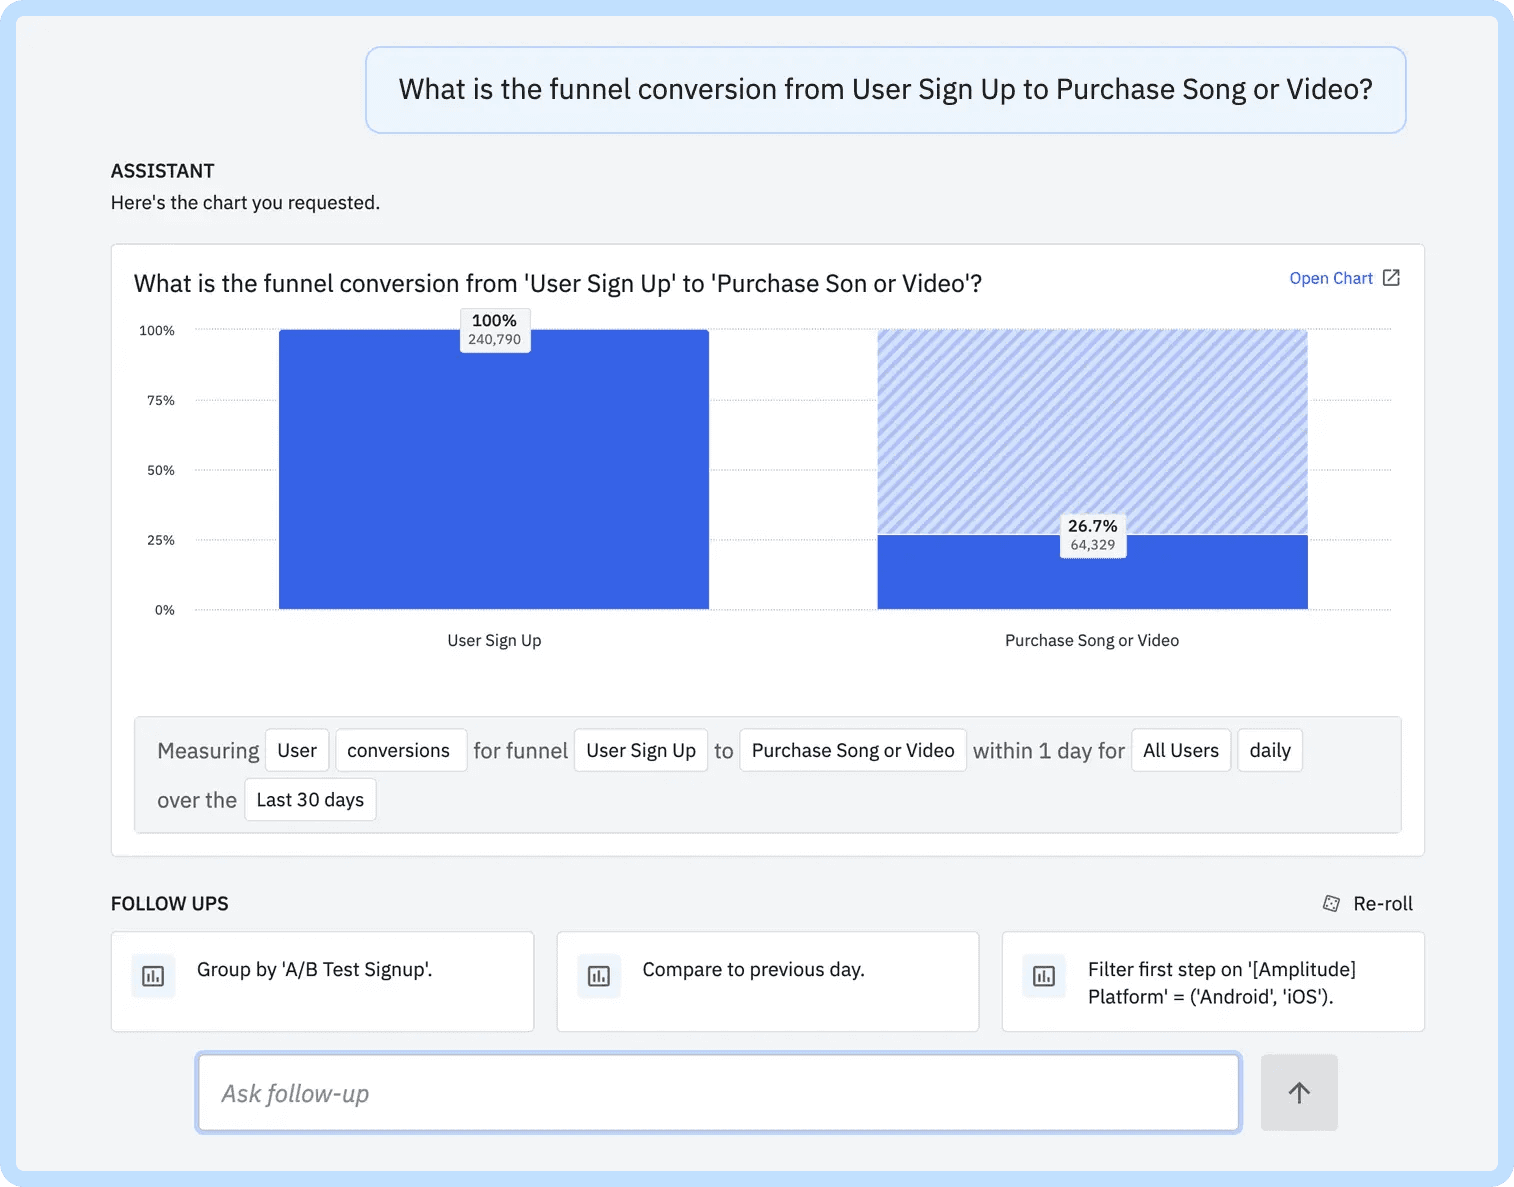
With Ask Amplitude, we’re changing that. Ask Amplitude is a conversational chat interface powered by generative AI and integrated into the Amplitude platform. Now, teams can simply ask their questions in plain English. Ask Amplitude not only provides the answers you need, but also helps you visualize these responses and makes recommendations about what to ask next. This eliminates the burden of getting started.
Ask Amplitude uses existing content and definitions to derive context, so teams can get accurate and relevant answers. Users can build on past questions by taking advantage of back-and-forth conversation as well as suggestions to get to next steps.
See what your users experience with user profiles
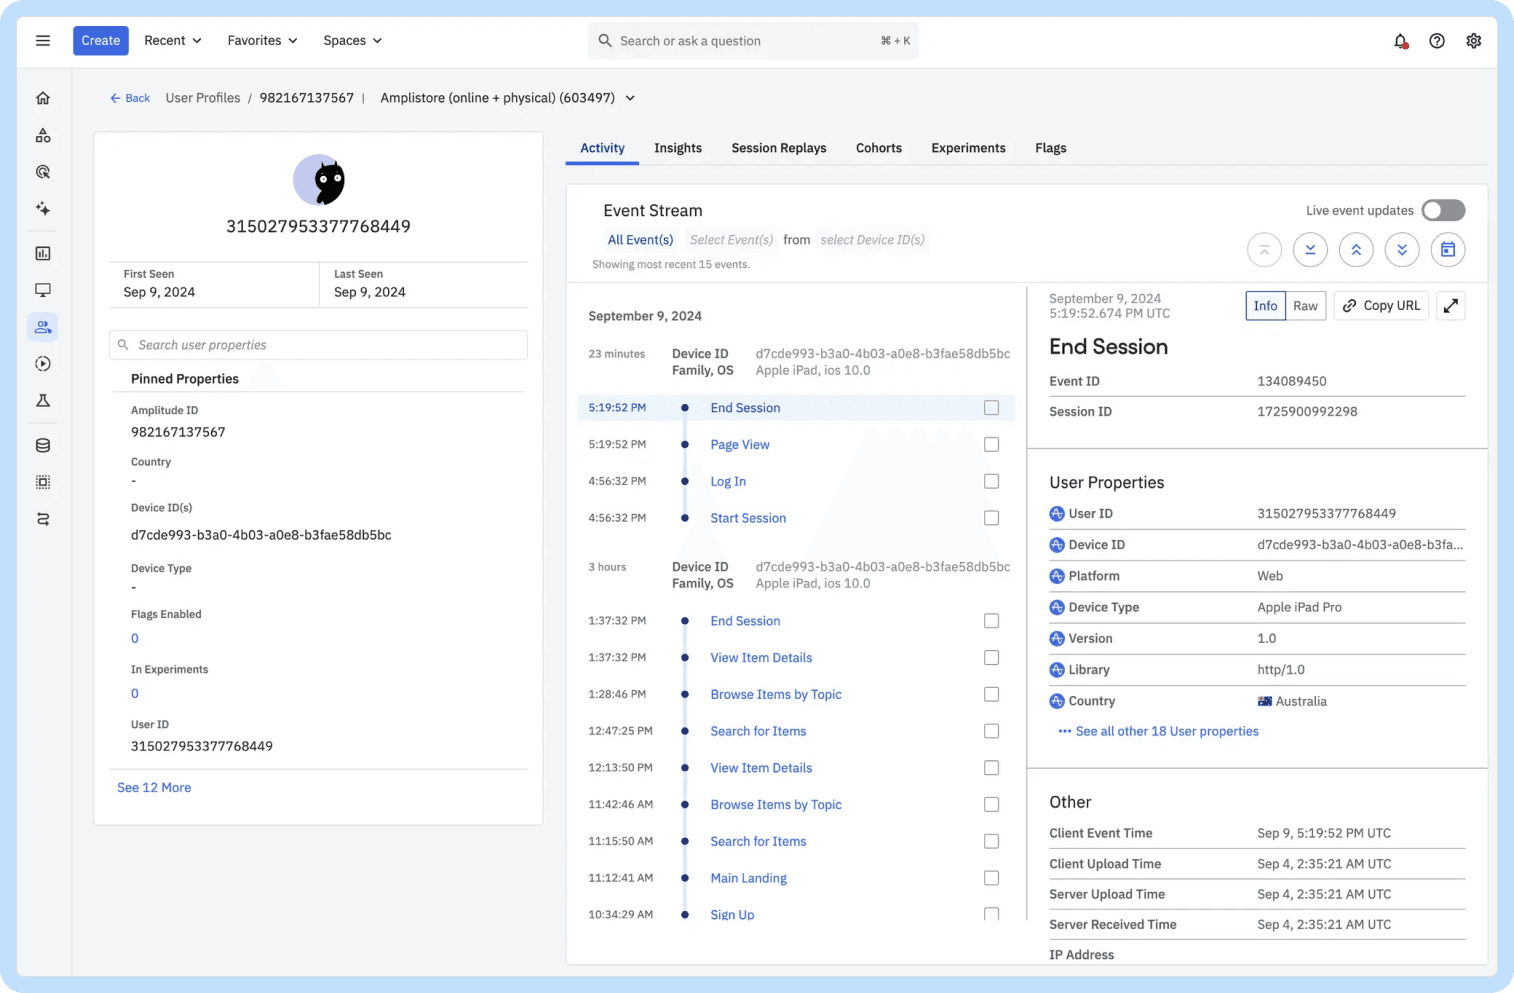
One of the hardest things to do in analytics tools is get a clear picture of the user journey—how users are moving across digital channels, what friction points they are running into as they onboard, and how they are progressing in their journey and becoming more valuable over time. These data sources have traditionally lived outside of analytics tools, requiring most organizations to stitch them together with custom tooling or, worse, by logging into different tools to connect the dots. With our 360-degree user profiles, we are out to help you automatically connect all of these dots.
Our user profile enables you to connect different aspects of your customer journey in a single intuitive view. Want to learn more about a user group that didn’t take key actions in the product? You can now quickly create a cohort, drill into specific users and their paths, see specific replays of interaction leading up to the moment, and understand which A/B test variant they were exposed to or which flags they have turned on for their user ID. With user profiles, we’re making it easier than ever to diagnose issues quickly, uncover deep user insights, and take action on users with more effective targeting and engagement across destinations.
Unlock more value from your analytics for less
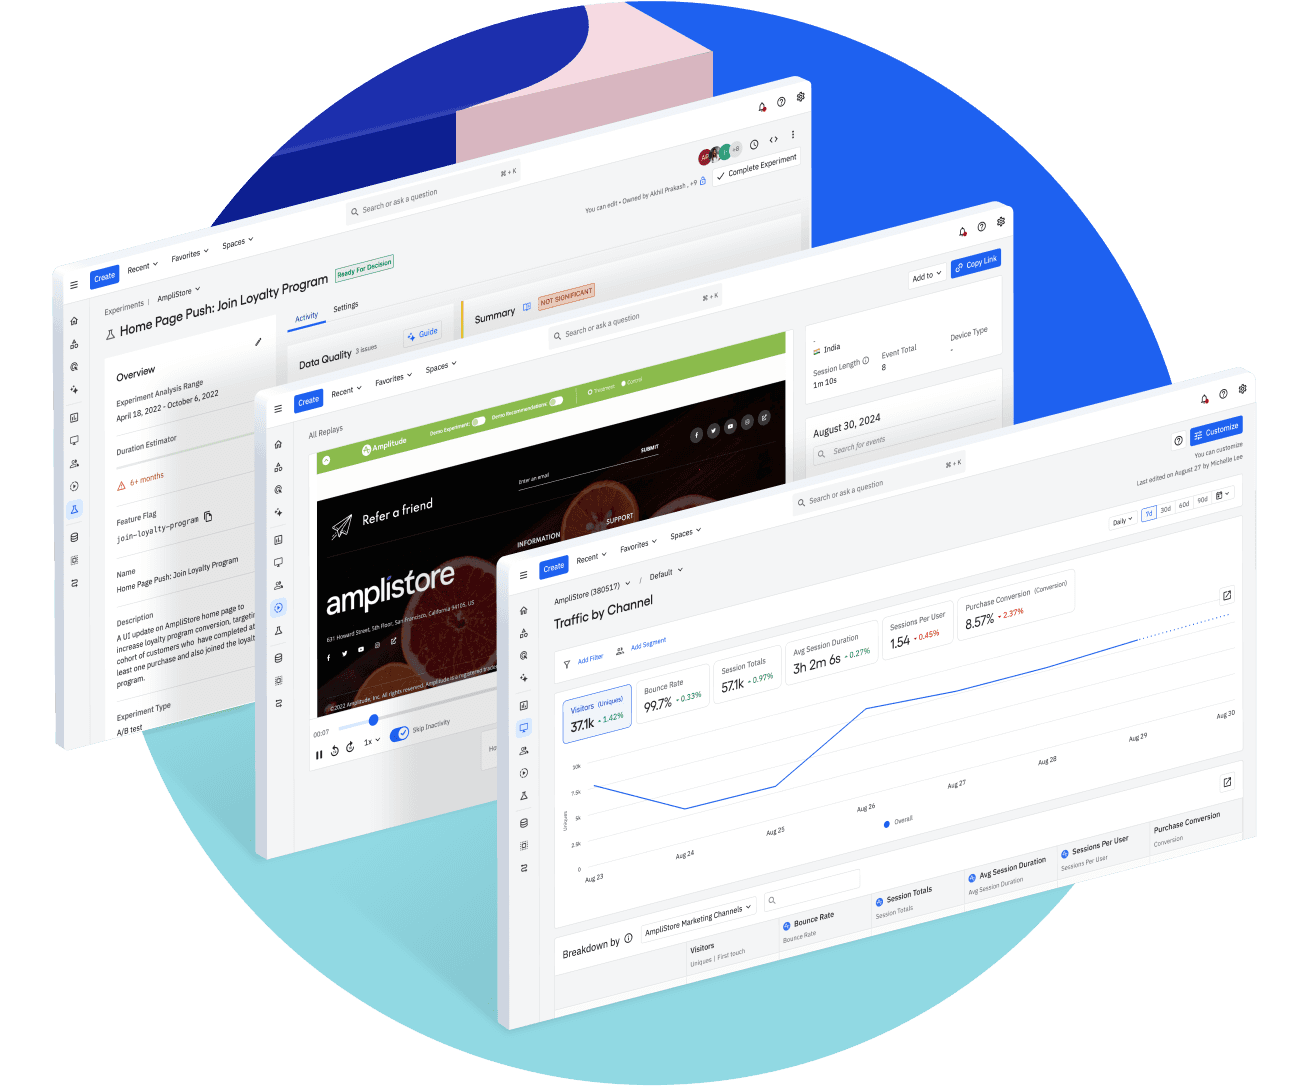
So far, we’ve talked about how hard it has been to get started and use digital analytics. But let’s not forget about all the work you need to do to apply these learnings and insights across all the other tools in your environment so you can take action and drive outcomes.
We constantly see people with bespoke integrations do the hard work to maintain these solutions in an attempt to send data out of Amplitude to other systems. For example, most analytics tools are connected to a CDP or an experimentation system. Product managers and marketers will want to use their insights to reach a specific audience, run a campaign, or personalize an experience, and then test it out to see how groups of users will react or de-risk the rollout with a feature flag.
Expect to fork out a lot of money if you are hoping to bolt all of these solutions together. Plus, you’ll need to install multiple SDKs that will likely impact your overall performance. You’ll also have to make sure that everything is working the way it’s supposed to—including your data pipelines. This means more engineers, more money spent, and more maintenance to keep your systems running.
With Amplitude, we’re removing this burden by giving you a single platform complete with Analytics, CDP, Session Replay, feature flags, and Experimentation. What does this unlock when natively connected to your analytics?
- See replays of key cohorts of users as part of your onboarding funnel.
- Test and analyze what variant is impacting your onboarding metrics.
- Run a lifecycle campaign to re-engage your users.
All of this and more can be done in Amplitude without endless engineering cycles to stitch these capabilities together. You don’t need to set up or maintain multiple SDKs or worry about integrating data pipelines and tools together. We do it all for you.
50K MTUs free to get started

We’re also making it easier and more affordable for you to access everything you need to understand what your customers are doing and take action on these insights with our Starter and Plus plans. Now, you don’t have to break the bank to scale and grow your business with capabilities like Autocapture alongside Amplitude Analytics, Session Replay, CDP, feature flags, and more. Our Free plan starts at 50K monthly tracked users (MTUs) and comes feature-packed with many of the updates that we’ve shared today.
The future looks bright for digital analytics
We believe that digital analytics shouldn’t have to be so hard. It’s time for a change. And we’re out to make it easier—easier to get started, easier to use, and easier to scale your success.
So say goodbye to what was truly a hellish experience and hello to a simpler way of doing things. And know that we are just getting started.
Interested in checking out our latest release? Sign up for our upcoming launch event where we’ll dive into a product demo and host a live Q&A with our product team.
Frequently asked questions
Is Autocapture replacing precision tracking?
Customers can use Autocapture and our out-of-the-box dashboards to get a baseline of their product and web health. This is a great way to get started with Amplitude quickly. Adding a best-in-class precision tracking model and taxonomy plan on top will help you get more sophisticated about your tracking and scale your analytics implementation.
Ultimately, this approach makes Autocapture and precision tracking work effectively together to improve the on-ramp to analytics. We want to remove the pain of getting started and make it easier to get faster learnings and outcomes from your analytics instrumentation. We believe that Autocapture can empower teams that need it most and grow with them early in their analytics journey. Learn more about our approach to Autocapture.
What about customers who don’t use the SDK?
New and existing customers using the Amplitude SDK will immediately see insights generated about their web and product experience. For existing customers using different data sources to import data, such as a third-party CDP or a data warehouse, most metrics and capabilities will still be available out of the box. Additionally, you can customize some definitions to power out-of-the-box web and product analytics (see help docs). Features such as Ask Amplitude and our new user profile view are also accessible regardless of instrumentation methods. Autocapture will require our latest SDK to capture interactions and power our new visual labeling experience. Visit our help docs to learn more.
I’m already an Amplitude customer. What’s changing for me?
Amplitude Made Easy is a comprehensive update to the Amplitude platform, focused on making digital analytics more accessible, intuitive, and actionable for all users.
Existing customers have the opportunity to start using this new experience:
- Log in to your Amplitude account here.
- Opt in to the experience by clicking the gear settings button on the top right corner of your page.
- Select “Opt in to New Navigation.”
- Users can also choose to opt out if they wish by clicking into the same gear settings button on the top right corner of their page, then selecting “Opt out of New Navigation.”
All of our Starter and Plus customers will default to the new experience starting September 10 with the option to opt out. All Growth and Enterprise customers will have the option to opt in and preview the experience as we roll these updates out to our larger customers in partnership with our success teams and customer admins.
Are these updates available for all plans?
Most of the updates featured in our new Amplitude Made Easy experience are available to customers across all plans. Free customers on our Starter plan have access to one-line-of-code instrumentation, Autocapture, out-of-the-box web and product analytics, template gallery, Ask Amplitude, and our new user profile view. In some cases, customers may require add-ons to access additional product features such as Session Replay, feature flags, and Experimentation. Visit our pricing page to learn more about the features available in your plan.
How does your AI technology work?
Our new AI updates for Ask Amplitude feature a conversational interface for using Amplitude. Ask Amplitude enables teams to ask questions about their product and express Amplitude-related concepts and questions in natural language without knowing their data or taxonomy. Ask Amplitude builds and modifies charts through natural language questions and commands, maintains threaded conversations that build on business context and past questions, and provides suggestions for next steps to guide the analysis journey. Users can also use Ask Amplitude to search existing content, including pre-existing charts, and access help documentation explaining Amplitude functionalities. Learn more about Ask Amplitude and how we handle data requests with LLMs here.

Spenser Skates
CEO and Co-founder, Amplitude
Spenser is the CEO and Co-founder of Amplitude. He experienced the need for a better product analytics solution firsthand while developing Sonalight, a text-to-voice app. Out of that need, Spenser created Amplitude so that everyone can learn from user behavior to build better products.
More from Spenser
