

We’ve released so many new features and improvements since our and could not wait until next month to announce them! In this product update, you will find improvements on:
- New Features
- Usage interval in Retention Analysis
- Global date ranges in dashboards
- Headline numbers in dashboards
- Set contains & glob/wildcard operators
- Feature Improvements
- Microscope View User Streams
- User Composition
- User Activity
- Browse Charts
- UX Improvements
- Redesigned datepicker
- Chart descriptions
.
1. New Features
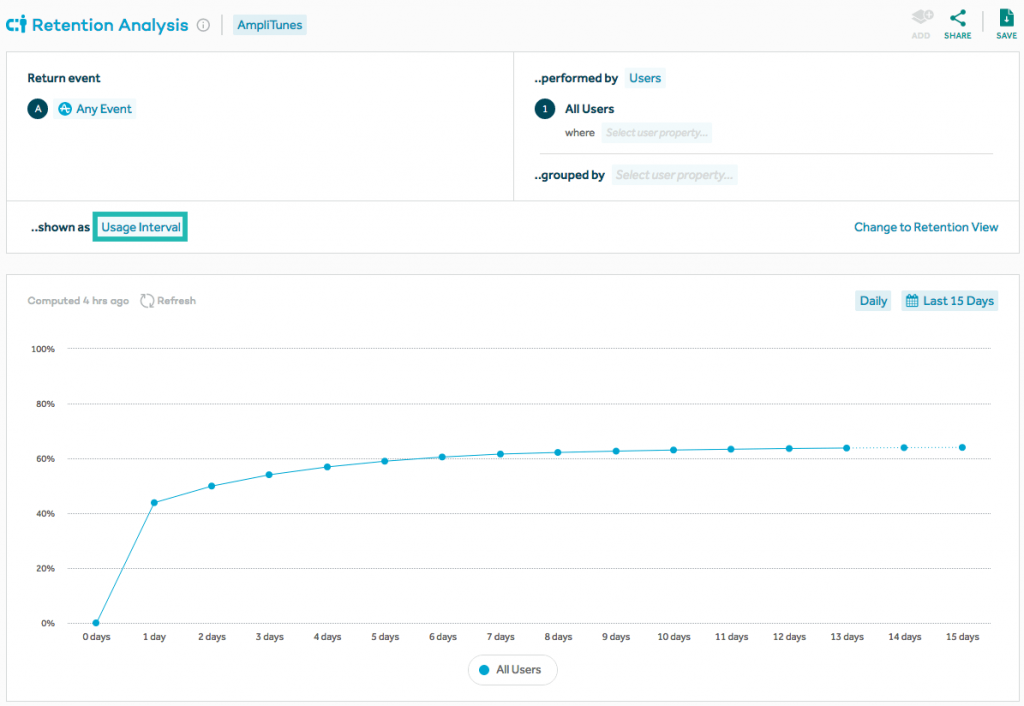
Retention Analysis: Usage Interval and Change Over Time
(Enterprise Only) Usage interval shows you how long it takes your users to come back to your product and complete a critical event. Discovering your product’s usage interval is important so you can accurately draw conclusions about your retention numbers. Knowing how often your product is used will help you gauge the health of your product when looking at Retention and Lifecycle charts. Read more about this exciting new feature .
Dashboards: Global Date Ranges
(Enterprise Only) You can now apply a date range on a dashboard and all charts will be updated to reflect that date range. The individual charts themselves will not save with the new date range, but this is a useful feature that will allow you to see a global date range across all charts on a dashboard.
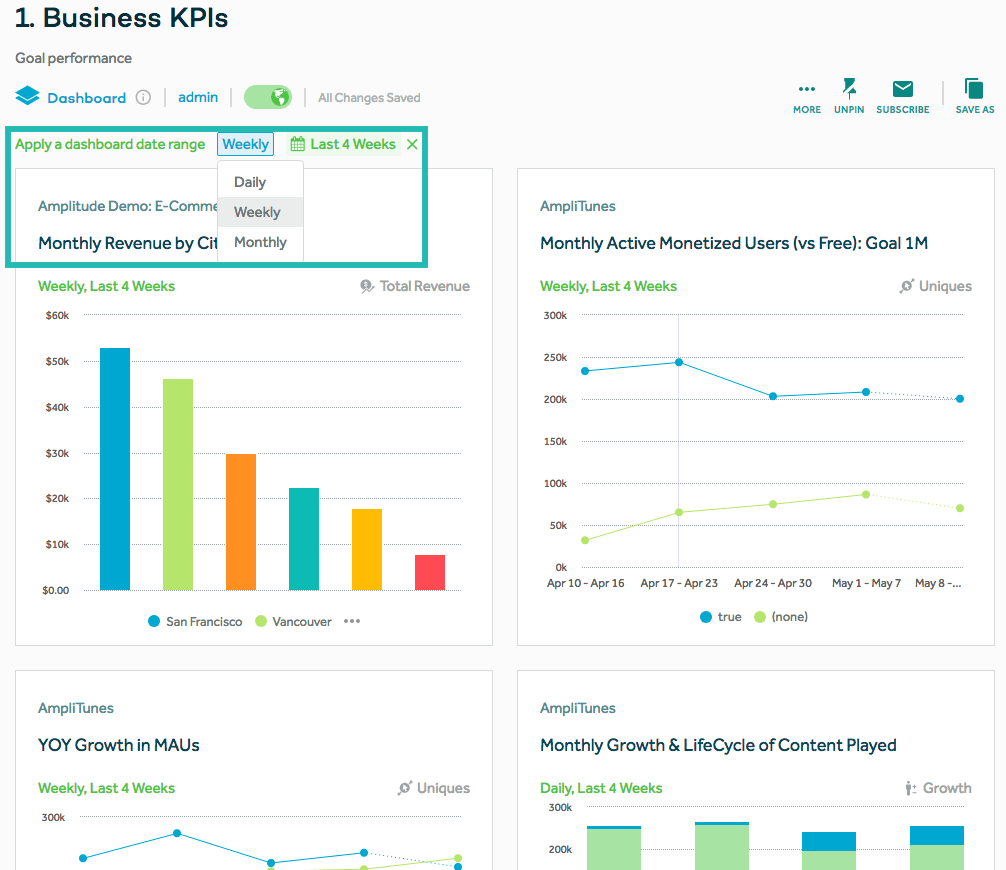
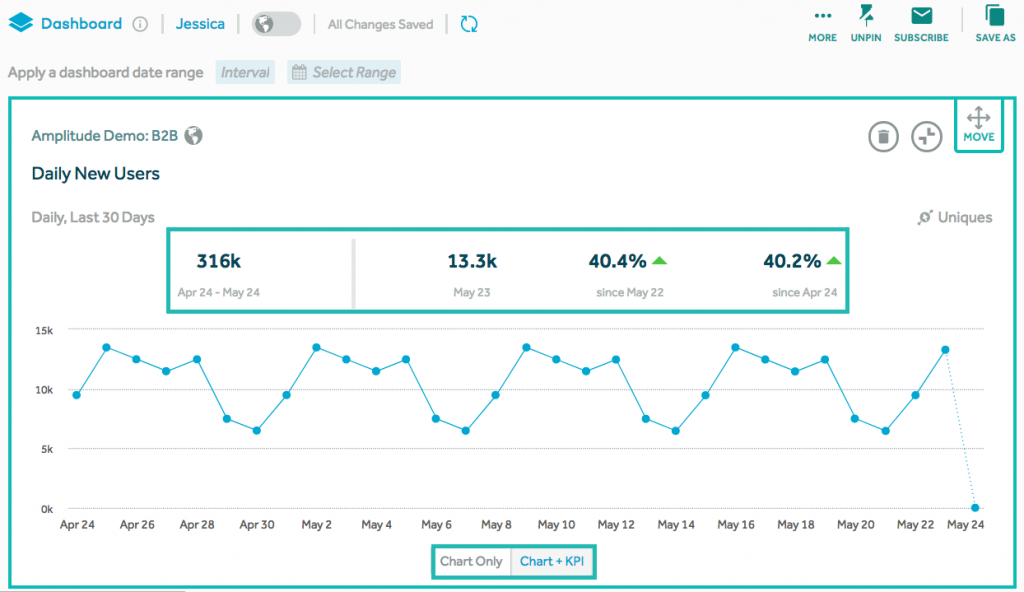
Dashboards: Headline Numbers
Dashboard owners can now toggle single series-over-time Event Segmentation charts to display summary numbers such as the current period sum, the previous interval sum, and the percentage of change. This allows you to see at a glance metrics for your charts on a dashboard.
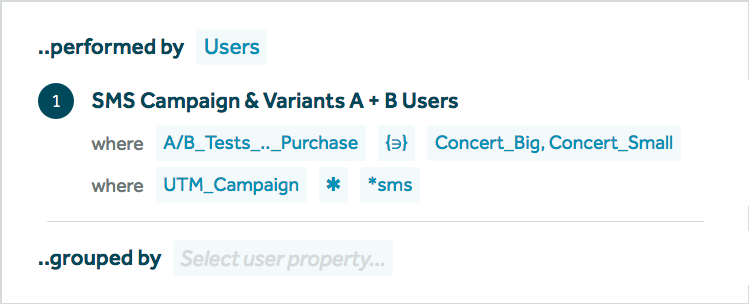
Set Contains/Set Does Not Contain and Glob Match Operators
The new set contains ({∋}) and set does not contain ({∌}) operators match list values that contain all of the selected values and list values that do not contain all of the selected values. This is useful for example, to find users who belong to multiple A/B test groups. The new glob match () operator allows you to match strings like “/org//chart/” where * is a wildcard. You can also enter things like “[0-9]” or “[!a-z]*” to match values that end in a digit or start with a non-letter. Find more information about these new operators .
2) Feature Improvements
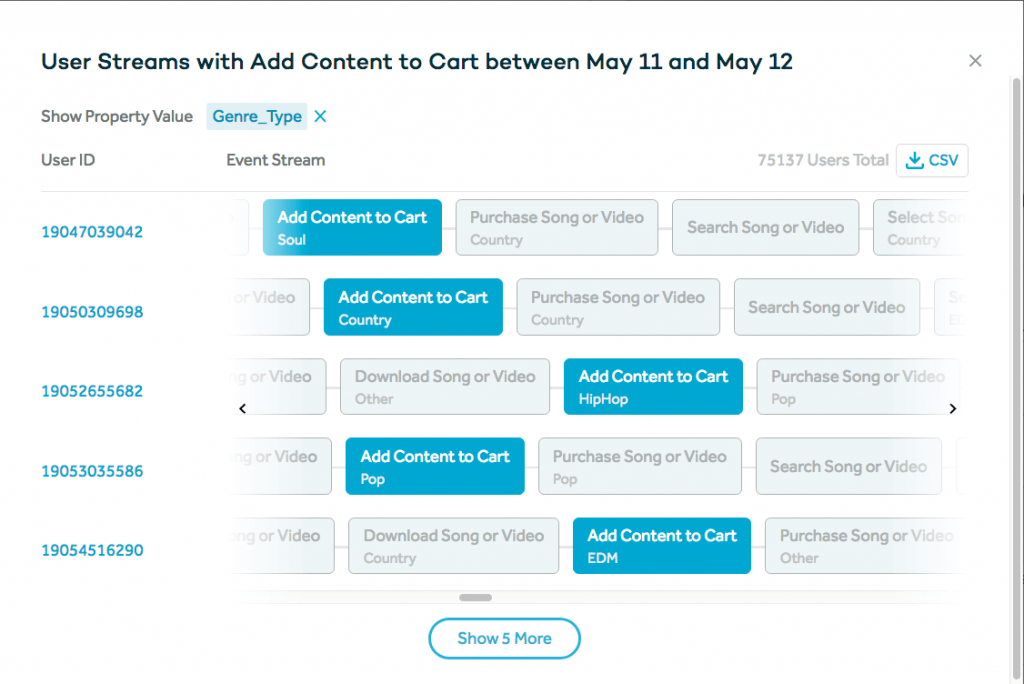
Microscope: View User Streams
(Enterprise Only) To create View User Streams, we took the beloved Show Streams feature from Amplitude 1.0 and combined it with View Users in Microscope. Now, you are able to click an individual user while viewing that user’s exact stream of events which can be useful for debugging. You can also show property values within the stream. Currently, this feature is only supported in .
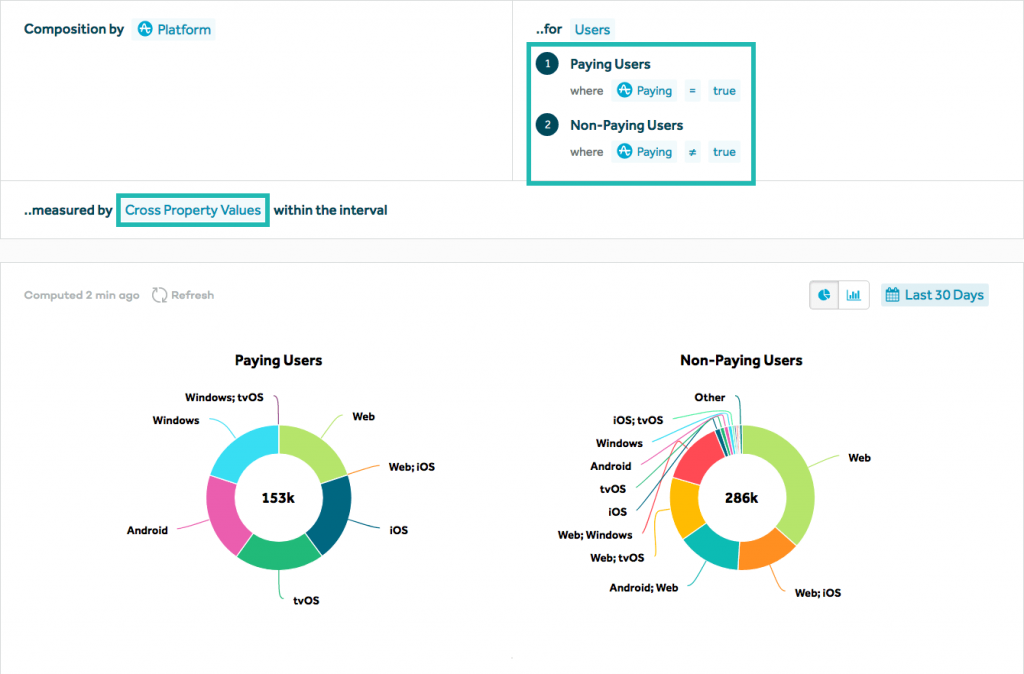
User Composition: Cross Property Values & Two Segments
The cross property metric allows you to see sets of properties users have had within the time range selected. One example this can be used for is to see how users are using your product across different platforms. Additionally, it is now possible to compare up to 2 different segments, so 2 pie charts can be compared side-by-side. Learn more about our improved User Composition chart .
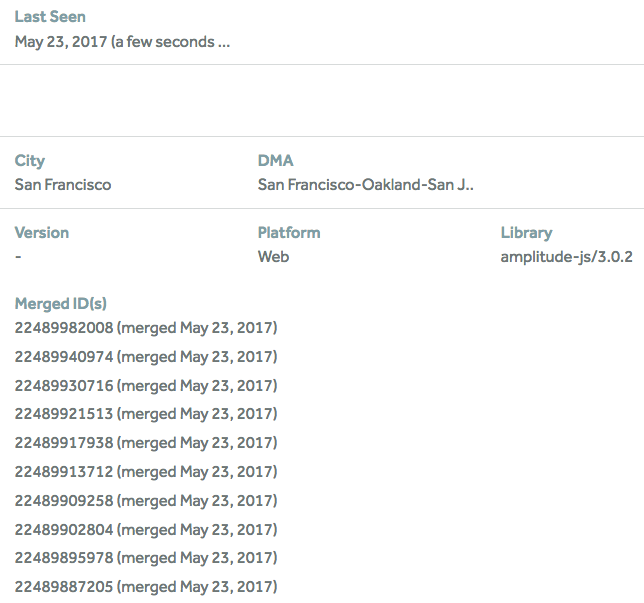
User Activity: Amplitude ID Merge Times
In an individual user’s page, the dates when the merges occurred are now listed next to the merged ID(s). Click for more information about how we merge users.
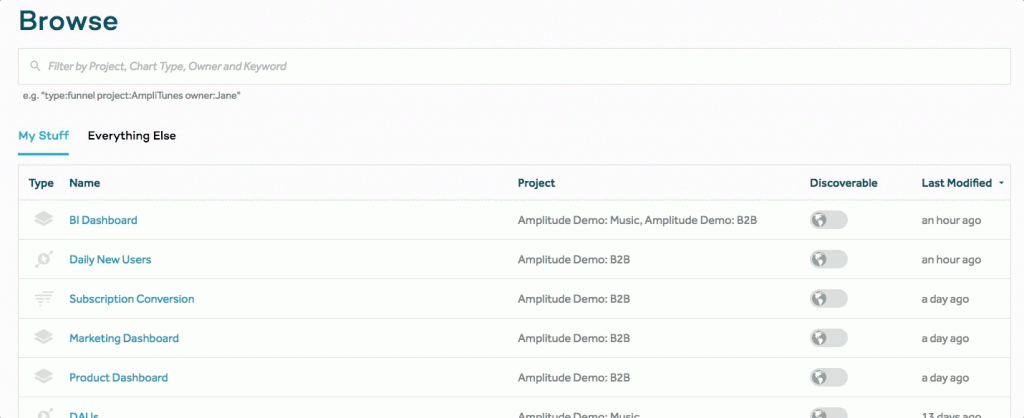
Browse Charts: Search by Team
(Enterprise Only) In the Browse Charts tab, Enterprise customers can filter by the “team” (e.g. Product, Marketing, Engineering, etc.) a user belongs to.
3) UX Improvements
Redesigned Datepicker
After collecting lots of user feedback, we have a new date picker on the way! This redesign took place in order to improve user experience and reflect a more focused design.
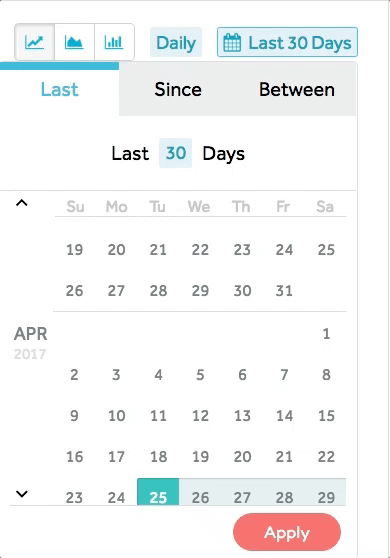
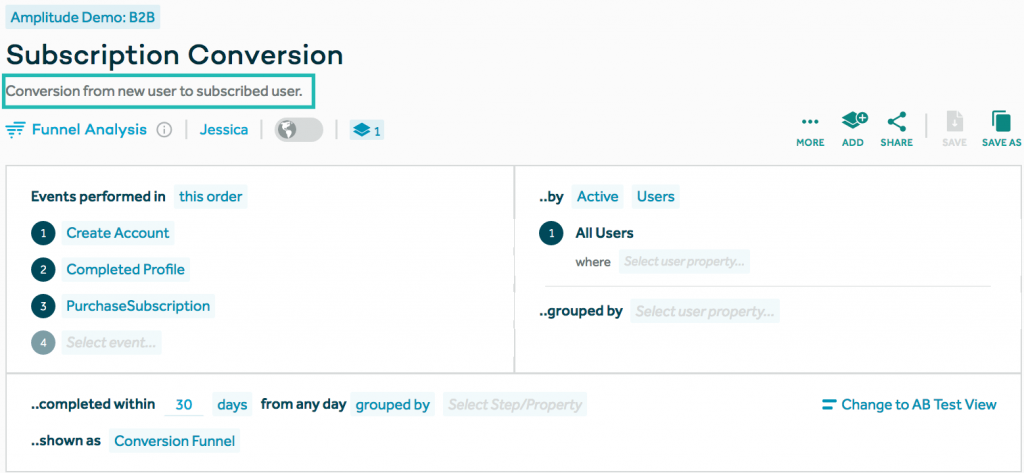
Chart Descriptions
You are now able to add chart descriptions for each chart underneath the title. This is useful so that you can add context around the chart you have created.
Product Analytics Playbook: Mastering Retention
This first volume of our product analytics playbook provides a 155-page guide on how to use data to make better product decisions and improve user retention. You can .