Release Notes: March 2016
Product and features update from Amplitude.
Compass, Pathfinder, Rename Events, Funnel Updates, and More.
1) Compass
Note: Compass is only available on the Enterprise plan.
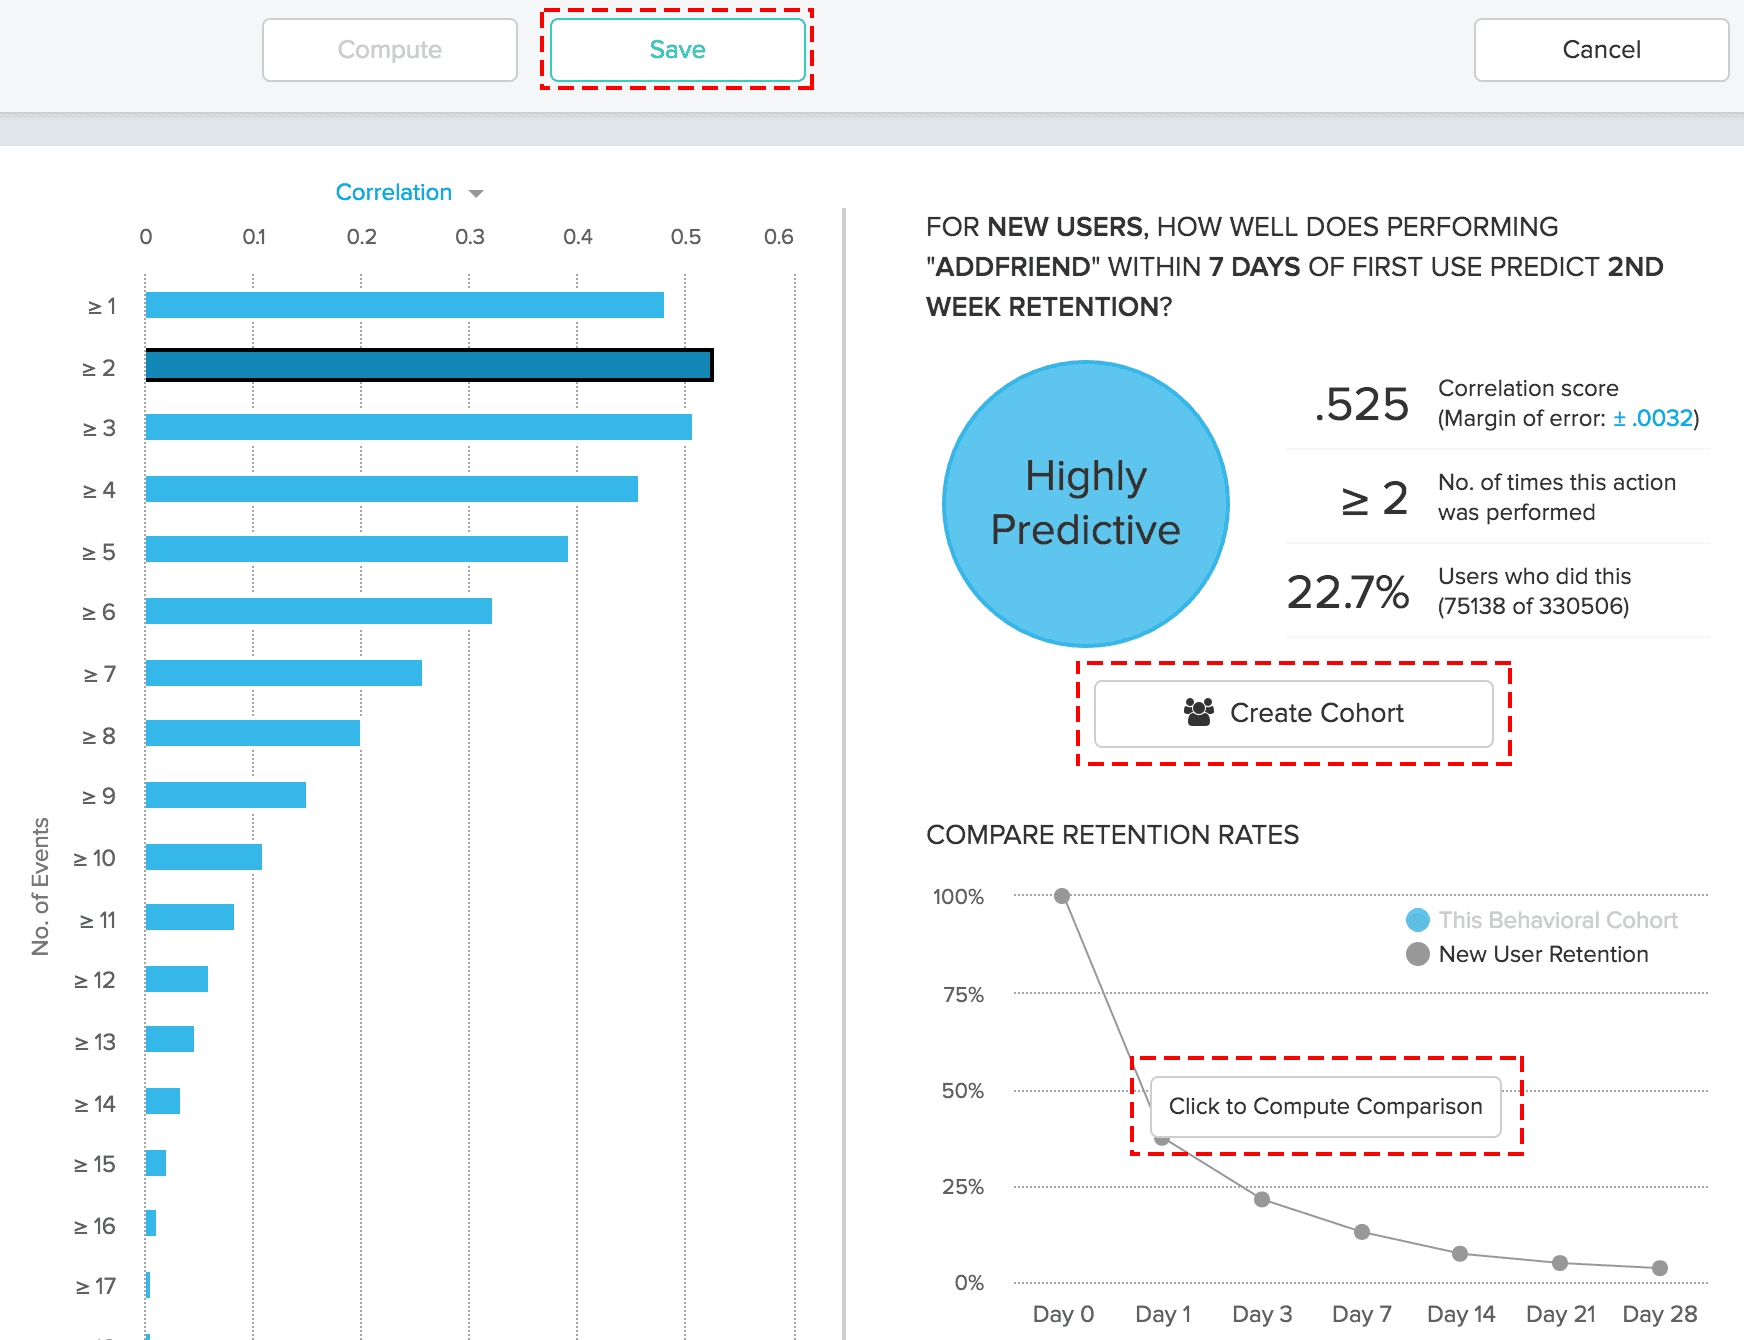
Compass helps find thresholds of user behavior that predict long term retention and ultimately lead to growth for your application. Previously known as the Growth Discovery Engine (GDE), Compass is a big redesign of GDE with additional features.
In Compass, you can directly compare the retention of a selected set of users to all of your users, create a cohort of that set of users for further analyses, and save Compass reports for future review.
Read more about Compass here.
2) Pathfinder
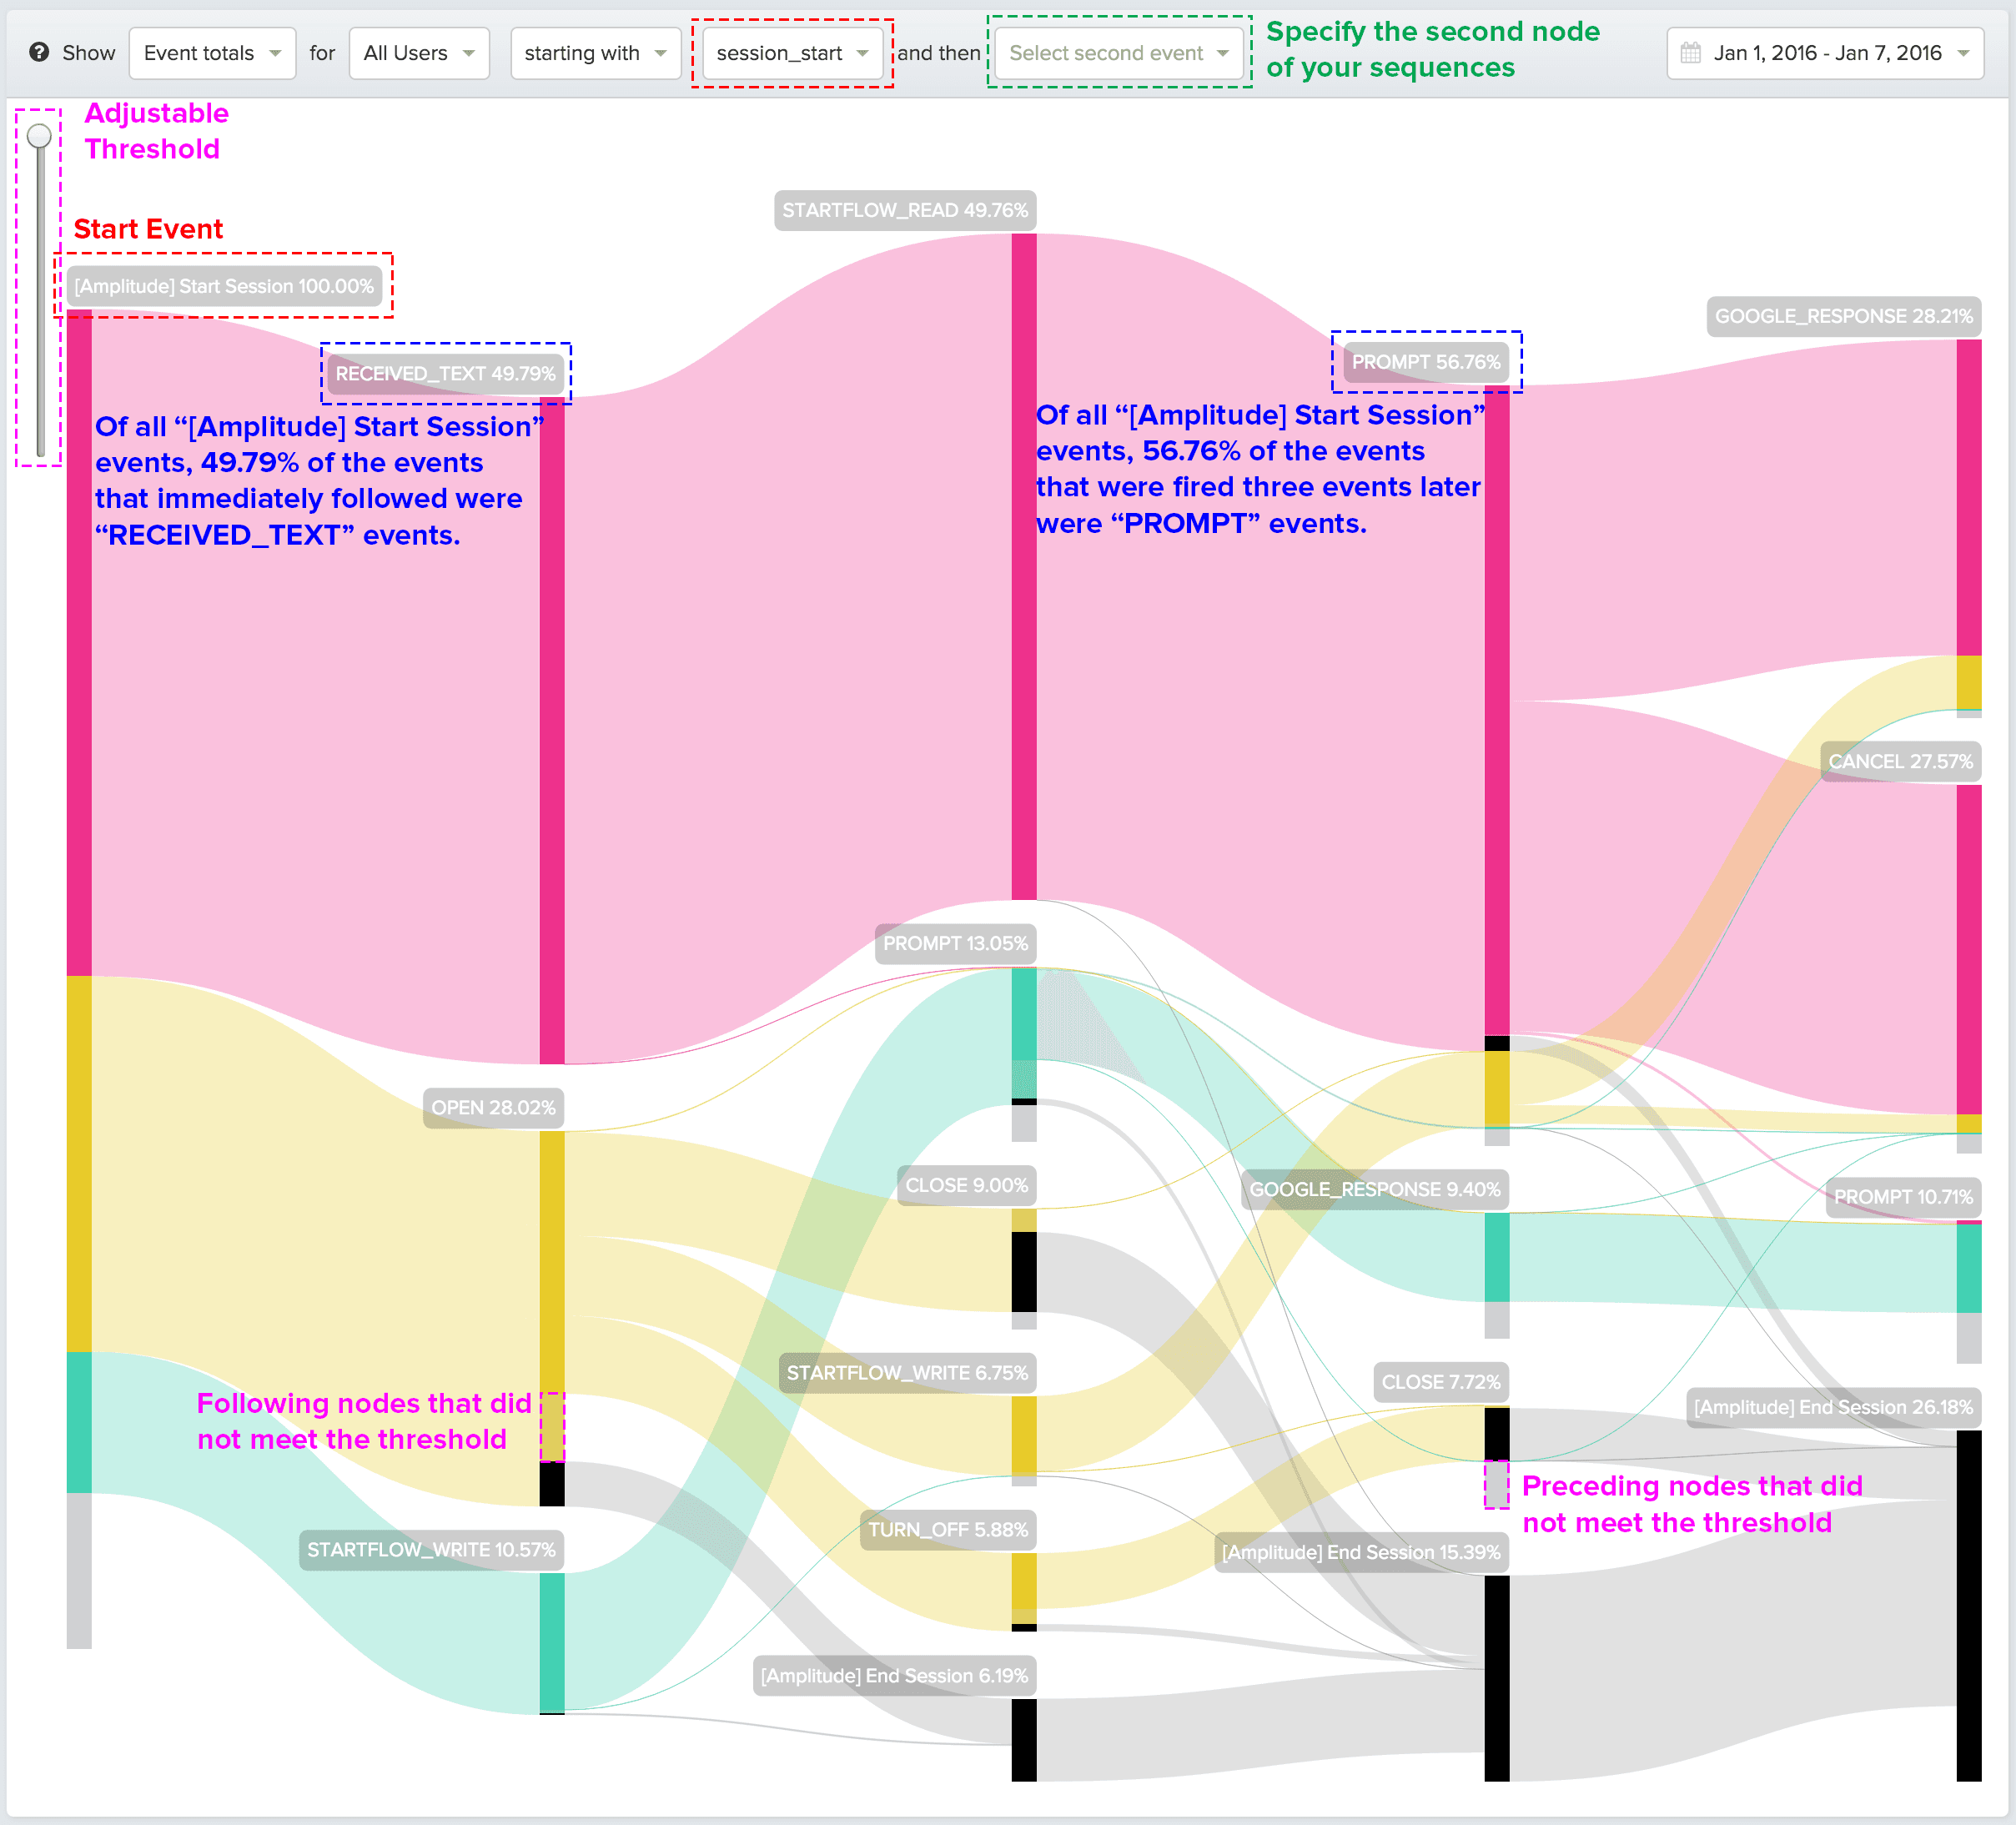
Note: Pathfinder is only available on the Business and Enterprise plans. Pathfinder is a redesign and the next version of Event Flows for the “Totals” metric. Pathfinder shows you all of the events and sequences of events that users take inside your app during a specified time, all in one view. Unlike Event Flows, you can now view multiple paths from any starting or ending point. In addition, Pathfinder allows you to more easily explore the Other bucket by increasing the granularity threshold.
The below image verbalizes a Pathfinder report. You can find the same image and more information on Pathfinder here.
3) Rename Events
You can now rename your events in your app’s settings page, under the “Manage Data & Events” subtab.
Important Notes:
- If you give two events the same display name— they will NOT be combined or merged. In other words, there will be two events in the UI with the same name and they will be indistinguishable.
- Renaming events only affects our UI. If you have Redshift, you will have to query the event by its recorded or instrumented name.
4) Funnels: Duplicate Funnels
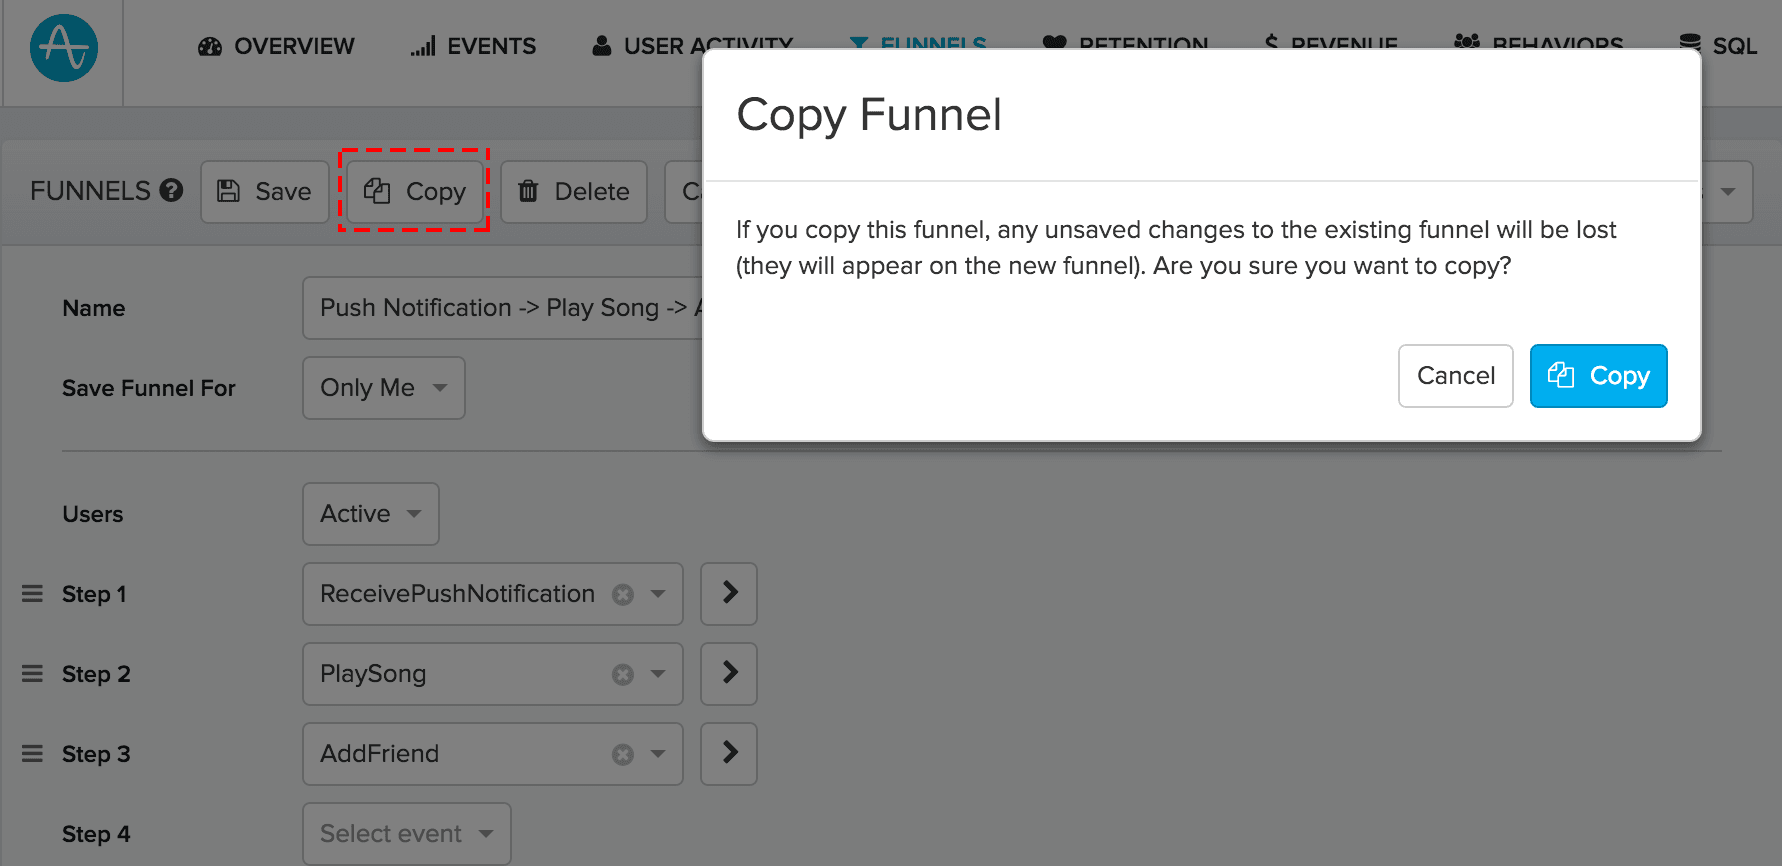
You can copy and save a funnel. To do so, edit the funnel of interest and then click on the “Copy” button at the top, as seen in the image below.
Read more about Funnels here.
5) Funnels: CSV Export of Conversion Time
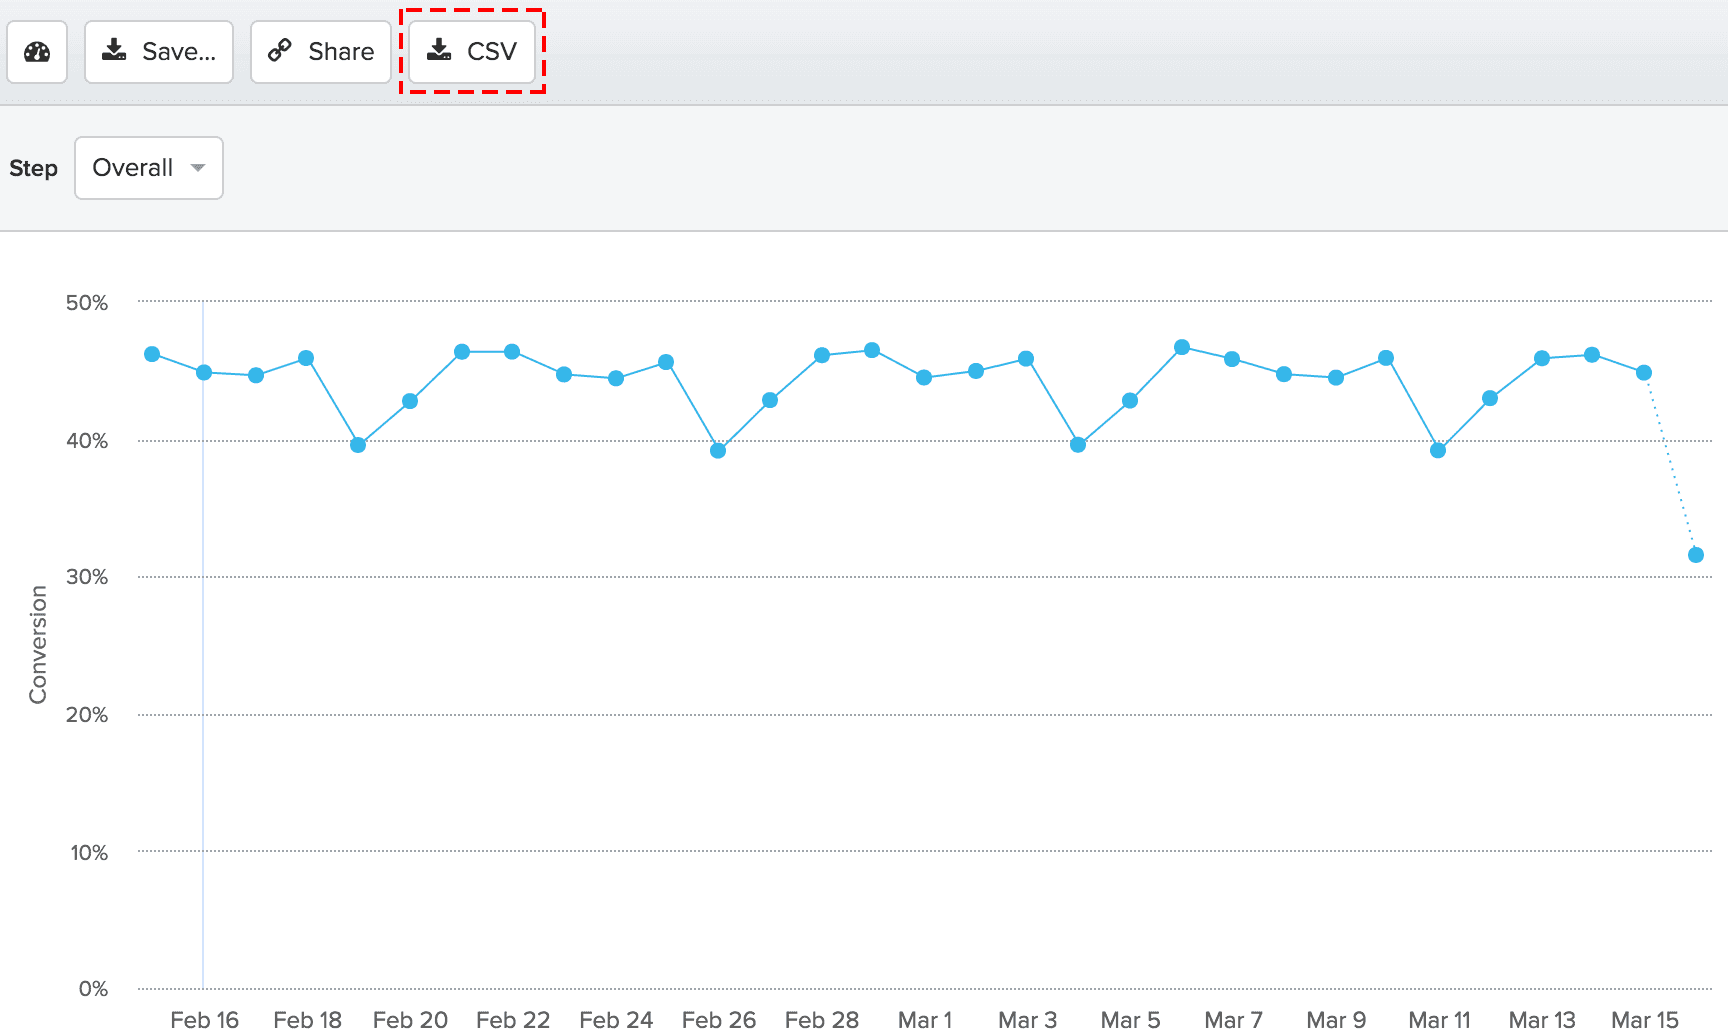
You can now export as a CSV your funnel conversion rates over time.
Read more about Funnels and the Conversion graph here
6) Funnels: Event Property Distribution
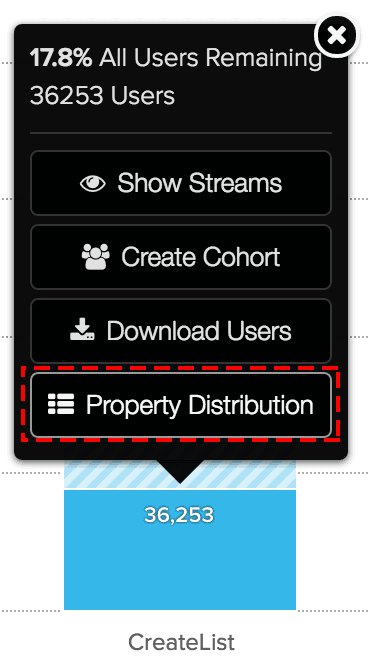
Previously, you were able to view the event property distribution of a certain funnel step via the Conversion graph. You can now view this information through Microscope.
Read more about Funnels and the Property Distribution here.
7) Formulas: User Property Group By
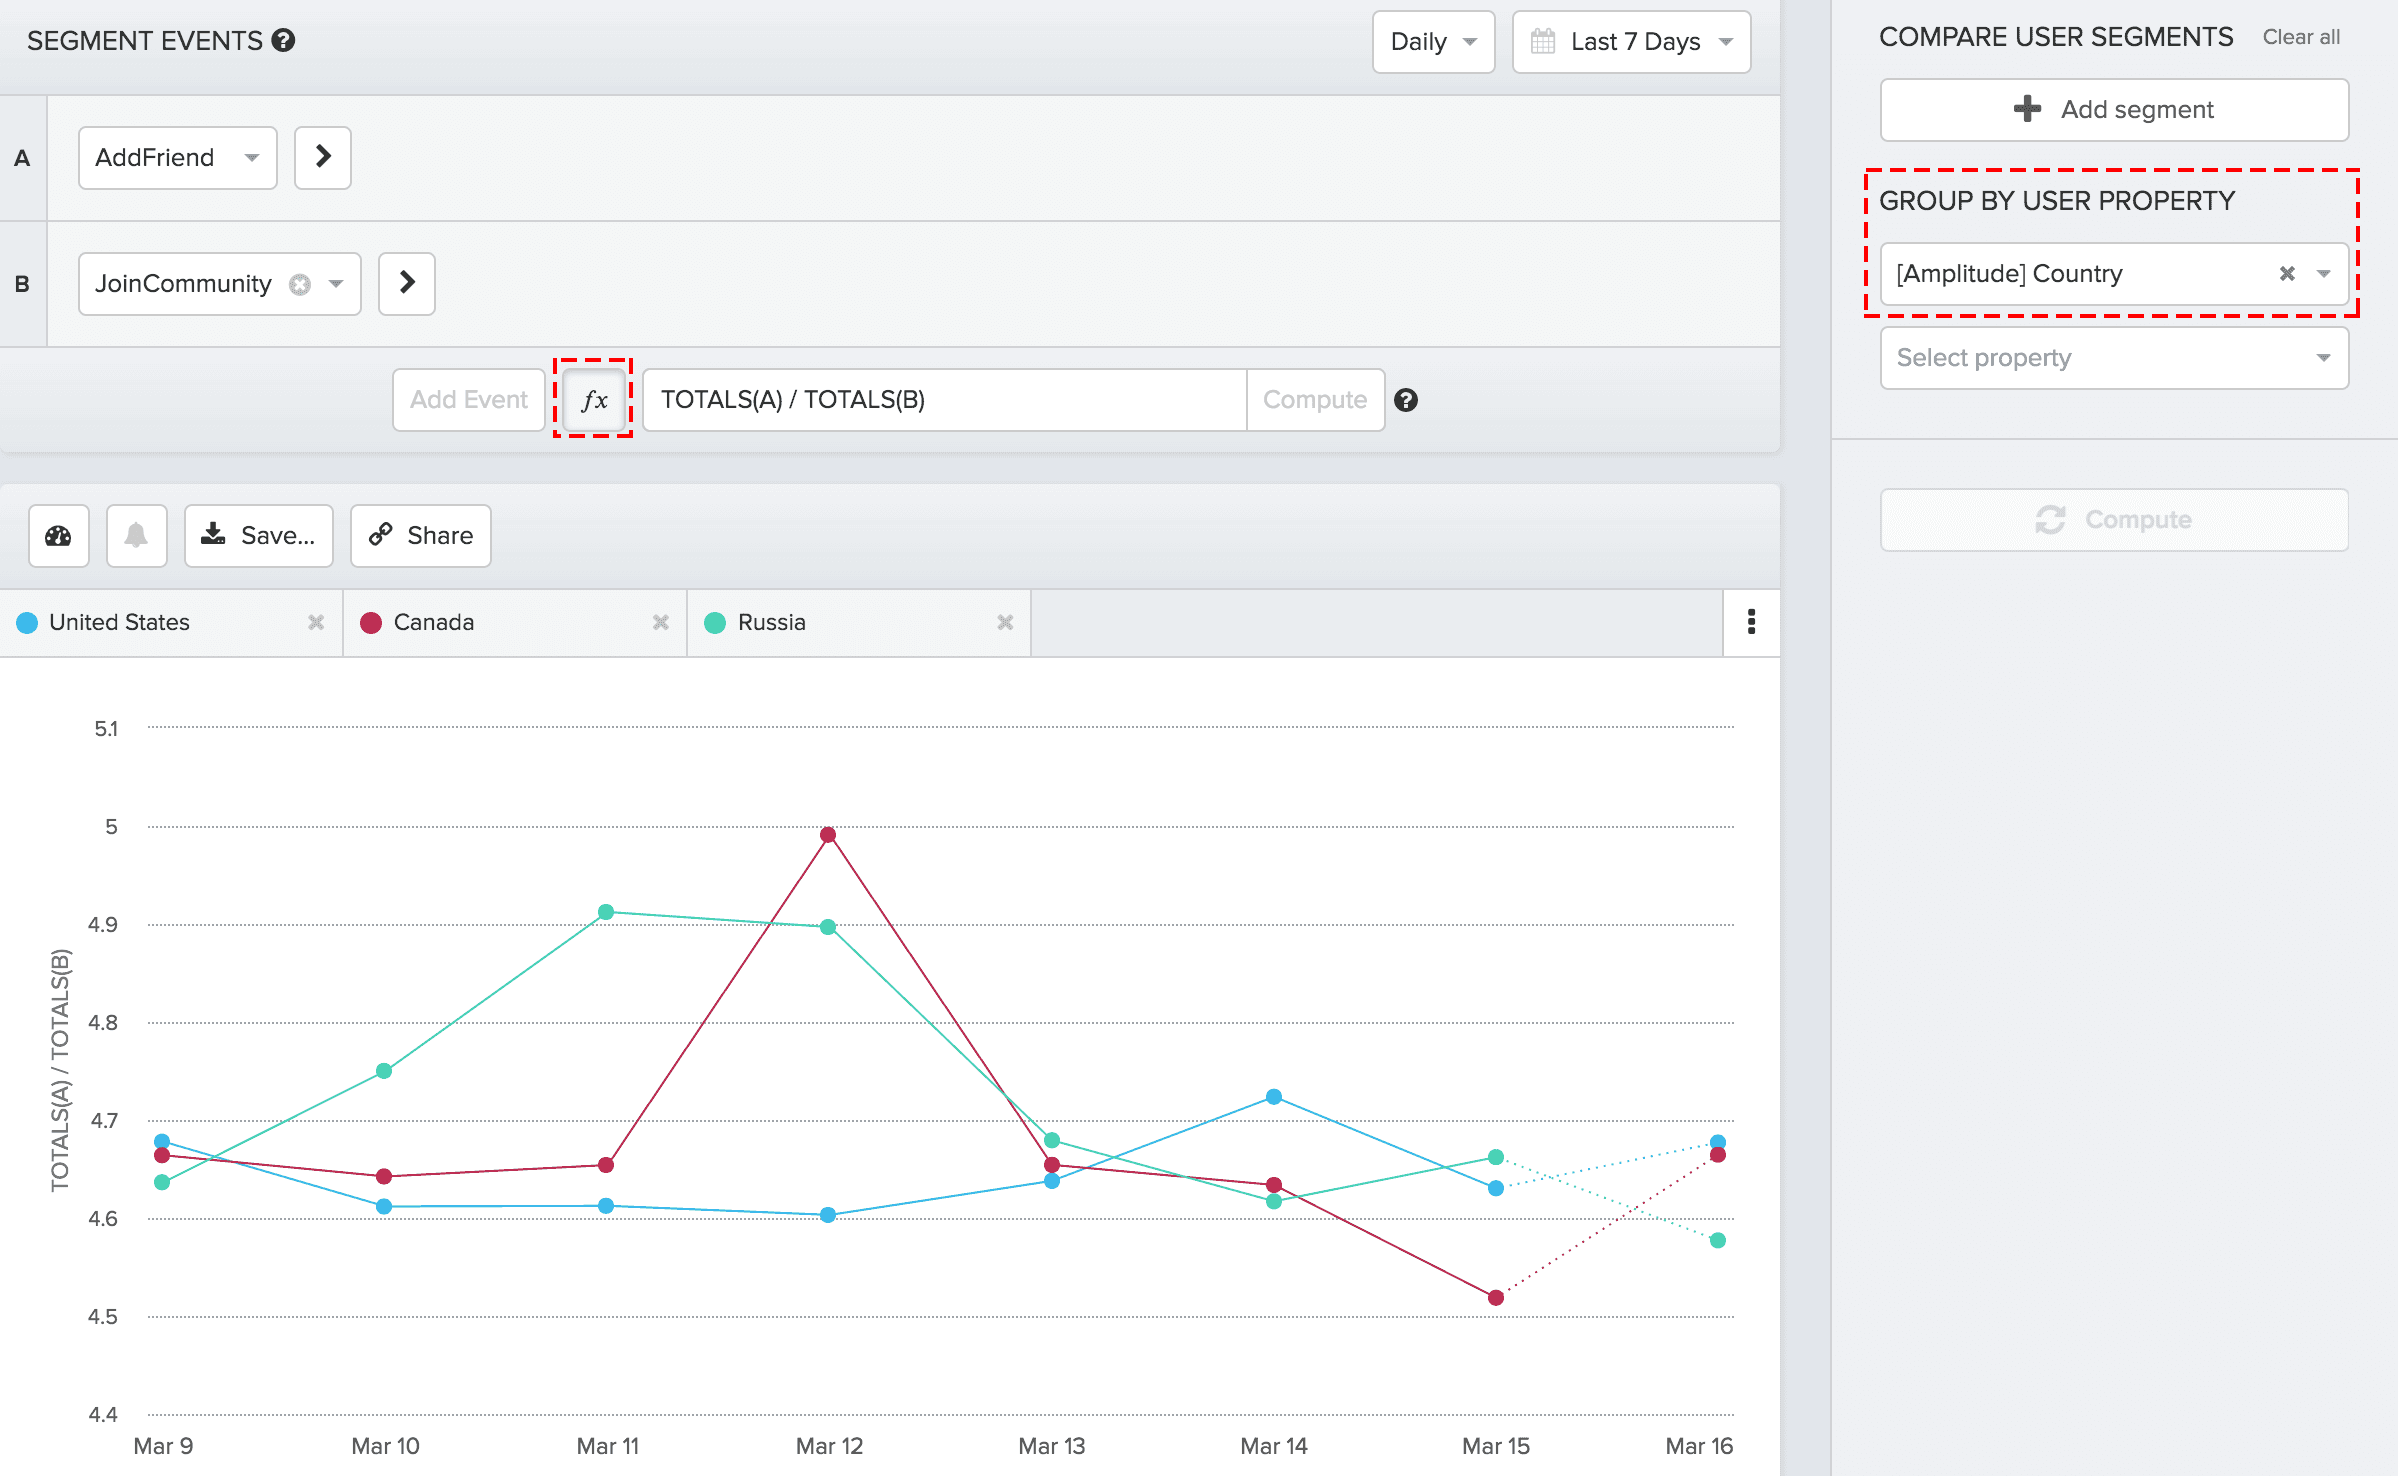
You can now apply a Group By function in the segmentation sidebar to a formula. In the image below, we segmented our formula by the “[Amplitude] Country” user property.
Read more about formulas here.
8) Segments Persist in Dashboards & Images
Previously, if you performed a Group By function in the segmentation sidebar and selected/deselected segments from the graph, the selected segments would not persist when the graph was added to a dashboard or saved as an image. Now, if you select or deselect segments, the segments will persist in your dashboard or saved image.
9) SDK Updates
We highly recommend that you update your SDKs to the latest versions:
Amplitude-Android 2.5.1
Since v2.5.0:
- Major bug fix.
- No updates since the last product email.
Amplitude-JavaScript 2.9.1
Since v2.9.0:
- Bug fixes.
Unity-Plugin
Since January 3, 2016:
- Updated to use Amplitude-iOS v3.5.0.
- Updated to use Amplitude-Android v2.5.1.
- Added support for user property operations
10) Questions?
If you have any questions, comments, or concerns, please reach out to contact@amplitude.com. You can also find previous release notes here.

Wendy Vang
Former Enterprise Solutions Architect, Amplitude
Wendy is a former Solutions Architect on the Success team, where she helps customers instrument and utilize Amplitude. She graduated from Stanford University and enjoys boards games, picnics, and learning a new skill every month.
More from Wendy


