Companies Overspend on Marketing, Underspend on Product
Carve out a marketing budget for your next launch. But get your money’s worth by building a product your users want to come back to.
Nothing exhibits financial promise like a company with a telltale hockey-stick growth graph. Pre-revenue, seed-stage companies, in true lean fashion, launch a minimum viable product and then throw all their resources into acquiring users as fast as they can. Most average-sized tech companies spend around 10-20% of their revenue (or ARR) on marketing and sales — some early SaaS companies can spend up to 120%.
It doesn’t stop there. The proportion of marketing spend will only rise as the cost of user acquisition rises. And, in fact, the cost of acquiring one user in B2C companies rose to $4.23 in December 2015, an increase of 101% year-over-year. Additionally, the cost per install increased 25% in iOS and an astonishing 144% in Android year-over-year.
There’s only one time when paid acquisition makes sense: when it is profitable to do so. That is, when the profit generated by a user (their lifetime value) exceeds their cost of acquisition (CAC). Dropbox’s early paid search campaign saw a CAC of $233-388 while their product was only $99; it did not take them long to realize that they could not continue to grow that way. They were failing to maximize their ROI.
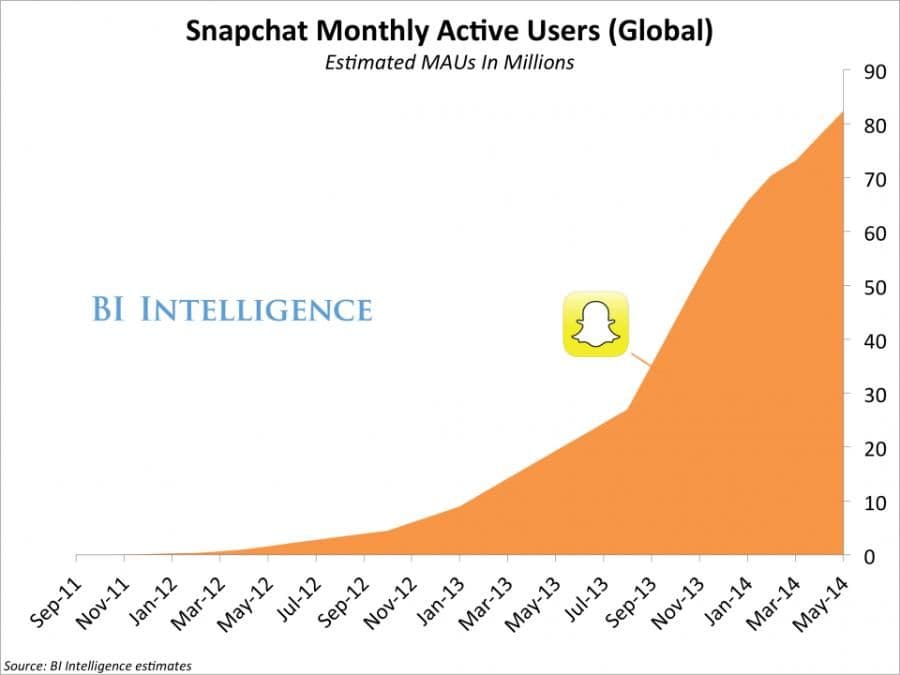
Snapchat started to show hockey stick growth of their monthly active users starting in 2013.

Companies overspend on marketing, without taking the time to recognize whether their gross increases in daily active users or downloads are actually turning a profit. In fact, most companies spend twice as much on marketing and sales than on product development. Here’s the thing — marketing campaigns when done right can certainly get you to that hockey-stick growth. But if you fail to address product weaknesses and users stop seeing the value of your product, churn is inevitable.
Maximize marketing ROI by increasing user retention
No matter how much you initially throw into marketing, the fact of the matter is that the average app loses 80% of its active users within the first three days after install. When the bulk of your hard-earned paid users churn, their LTV drops, and just like that, your ROI is in the red. As Peach learned earlier this year, no matter the extent of marketing and media support that goes into an app launch, if the app’s core experience is flawed, you fail to retain your users and the app is dead.
Early companies aren’t the only ones falling prey to prioritizing user acquisition over retention. Even the biggest tech companies are being punished for failing to retain their users. In the last quarter of 2015, Twitter disappointed investors with much lower fourth-quarter revenue estimates than expected and also failed to show any improvement in their sluggish user growth. Twitter shares plunged 13% as a result. Lesson learned.
Acquiring users is meaningless, expensive, and ultimately a waste of time if you cannot retain them. How do you drive user retention? A quick Google search turns up thousands of results, but they can all be distilled down to one fundamental point: Figure out how to deliver the core value of your product to your users.
Find out why users retain by using analytics
Where tech giants like Twitter failed, mobile trivia app QuizUp succeeded phenomenally; the addicting game boasts over 33 million users. But not to be blindsided by the success of acquiring users, QuizUp began focusing on user retention almost immediately after launch. It was clear they were doing something right, but to understand what it was, they had to get into the heads of their users.
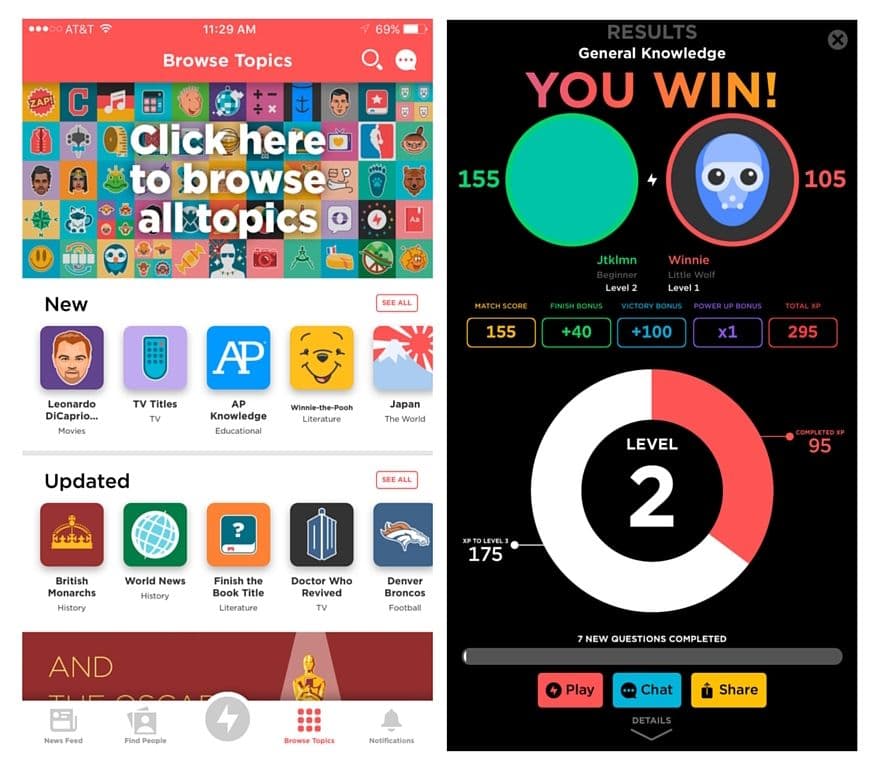
QuizUp users choose from a number of different quiz categories and can engage with other users with similar interests.

How do you begin to understand whether or not you are succeeding in delivering the core value of your product? You have to understand the actions they take — or events they perform — within your app. Sophisticated event-based analytics tools provide the means to analyze cohorts of users who performed a specific action or sequence of actions in the app. Sometimes these behavioral cohort analyses reveal surprising features of your app that your users value.
When QuizUp first launched, CEO Thorsteinn Fridriksson noticed that their users were organically creating social networks around topics of interest. So their data science team wondered: Did QuizUp users who used social features retain better?
Answering questions like this would have been incredibly time-consuming, involving weeks of manual analysis on raw user data by the data science team. Instead, they elected to use Amplitude’s new tool ‘Compass’ and tested their hypothesis in minutes, with just a few mouse clicks.
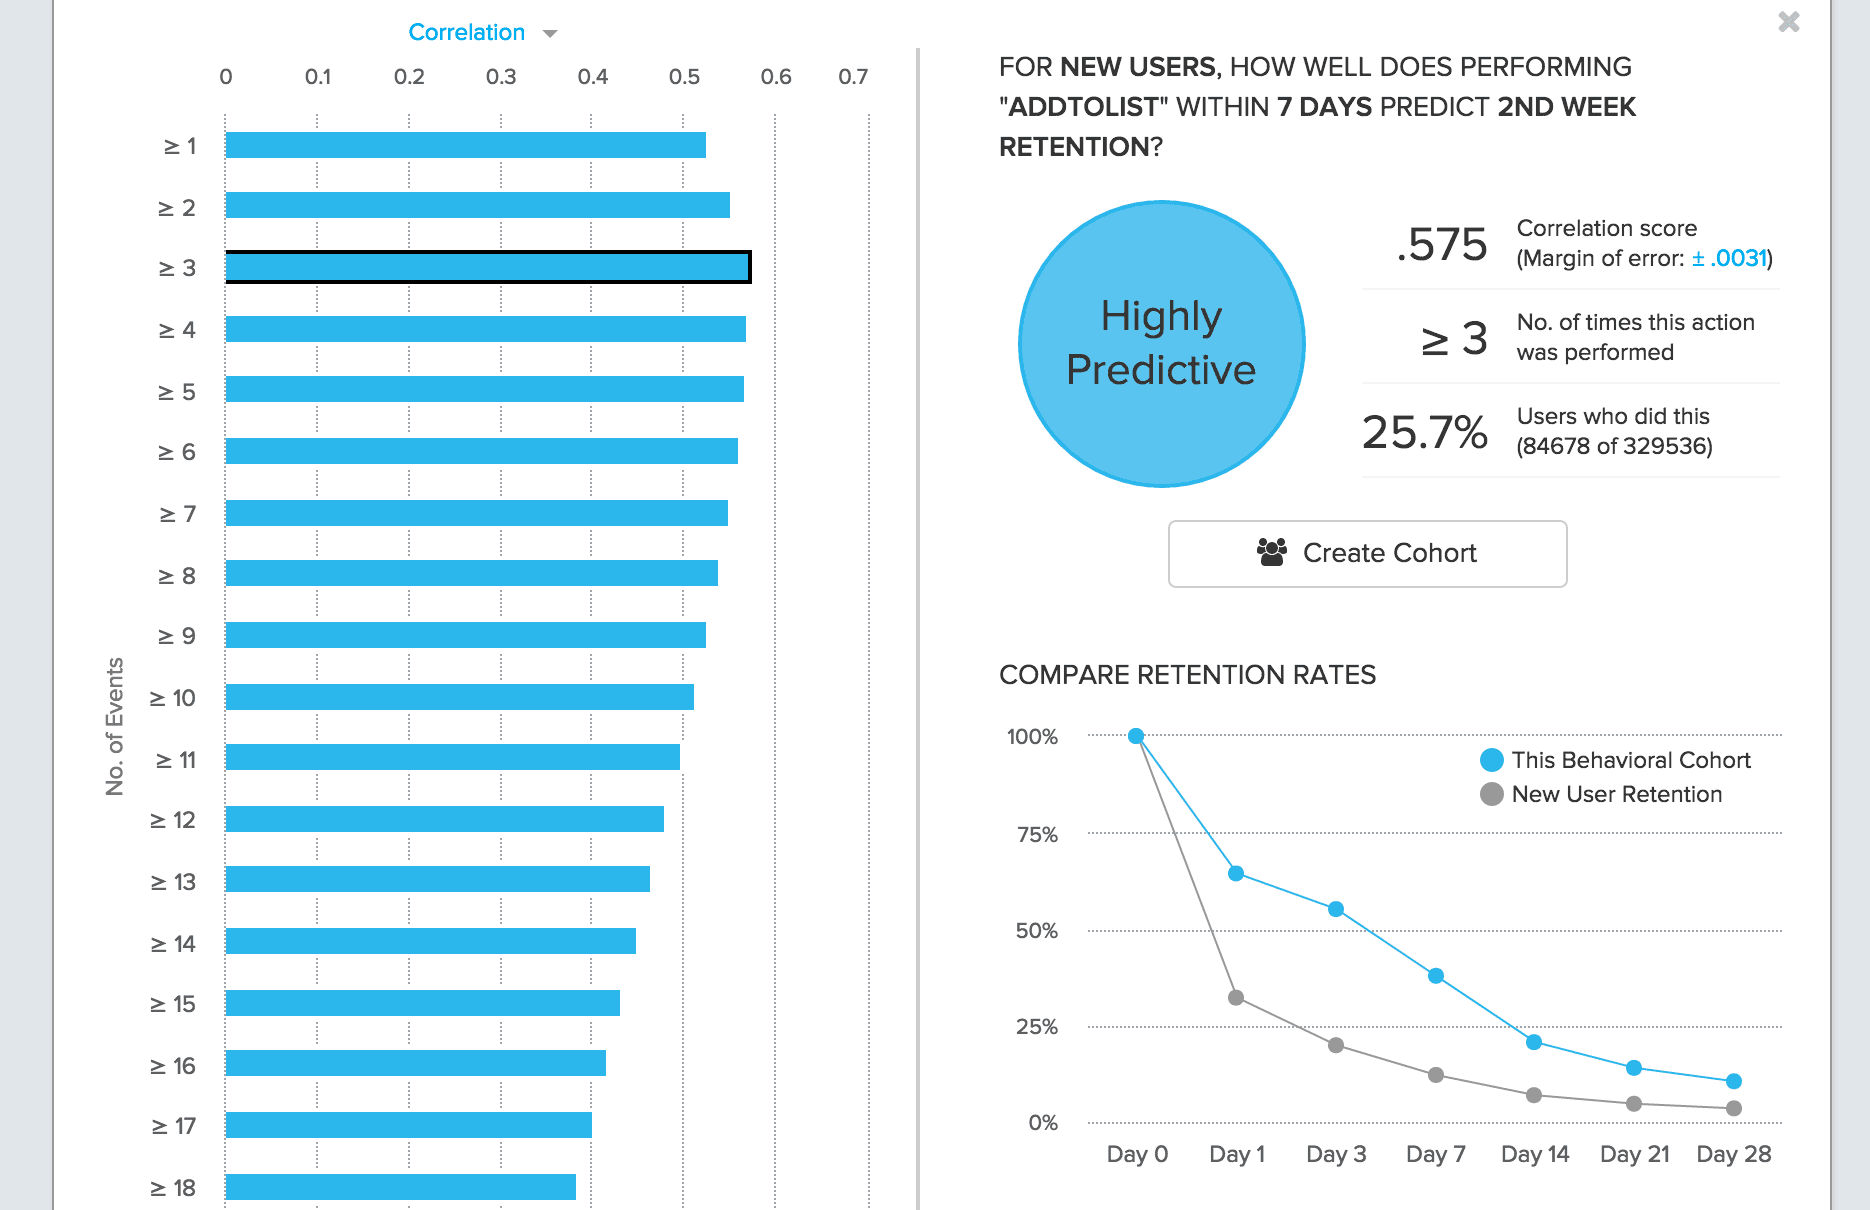
Compass is a new predictive tool on Amplitude’s platform that scans through user data and uses statistical analyses to find out which user behaviors are most highly correlated with retention or conversion. Complementarily, it also reveals the correlation between any specified user action and retention.
This example of Compass shows the correlation of new users who perform the action AddToList within 7 days with weekly retention.

Using Compass, QuizUp’s data science team found that users who engaged with social features within the first 7 days of install had 60% higher retention than other users. It was immediately apparent that this was a core feature that users found so valuable that it impacted whether or not they came back to play the game.
QuizUp’s next steps? Finding an actionable way to leverage this insight and further drive their user retention.
Increase user retention by investing in product
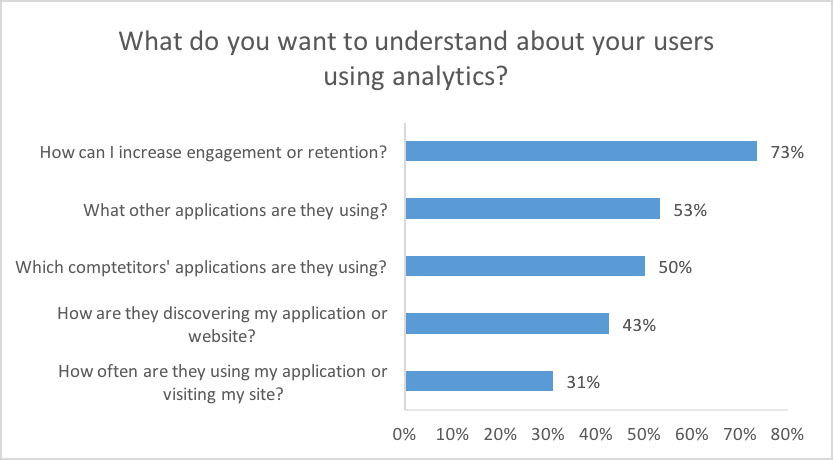
In a recent survey conducted by Amplitude, which included about 150 analytics users currently in the tech industry, 73% wanted to use analytics to answer questions about engagement and retention. About 80% used 1-2 out-of-the-box analytics tools for this purpose; many businesses paired a basic tool like Google Analytics with a more sophisticated platform like Amplitude, which lets both data scientists and non-data scientists alike gain powerful insights into user retention extremely quickly.
Our state of analytics survey report will be available for download in the coming week.

Using event-based analytics and universally accessible tools like Compass, businesses can shape a product that showcases its value and retain its users. But in order to do so, there must be a non-trivial investment into building the actual product, not just marketing it. QuizUp’s insight could inform their product team to improve their onboarding flow or their user interface design to bring to surface their social features, for example.
Carve out a budget for the ads, events, publicity, and all the other bells and whistles that accompany a marketing campaign for your next launch. But get your money’s worth by building a product that your users want to come back to.
Comments
Mrpeasy.com Mfg Software: Without advertising you will not have users. If you do not have users, you cannot ask them about your product benefits and misses.
Pareto CRM Software: Does the product matter if you have nobody to try it? On the other hand if you do have a decent customer base, you can afford to spend more time on your product.

Spenser Skates
CEO and Co-founder, Amplitude
Spenser is the CEO and Co-founder of Amplitude. He experienced the need for a better product analytics solution firsthand while developing Sonalight, a text-to-voice app. Out of that need, Spenser created Amplitude so that everyone can learn from user behavior to build better products.
More from Spenser


