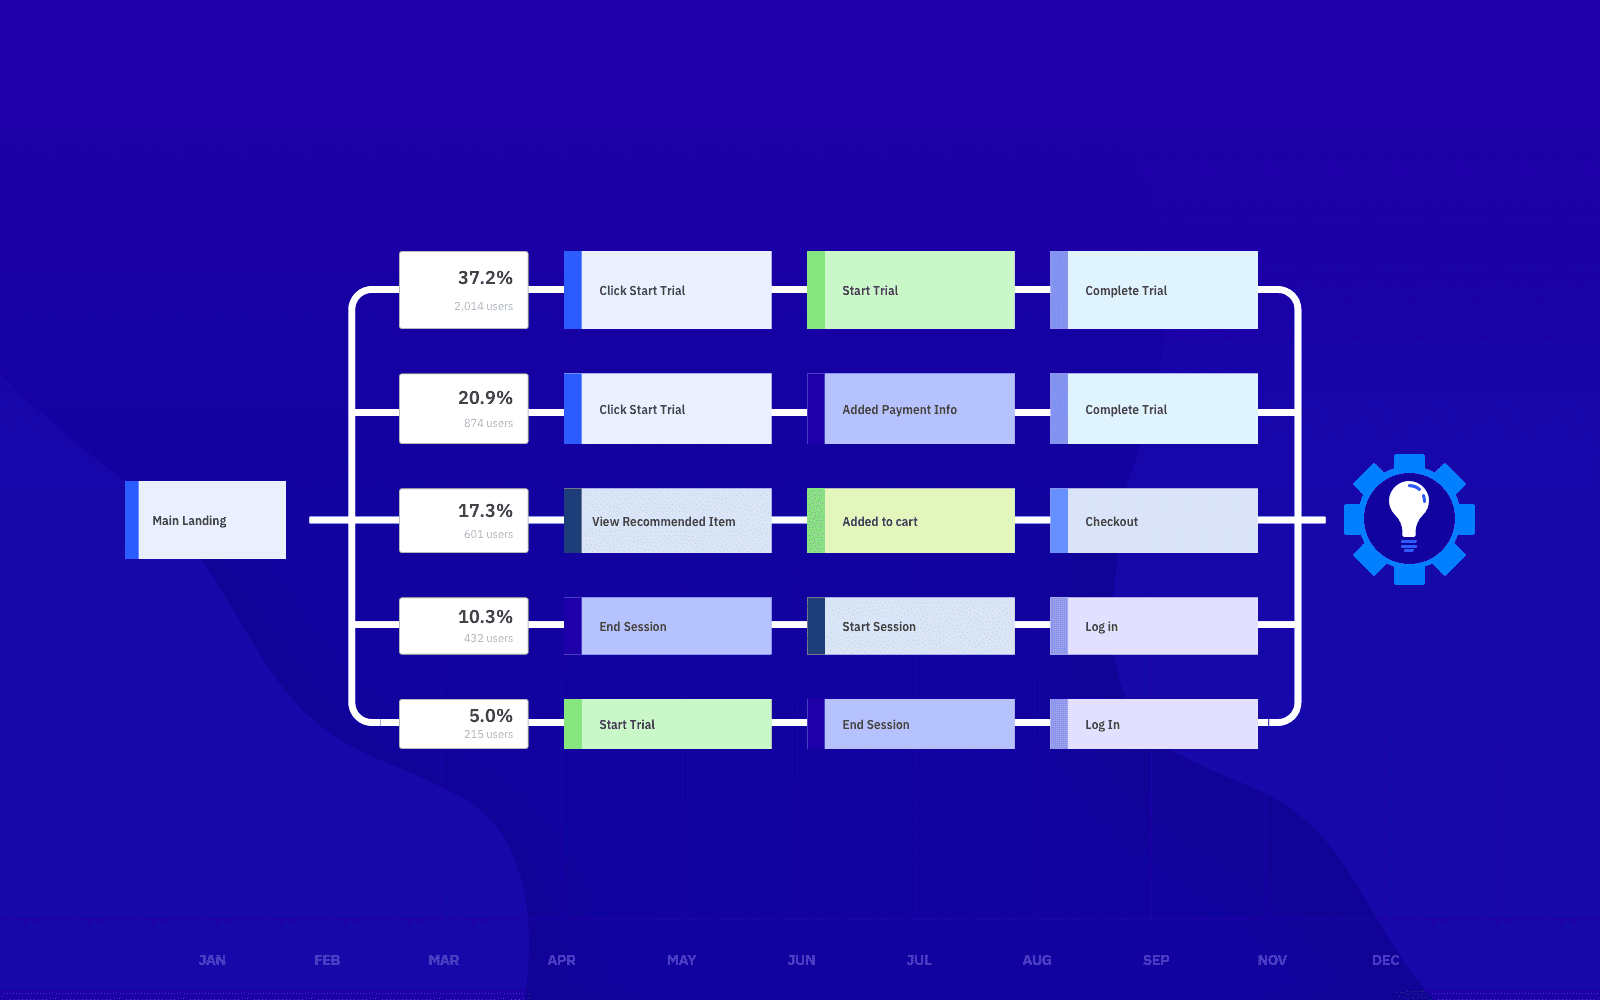
Run a Customer Experience Analysis with Product Analytics
In just a few clicks, you can perform a comprehensive CX analysis with Amplitude.
For any company with a digital presence, keeping your retention rates high andARR steady is of paramount importance. Achieving these goals means constantly improving your product experience.
You can send out as many surveys as you like, but there’s one truly honest measure of your customer’s experience—user behavior with context in the product. Companies must perform customer experience analysis to identify user actions that bring about friction or delight, and then gather insights based on these behaviors.
Luckily, there are tools available for gaining a complete picture of your customer experience. Amplitude’sproduct analytics platform gives teams a full 360 view of their customer experience, providing visibility along the entire user journey. This kind of comprehensive customer journey analysis will let you home in on exactly where you can make improvements to your customer journey.
What Is Customer Experience Analysis?
Customer experience analysis involves assessing everything that users touch across all your products (such as a website and/or app), from their first interaction onwards. Every button that your customers click, every push notification they swipe, every email they open about your product—those are all customer experience components.
This customer experience analysis tends to be complex. Even if you only want to look at regular features of the user journey—like point of access,conversion hotspots, and bounce rate—you’ll still be grappling with a lot of data. Customer experience analysis only gets more complex as your product expands and the product metrics you want to track get more specific.
To accommodate for high amounts of both regular and custom data points, you need a powerful, flexible tool.
That’s where a product analytics platform like Amplitude comes in. Amplitude can ingest data from anywhere, meaning your team has access to varied insights such as the push notifications a customer received to the amount of time it took them to perform a critical action after completing onboarding. In a product analytics platform, data is democratized—meaning it’s accessible and easy-to-understand for anyone at your company. By setting up a few customizable charts, your marketing, product, or customer success teams can gain a full view of the customer journey, and dive deeper into the moments that make or break a customer’s experience.
Why Does Customer Experience Analysis Matter?
Customer experience analysis gives you a comprehensive view of everything in your product that could contribute to either customer delight or customer frustration.
- Highlightsproduct adoption insights. A great CX analysis platform will help your product team understand what drives customers to use and reuse your product.
- Enables teams to improve theuser journey. During product development, your team will have developed specific ideas about the ideal path your users will follow in your product towards conversion. A CX analysis will help you spot bumps in the customer journey and brainstorm how you might smooth out those stages.
- Indicates product aspects that lead tochurn. Getting stuck in ad loops, non-intuitive signup processes, and poor in-product signposting are all big drivers of churn. Identify the product features that are driving users to leave with your customer experience analysis.
Customer experience analysis offers a lot of rewards, but to perform it properly, you need a structured approach, as well as a capable tool.
How to Perform Customer Experience Analysis with Product Analytics
Data comes into Amplitude from a variety of different sources, giving you the means to query every aspect of your customer experience. You’ll begin by getting a grip on your user segments. From there, you’ll be able to create a complete picture of your customer journey. Then, you can refine and improve each step of that journey to drive up conversion and fix areas of frequent churn.
Step 1. Review User Behavior by Segments
Your first step in analyzing the customer experience is to review user behavior. You can start out by creating an Event Segmentation chart to analyze a common action in your product. (In the screenshot example below, the common action is “Play Song or Video” for a music streaming app.)
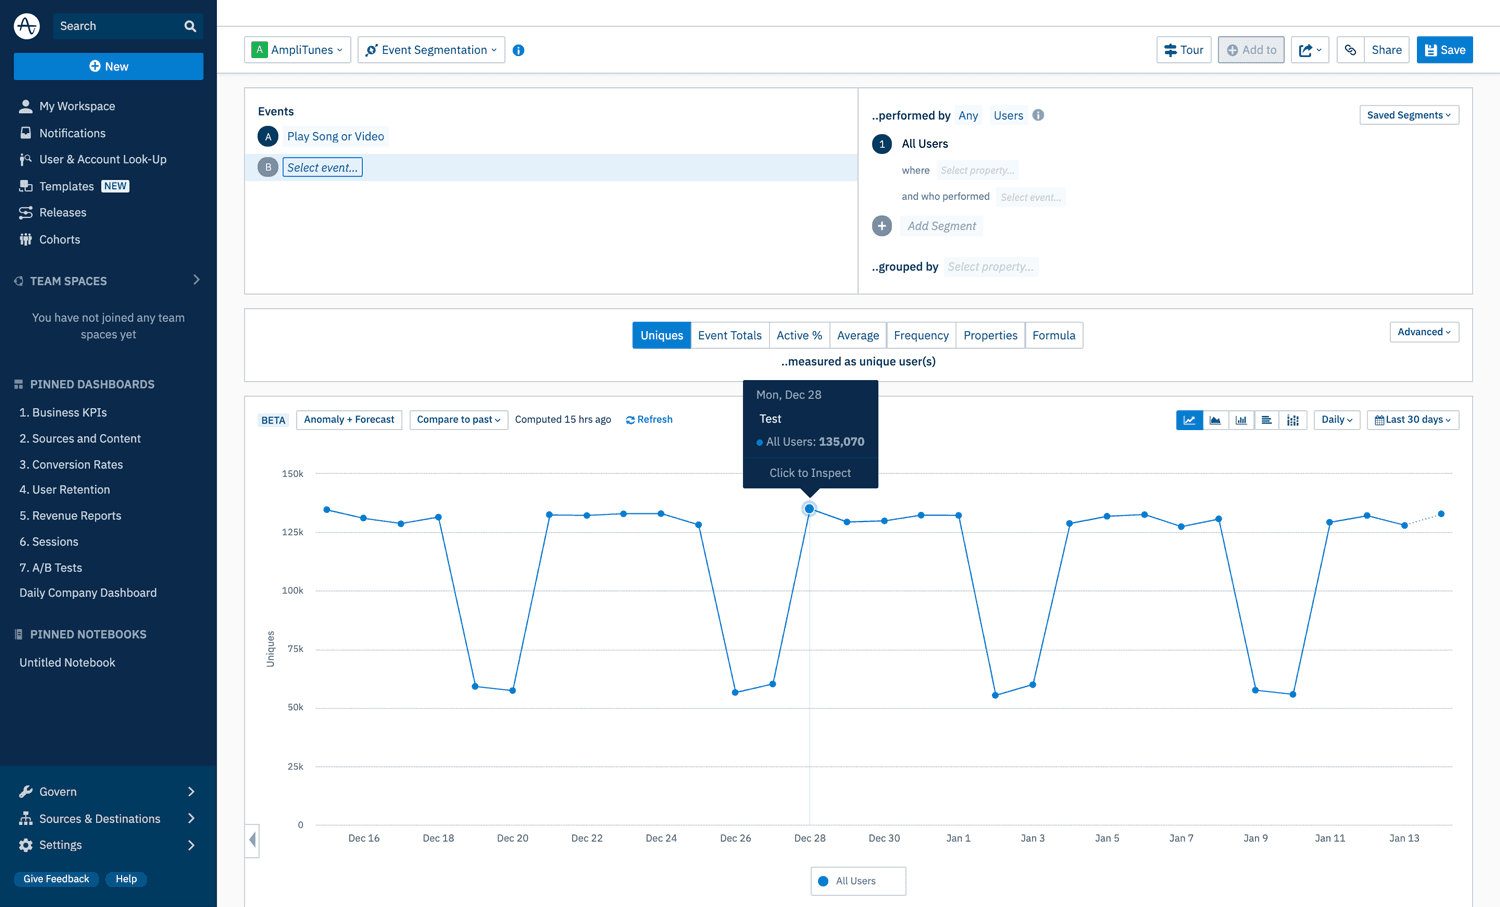
An Event Segmentation chart will show you the number of times the action was performed over a custom time period, such as the last week or the previous two quarters. It can easily do a period-over-period analysis as well. It’s a great chart to answer the “how many?” questions, such as, “How many times did users play a song or video in the last month?”
These charts do more than showcase how often an event was performed, though. They can also drill down into activity by certain user cohorts.
In any Amplitude chart, you can define which group of users you want to analyze. This process—segmentation—allows you to separate your customer base into groups based on similar traits and behaviors. After all, not all user groups are alike. Different cohorts find value from different aspects of your product. Users on Android might encounter different issues than your users on iOS. Same goes for your users in Germany versus your users in Singapore, and your lifelong subscribers compared to a cohort of new users.
No two user segments are alike, and a customer experience analysis of your segments helps you understand how different groups use your product and what it will take to retain these users.
To see how segmentation relates to customer experience analysis, let’s use an example dataset in product analytics for a music streaming app.
Below, we can see the insights generated from segmenting the event—“Play Song or Video”—by different user groups, such as users by platform and users by referral source.
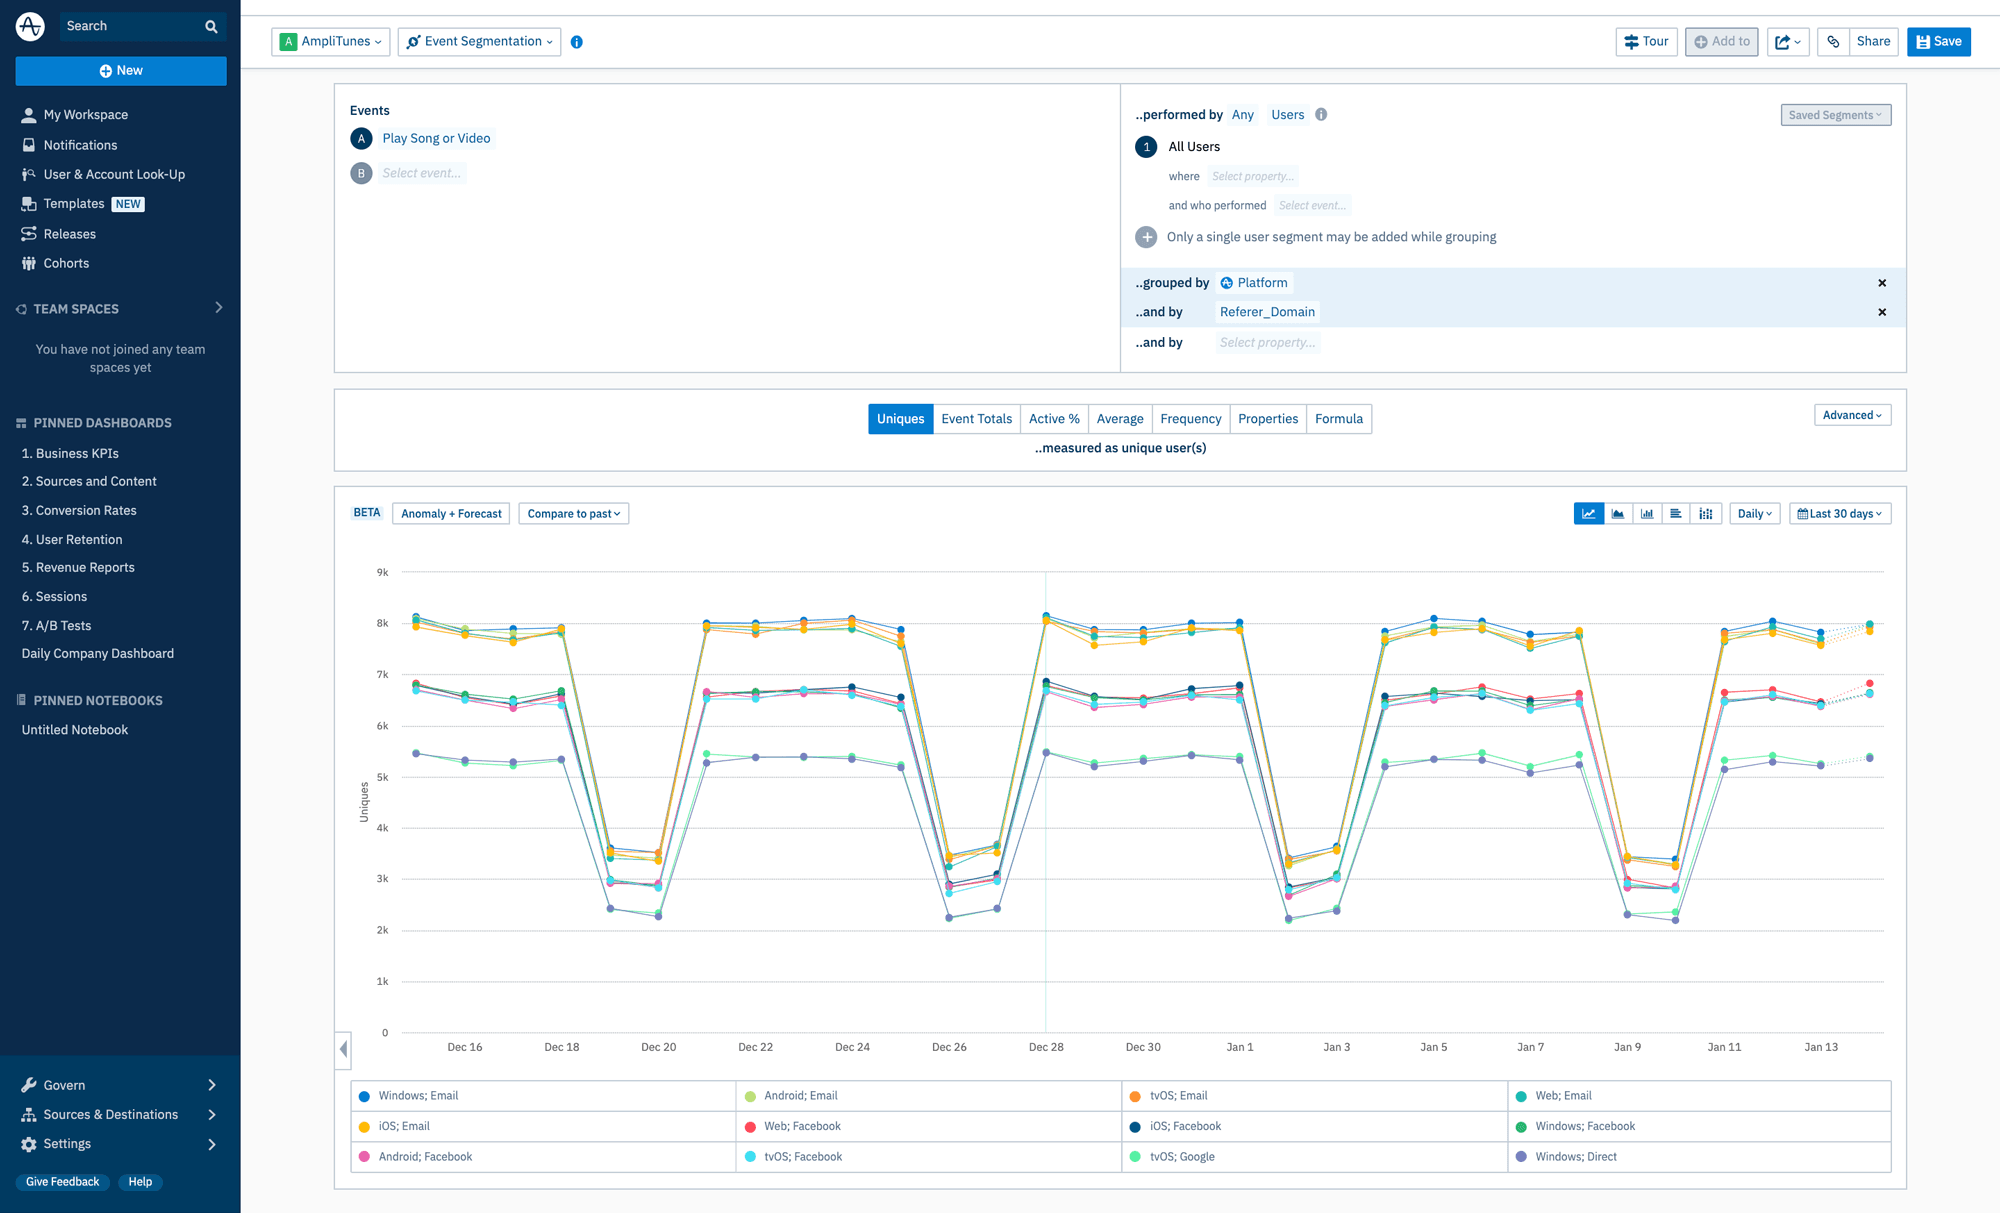
From here, we can identify trends to drill into further with customer experience analysis. For example, by changing the layout from line chart to bar chart (and looking at data grouped by month instead of day-by-day over the prior month), we see that regardless of platform, there’s more activity of “play song or video” from users who were referred to the product by email than any other source.
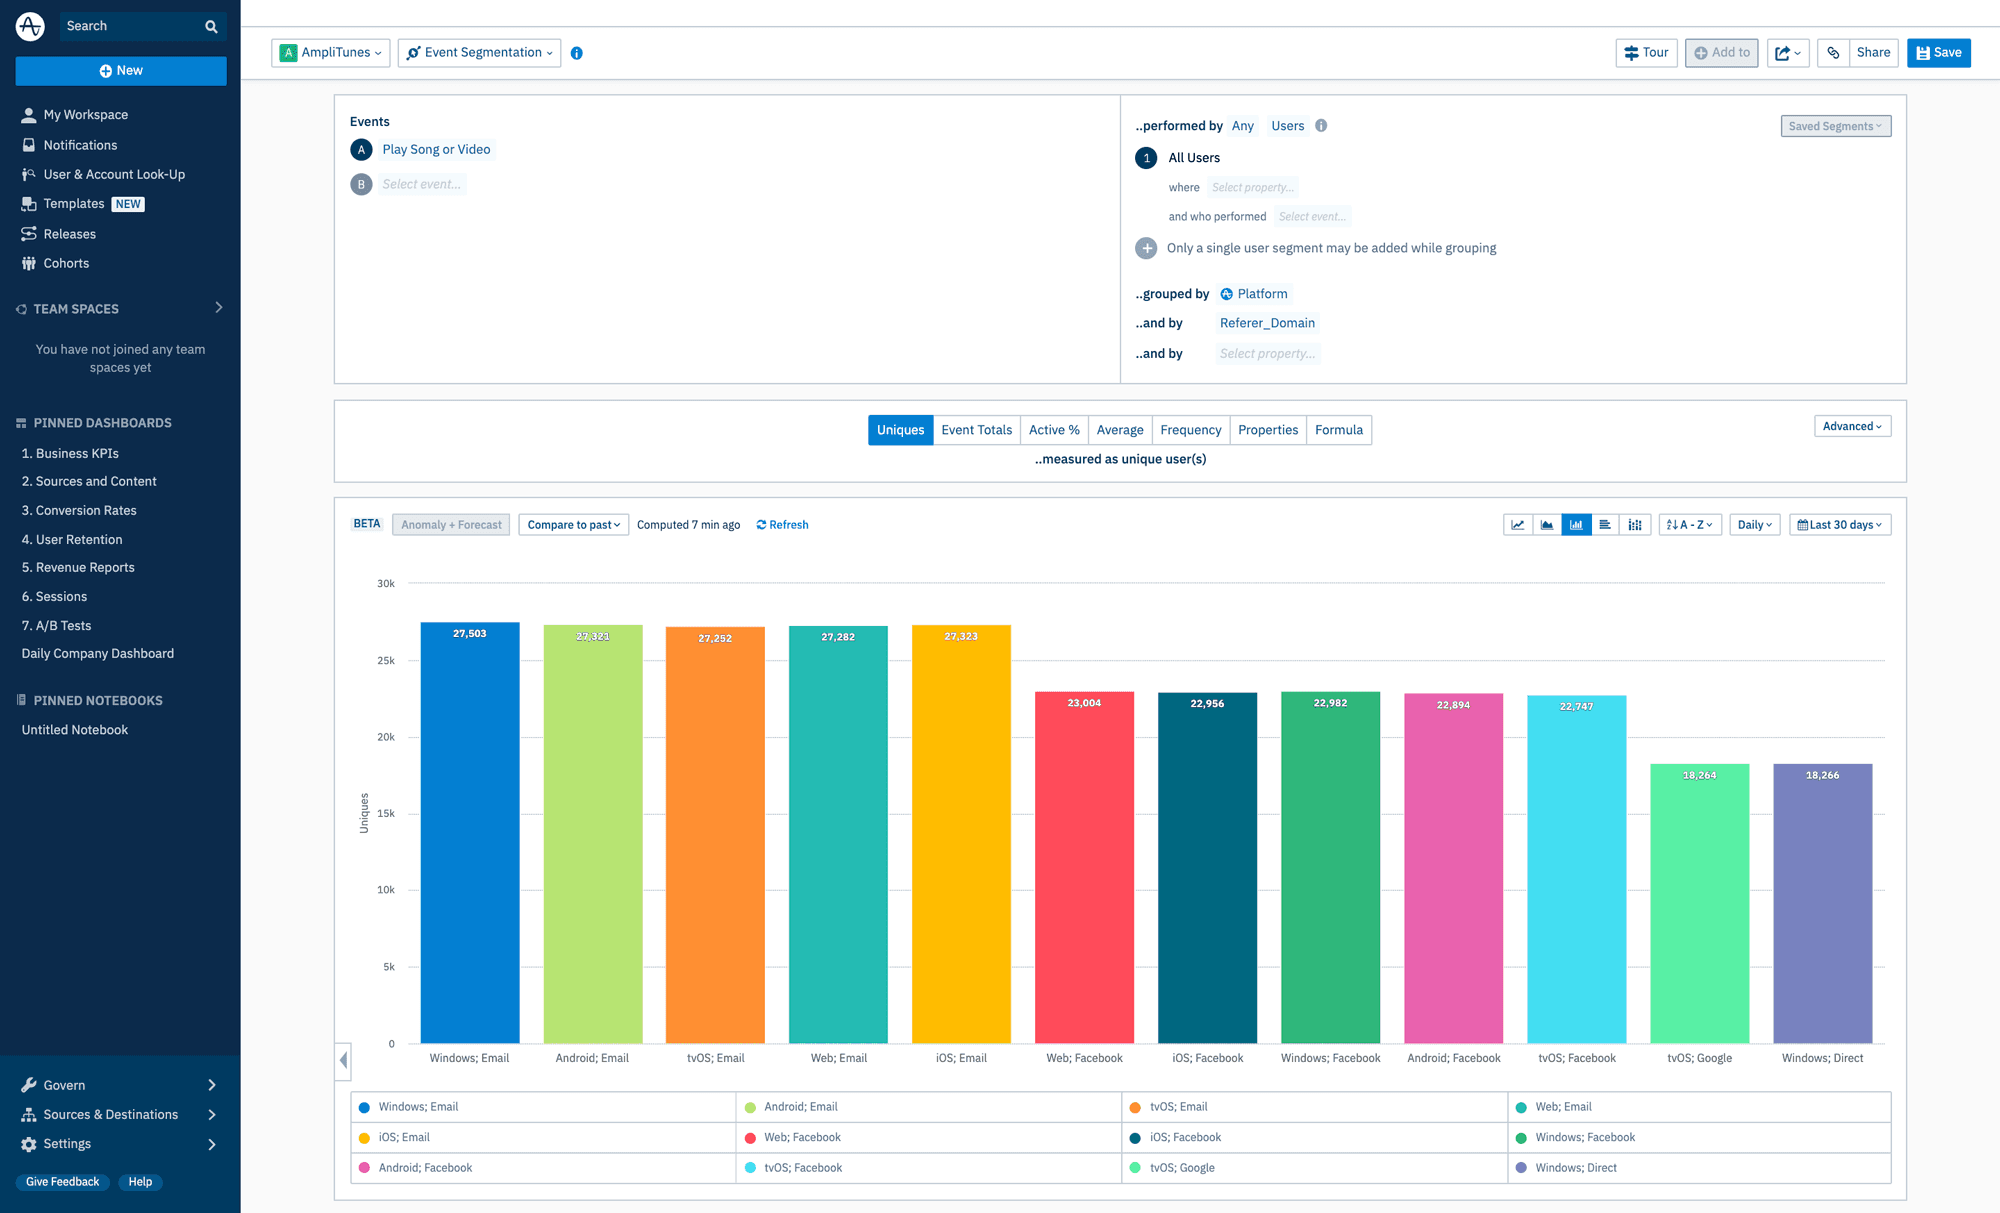
Another hypothetical configuration might suggest that users who have found your site vianatural language search or voice search are more likely to convert once on-page. These insights can inform your marketing team as to which channels would be most beneficial to target for new users.
Step 2. Dive in Deeper to Understand Conversion
Once you’ve worked out your customer segments, investigate their unique user journeys to understand what might drive them to convert and become a regular user.
This journey begins with users accessing your product and ends with them meeting a predefined conversion metric. With the music streaming app example, the user journey might start with a customer entering the product through one of the several channels we saw above and end when they purchase a song or video.
Understanding and visualizing the user journey across segments helps you understand where your product’s main conversion window is for different groups. This window typically revolves around one sticky product feature that leads people to become regular users.
To use more familiar examples, inSlack, a user’s conversion window might be when the user adds their first integration. They’re probably less likely to leave if they’ve begun customizing the tool. Similarly, once a user has begun recording meetings inZoom, they’re probably much more likely to retain the service.
Plotting your user journeys with product analytics is straightforward with tools like Microscope in Amplitude. Available in all Amplitude charts, this feature allows you to click into a particular data point and explore more.
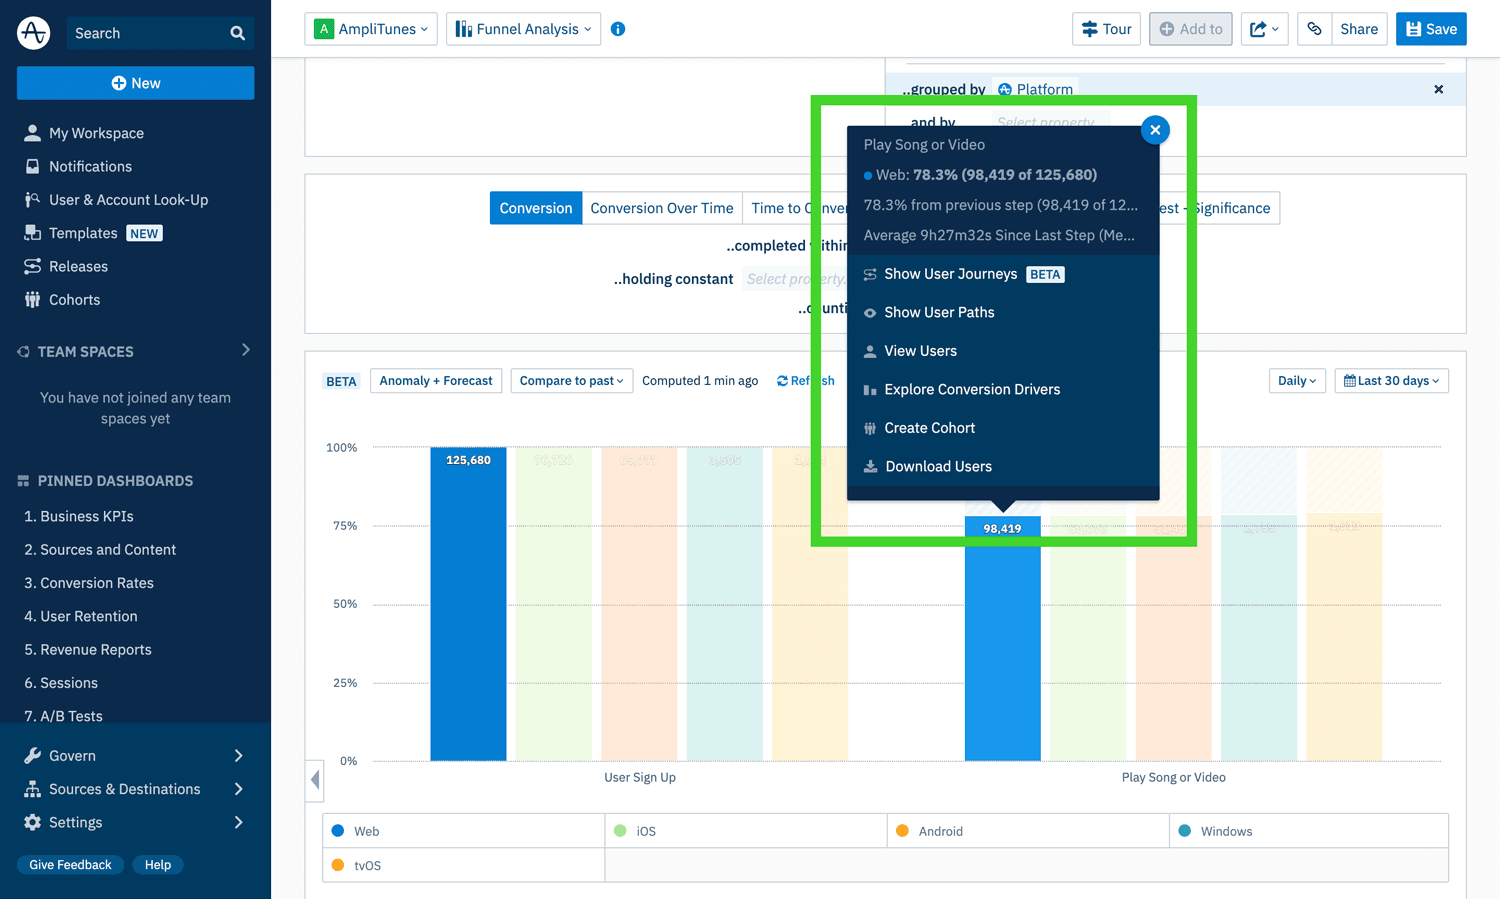
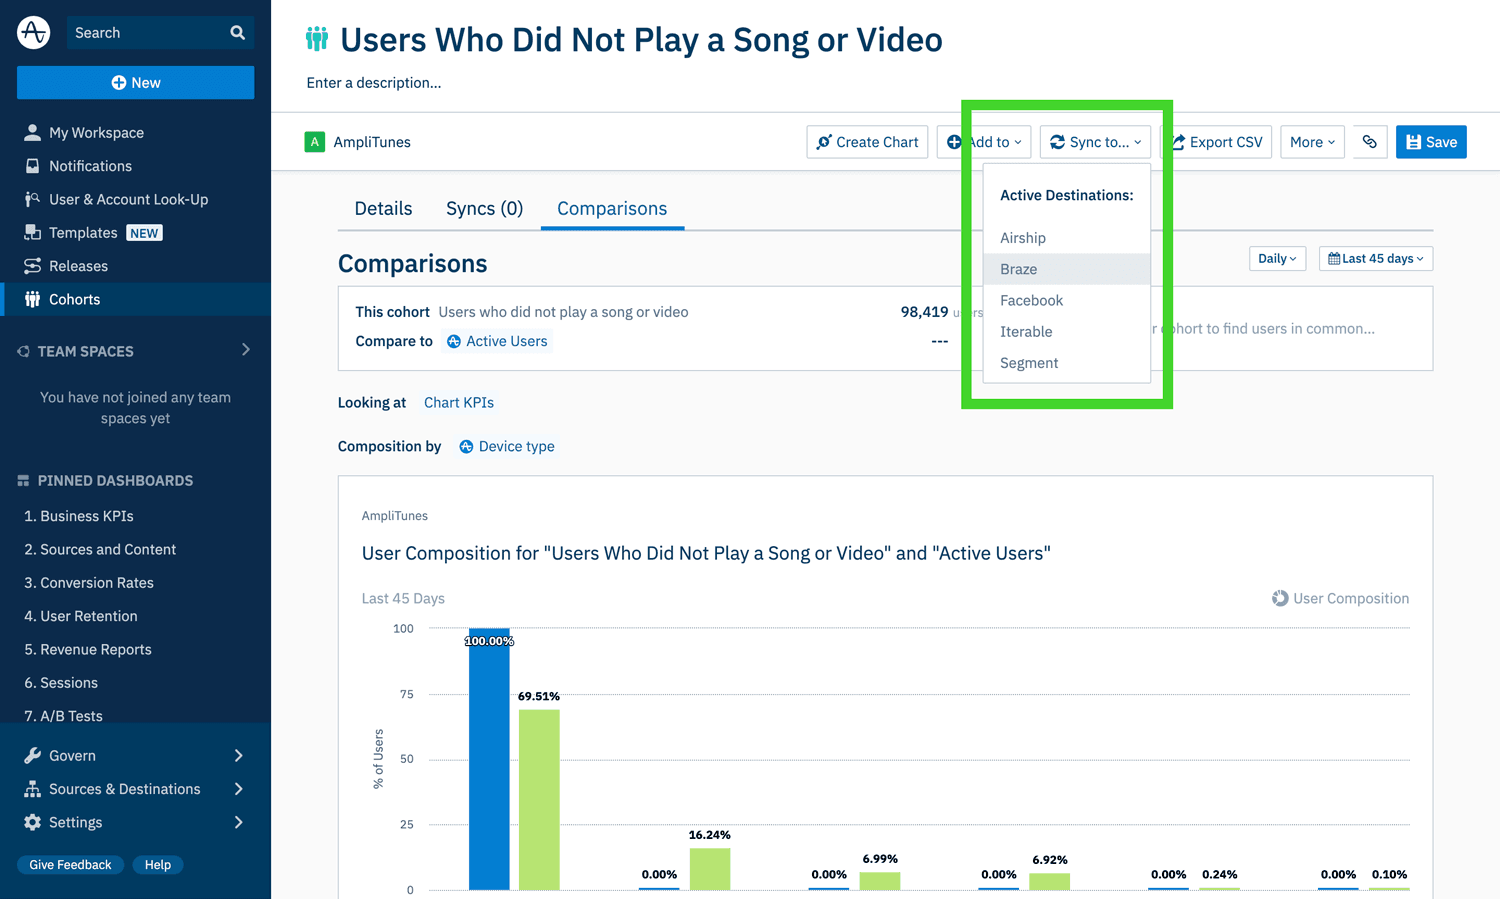
From here, you can make a cohort of the users associated with this data point. This will provide options to investigate further or even take action with this group of users. For example, you might use the Microscope feature to create a cohort of the users who did not play a song or video. Then, using another Amplitude feature called Engage, you could run a targeted marketing campaign offering an incentive to this group of users to begin playing music.
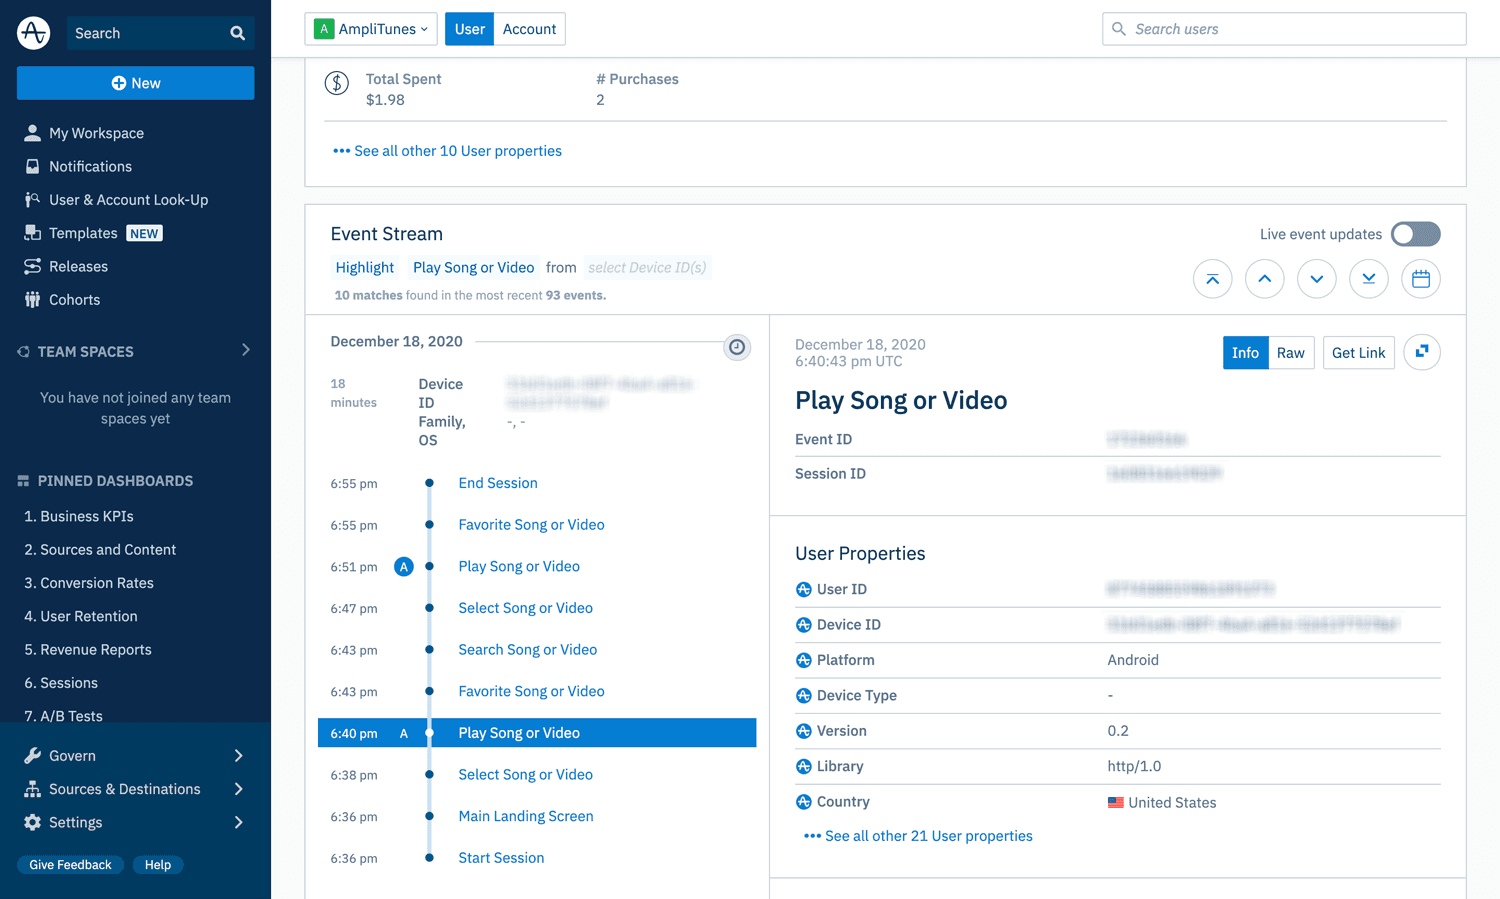
That’s just one way to dive deeper. In the Microscope tooltip, you can also select “View Users” to see the actions that individual users performed in addition to the selected data point.
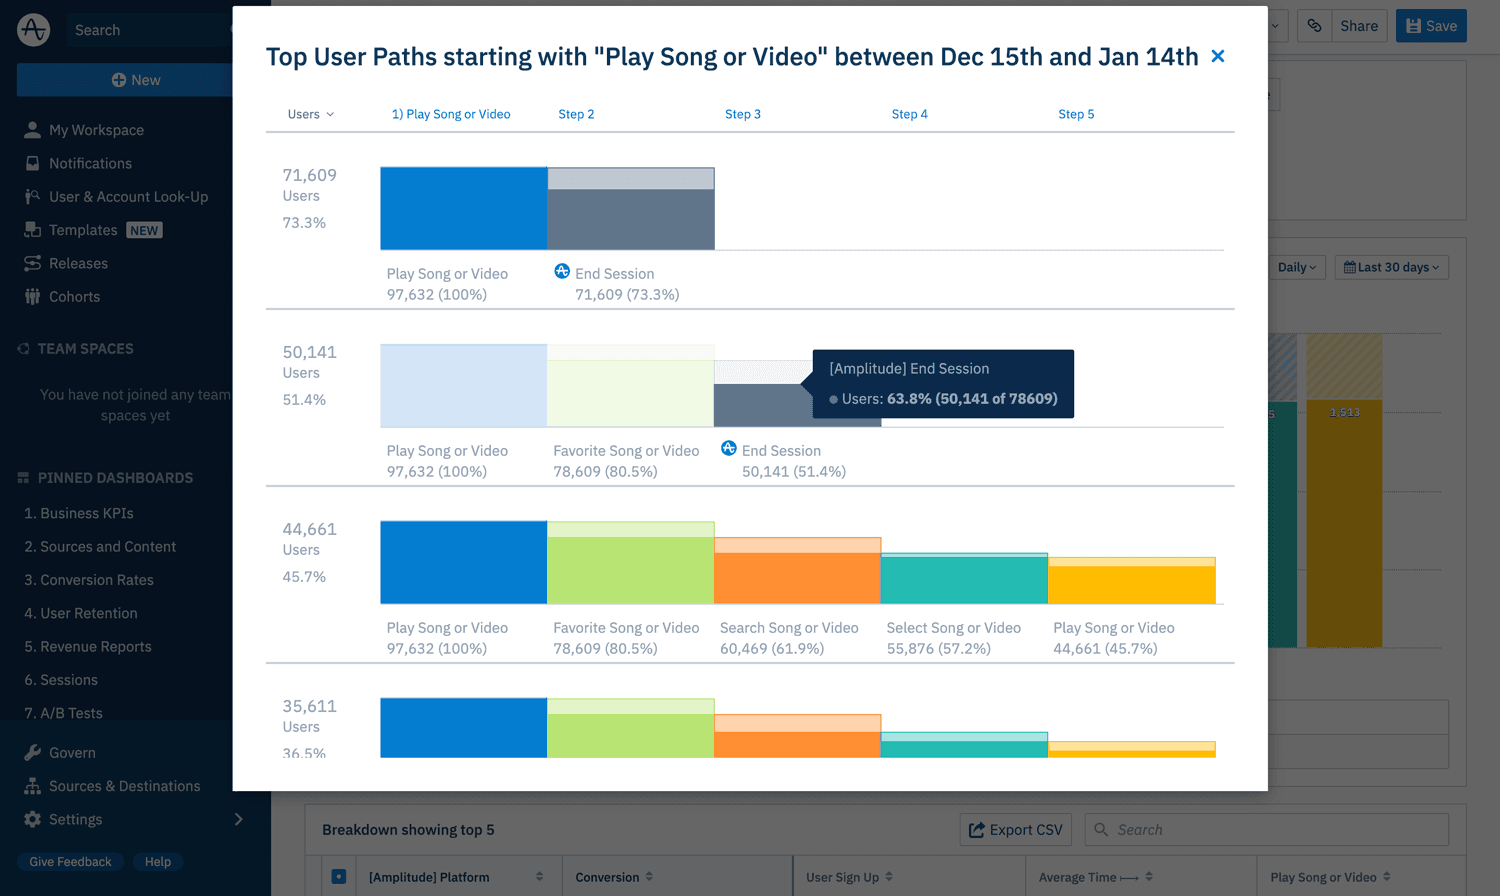
Or, you could select “Show User Paths” to see the common paths that users take before or after performing the action at your selected data point.
One of the most revealing ways to analyze the customer experience further, though, is through Conversion Drivers in Amplitude.
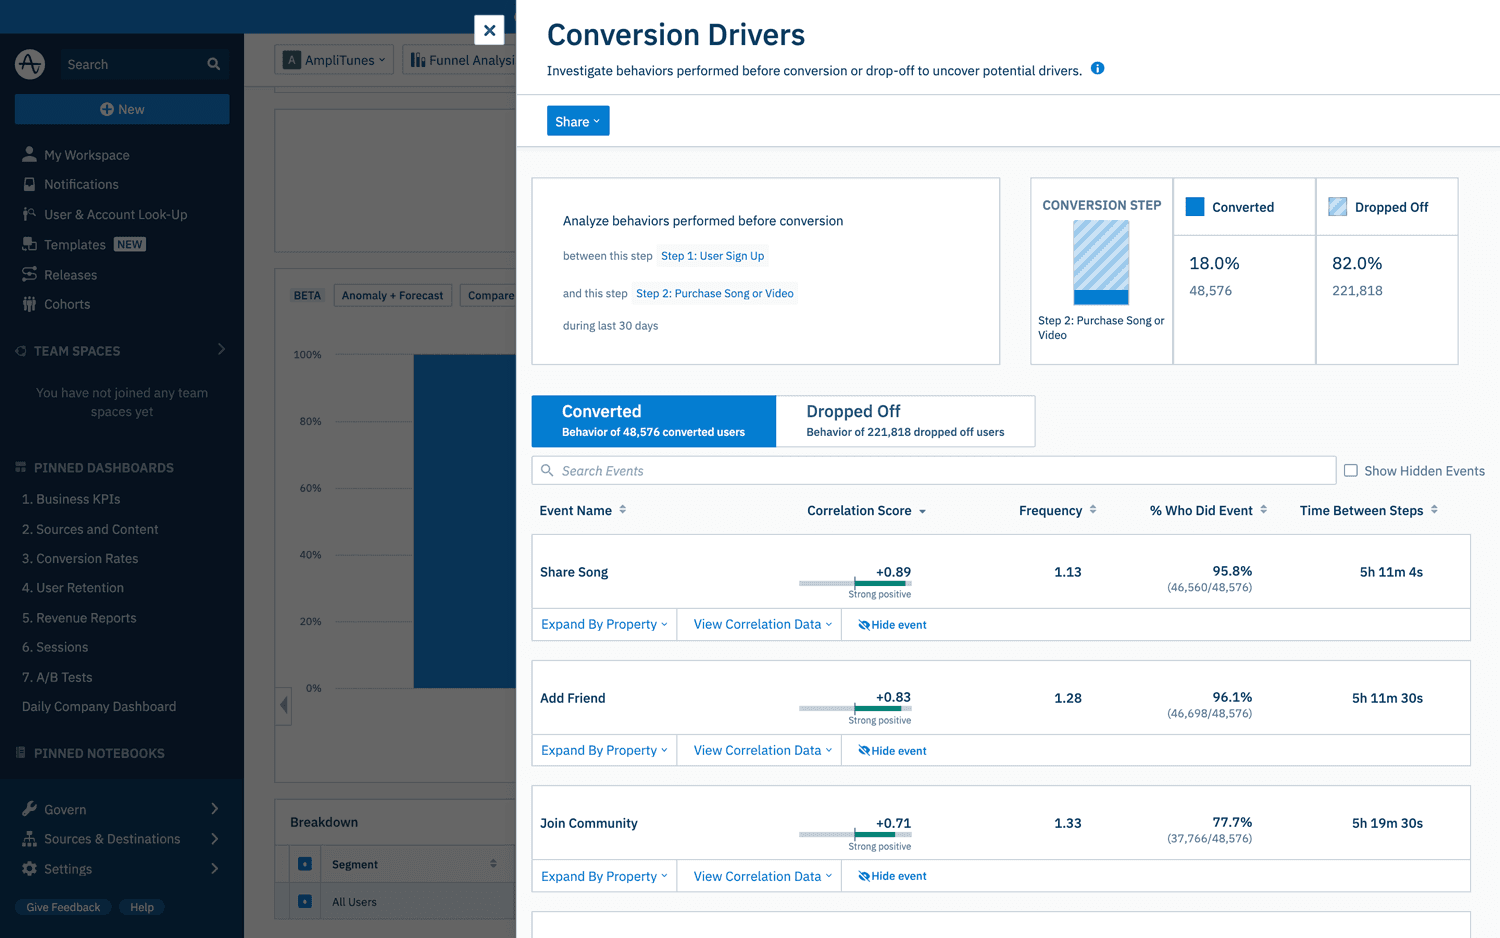
With Conversion Drivers, Amplitude will show you exactly which events in your product are highly correlated with users dropping off or completing an action. In other words, you can select a starting event (A) and desired endpoint (B). Conversion Drivers will then determine which other behaviors occurred in-between A and B, and which of those behaviors were highly correlated with successfully completing event B.
In the example below, Conversion Drivers is used to determine which actions are driving new users to purchase a song in the music streaming app. The feature shows that social actions—such as adding a friend, joining a community, or sharing a song—are highly correlated with driving users from “sign up” to “purchase song.” Based on this insight, the product team may elect to make the “share a song” element a required step of onboarding for new users.
While there are many ways to analyze the customer experience in Amplitude, Journeys may offer the most panoramic view.
Journeys in Amplitude showcases the different steps users take between a starting action and desired state. In our music streaming app example, the journey your team might be most interested in investigating could be when users go from favoriting a song to purchasing it. With one click, Journeys will show every path a user could have taken from favoriting to purchasing. There are many different ways to sort, filter, or slice-and-dice this visualization to be as broad or specific as your team needs.
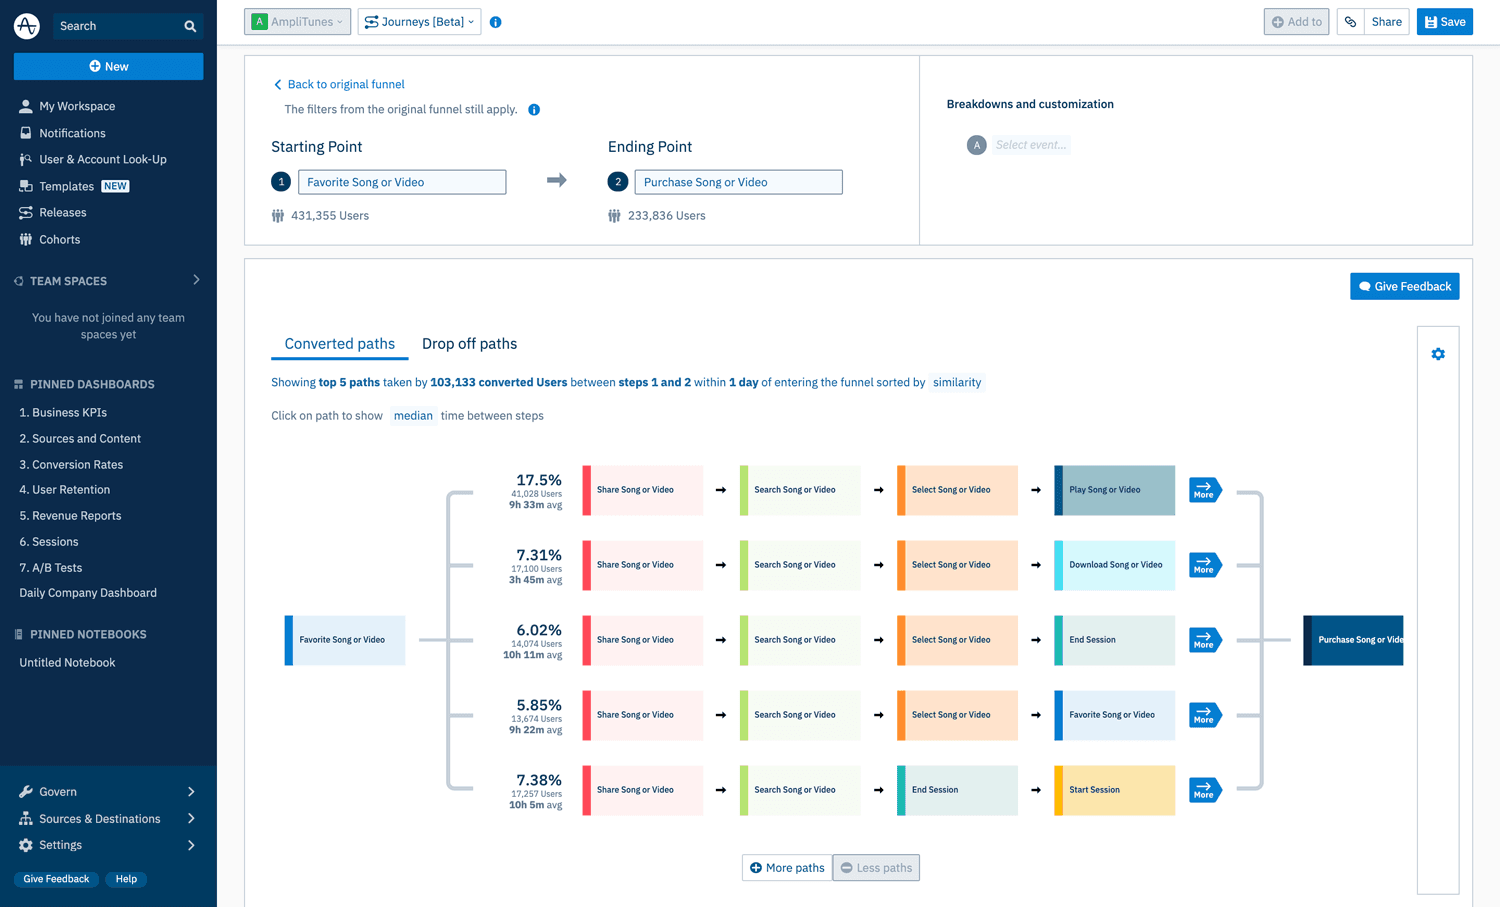
Completely unique to Amplitude, Journeys goes beyond session-based analysis and enables you to track user journeys across any product and any period of time. Considering how many sessions often happen before converting (or churning), the ability to track them makes your customer experience analysis comprehensive.
Step 3. Assess Users Who Are Not Converting
By assessing your drop-off paths in Journeys, you can quickly note where you are losing the most users in the overall user journey.
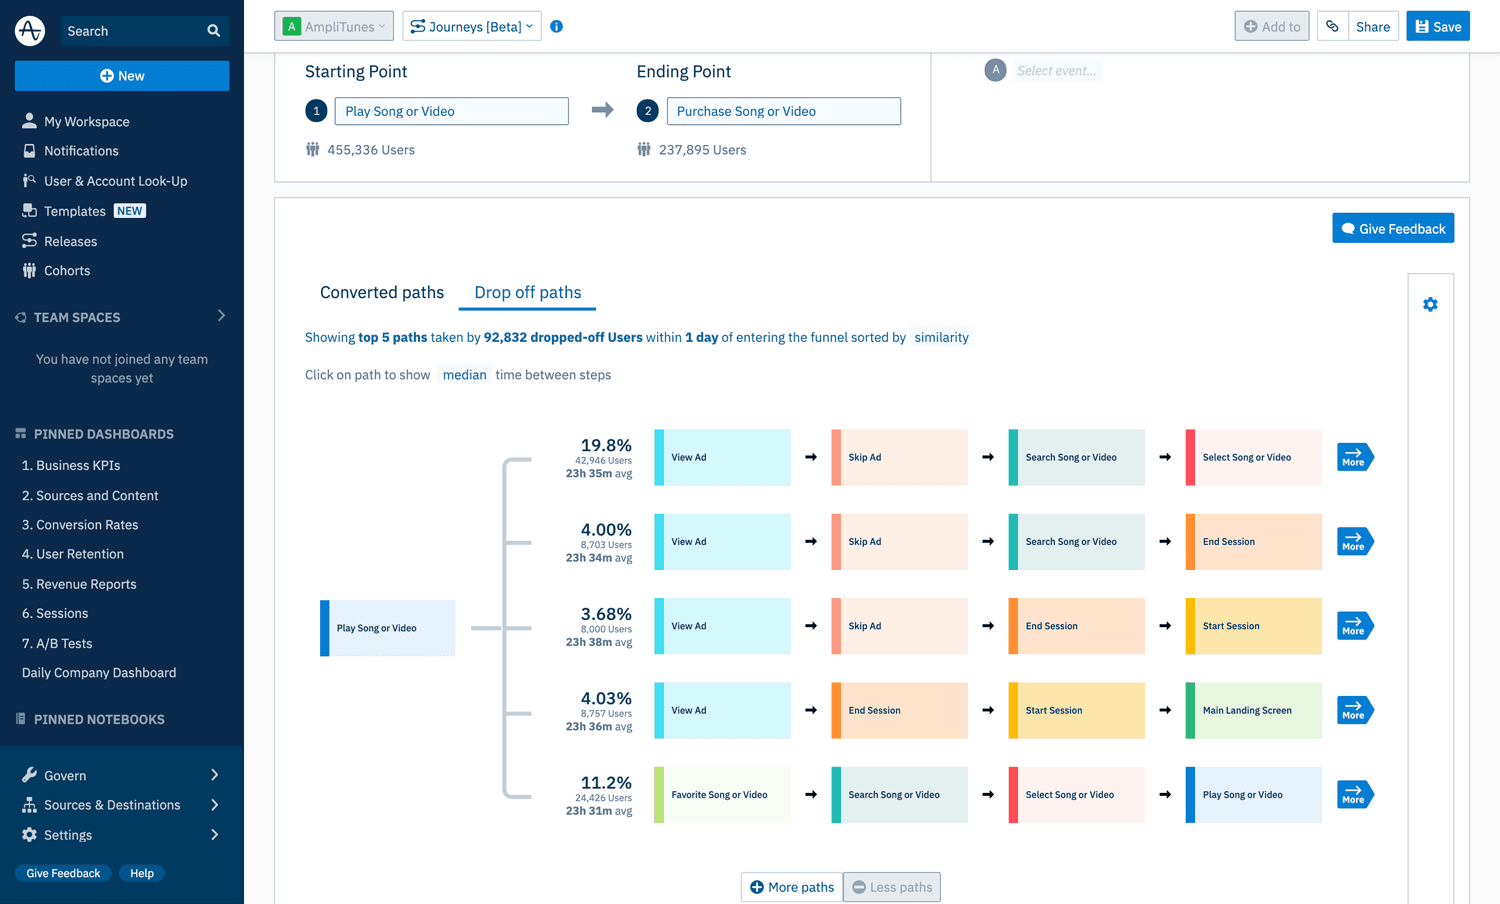
From the chart above, we can see a variety of opportunities to improve customer experience. A number of users playing a song seem to have gotten stuck in an endless ad loop, leading them to bounce and not convert. Others ended their session after seeing the concert landing screen, suggesting that there may be issues with that particular feature.
Once you have a sense of where users are dropping off due to a negative customer experience, you can begin to target improvements for that experience.
Step 4. Improve Your Customer Experience
Once you’ve analyzed the ins-and-outs of the customer journey—where users are getting stuck, where they’re finding value, which actions drive conversion and which user groups behave in certain ways—you’ll have the information you need to improve the product and your customers’ experience.
Having followed the steps up until this point, let’s say we want to improve the customer experience of users who keep getting stuck on ad loops. First, save your current cohort.
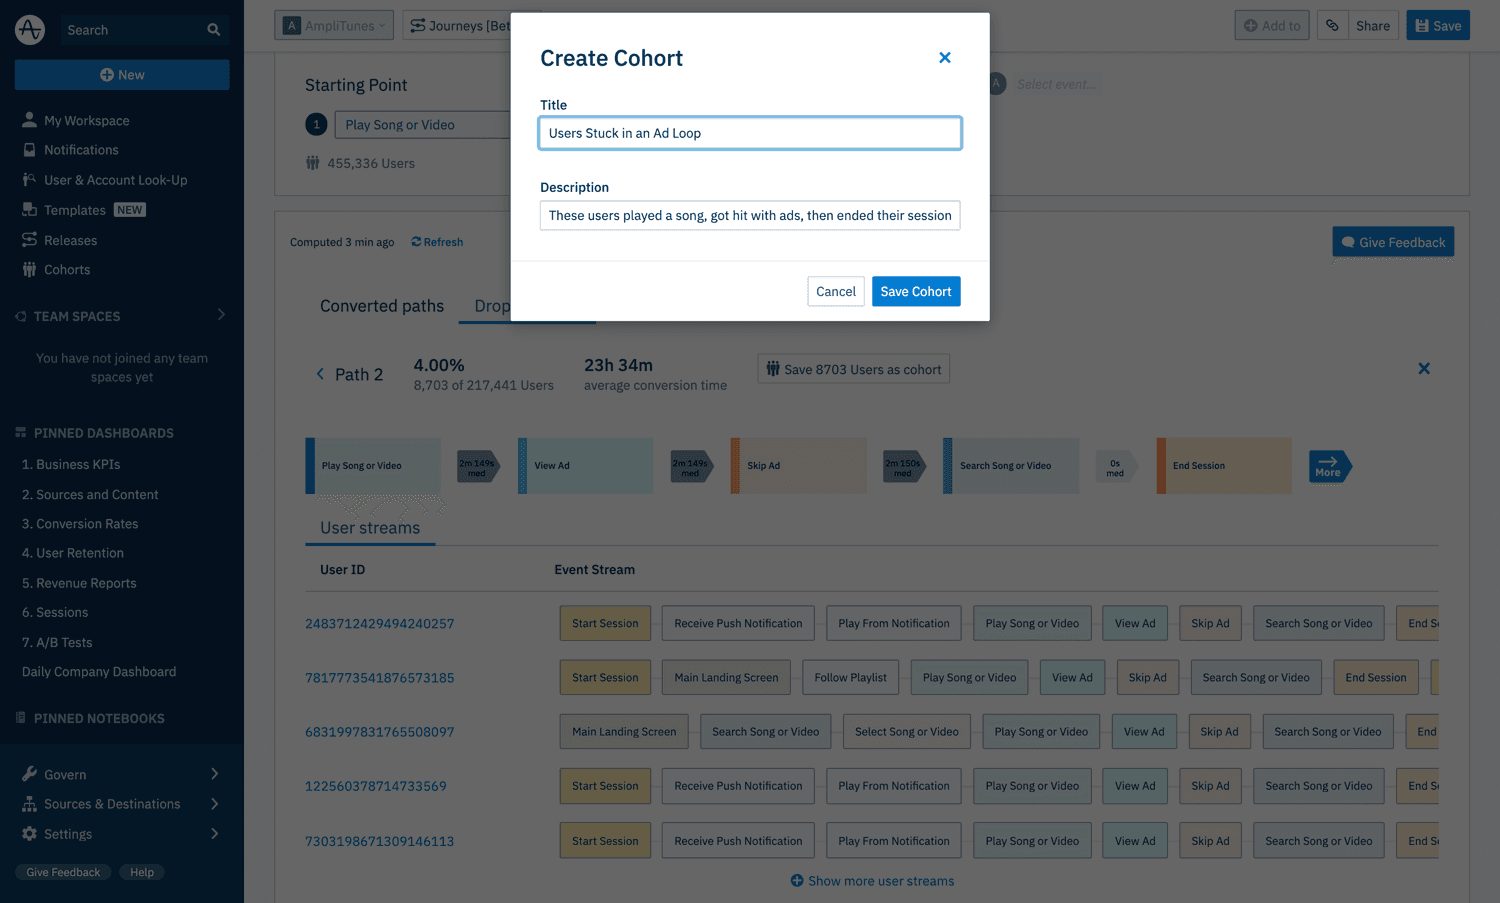
After that, sync the cohort using Amplitude’sEngage feature, which allows the easy integration of your cohort with other tools that can help you improve your customer experience. For example, you can sync the cohort to Braze or Airship and send a targeted email campaign to these users. That way, the messaging your users receive is personalized based on their experience with your product.
Or, you might launch A/B testing with your testing provider or sync the cohort withAppcues to provide in-app notifications that will ease conversions. With the music streaming app example, that notification might be, “Subscribe now for an ad-free experience.”
Engage equips teams to immediately take action to improve their customer experience, whether that’s adjusting on-page signaling or sending promo codes to users.
Of course, the communications you send to your customers encompass just one method of improving their overall experience with your product. Other improvements may include shipping new features, offering more hands-on support, or overhauling the onboarding experience. No matter which improvement you ship, the reasoning for it should be based in data. And if you used product analytics to investigate the customer experience, you can use the same tool to analyze the impact of improvements too.
Use Customer Experience Analysis to Boost Your ROI
Companies need to make sure their products deliver very pronounced ROI if they want to retain customers. To create a valuable product, teams must have a deep understanding of user needs and behavior.
The key means of performing this customer experience analysis? Product analytics.
Product analytics offers an unparalleled degree of flexibility compared to other customer experience analysis platforms. It provides a full view of your user journey, not restricted by sessions or devices, to show where customers are progressing and getting stuck. With product analytics’ insights, your team can easily determine where to make customer experience improvements.

Carolyn Feibleman
Principal Product Manager, Amplitude
Carolyn Feibleman is a principal product manager at Amplitude, where she focuses on helping companies adopt digital analytics to build better products and experiences.
More from Carolyn
